---
title: Run JMeter test from GIT using Jenkins
url: https://blog.octoperf.com/run-jmeter-test-from-git-using-jenkins/
date: '2021-07-15'
authors:
- sjenkins
categories:
- JMeter
tags:
- JMeter
- Shift Left
- Git
- Jenkins
- CI/CD
- Domain Specific Language
- Groovy
description: 'Shift left with JMeter: move the testing to an earlier stage in the project lifecycle. Looking at how JMeter tests can be run from a GIT repository from Jenkins.'
---
# Run JMeter test from GIT using Jenkins
You may have heard the term [shift-left](https://en.wikipedia.org/wiki/Shift-left_testing "shift-left") testing which is essentially moving the testing to an earlier stage in the project lifecycle, essentially the activity is moved to the left on the project timeline.
The benefits of testing earlier have always been understood but not always happened when we consider performance testing which in some cases is still left until the very end of the delivery process.
With many organisations that use an [Agile Approach](https://en.wikipedia.org/wiki/Agile_software_development "Agile Approach") to development, **having a shift-left approach to performance testing** becomes important as otherwise this may impact on your Continuous Integration / Continuous Delivery ambitions if every couple of weeks you have to wait for a performance or scalability or soak test to be run before promoting your code to production.
In this post we are going to look at how we can execute our performance tests on a regular basis in parallel with the development activity using the tools that development teams use.
**We are going to look at running a simple performance test using Jenkins with tests that are version controlled in a GIT repository** and whilst it is a simple example it will give you an understanding of the process for you to expand on and shows how your tests can be run using technologies used to deliver the code to testing environments and production, effectively integrating your performance testing into the development activity.
## Set-up
To understand how we build and execute a [JMeter](https://jmeter.apache.org/ "JMeter") test from a [GIT repository](https://en.wikipedia.org/wiki/Git "GIT repository") from [Jenkins](https://en.wikipedia.org/wiki/Jenkins_(software) "Jenkins") we are going to set up a local version of Jenkins, set up a BitBucket account for out GIT repository and build our simple test.
In your organisation you will probably have a build tool of some sort and a code repository **and this should be used for your real shift-left testing**.
These set up steps are purely to demonstrate the process in this Blog Post, or for you to experiment with for those without access to these tools.
### Jenkins
The definition of Jenkins is:
> _Jenkins is a free and open source automation server. It helps automate the parts of software development related to building, testing, and deploying, facilitating continuous integration and continuous delivery._
**It is one of the most common automation servers and widely used for code deployment which makes it ideal to support our performance testing.**
We are not going to spend too much time stepping through the set-up steps as it’s easy to follow and well documented online.
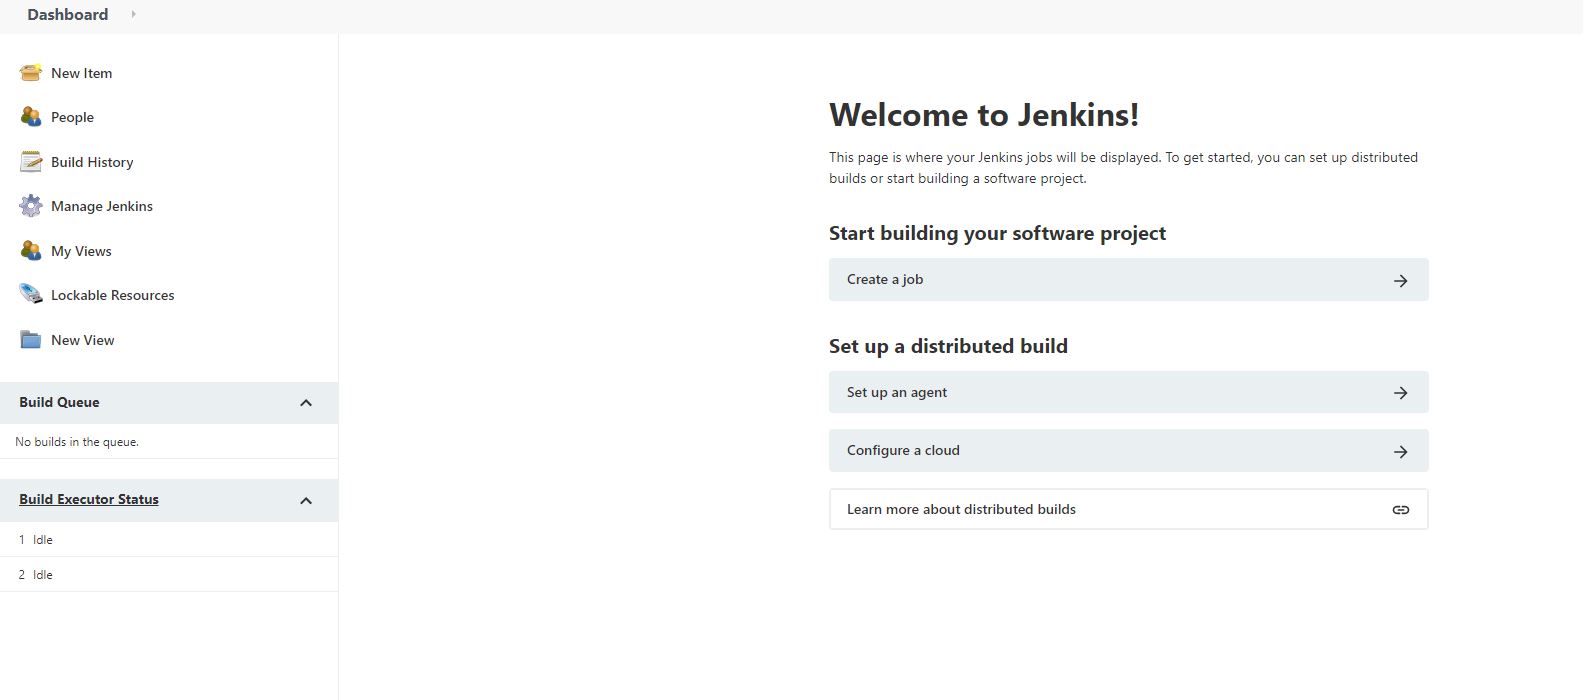
Download a stable version of the Jenkins server from [here](https://www.jenkins.io/download/ "here") and follow the installation steps you will then have a version of Jenkins running on your localhost.
### BitBucket
The definition of BitBucket is:
> _Bitbucket is a Git-based source code repository hosting service owned by Atlassian._
As we can create a free account, we will use this for this Post, **our organisation may use other technologies to control its source code and you can use these if you want.**
Again the set up is fairly straightforward and can be found [here](https://support.atlassian.com/bitbucket-cloud/docs/install-and-set-up-git/ "here").
Once installed you will be able to create a repository for your tests.
### JMeter Test
We want to create something simple as the purpose of the post is to demonstrate **how Jenkins and GIT can be used effectively to run your performance tests as part of development pipelines** or at least on a regular basis as development is in progress.
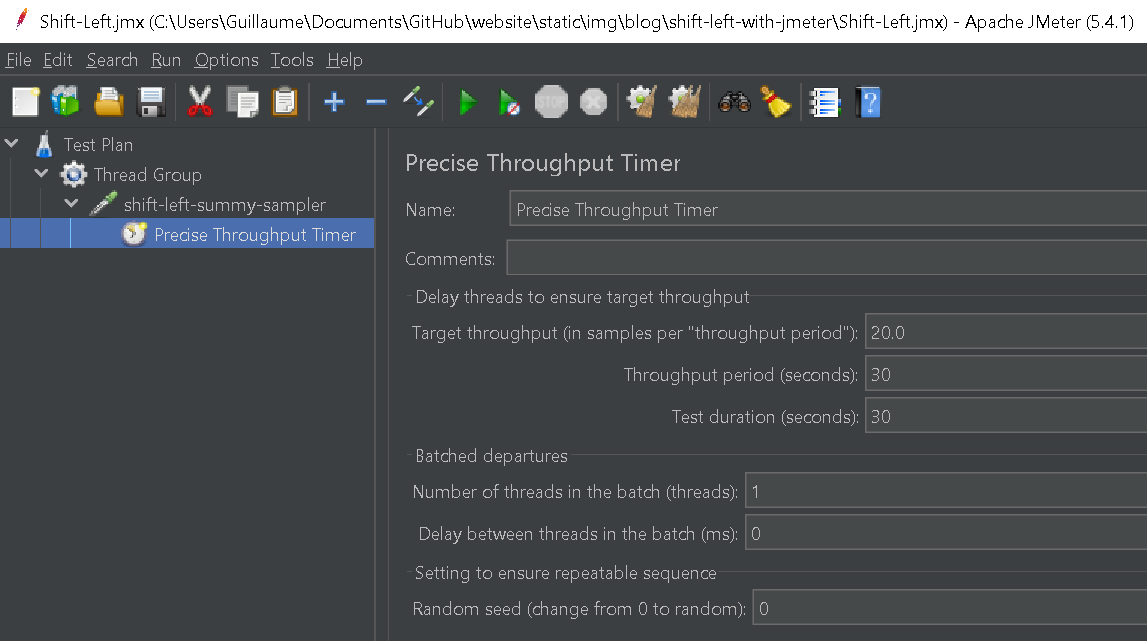
This is probably about as simple as you can get; our test consists of a single dummy sampler which we will configure to iterate 20 times in 30 seconds. You can download it from here.
Let’s run this from the command line.
```jmeter -n -t Shift-Left.jmx -l Shift-Left.jtl```

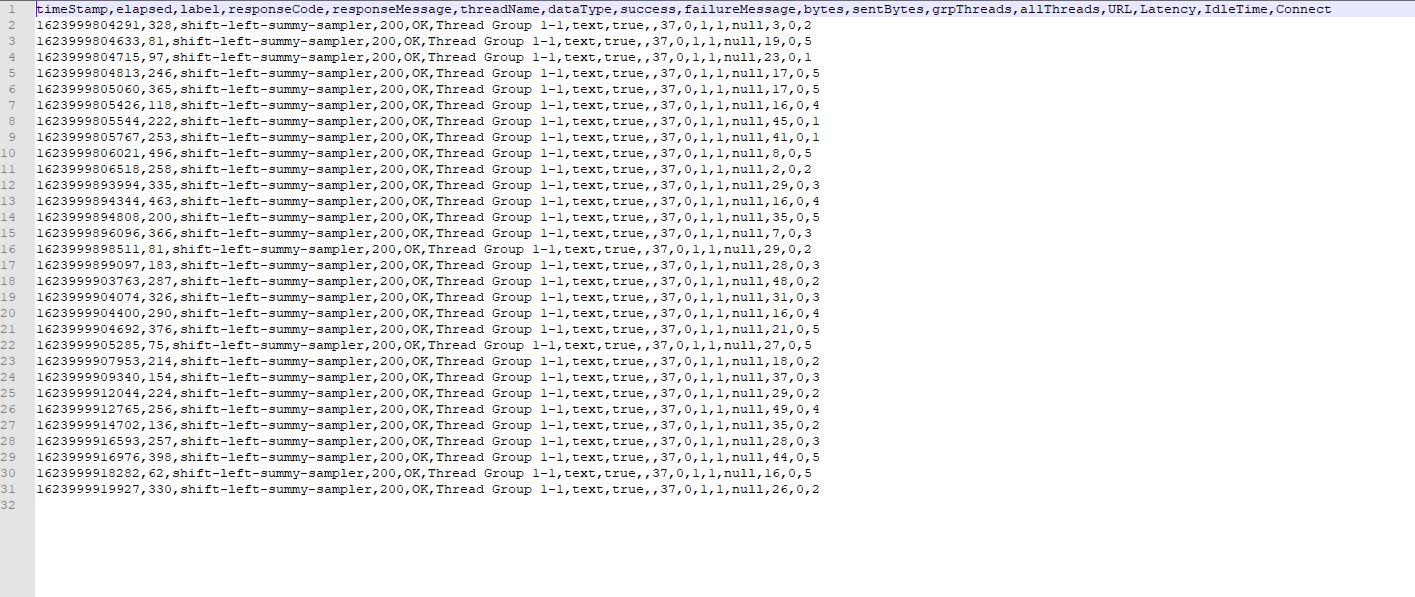
If we check the `.jtl` file, we can see the sampler requests.
### Creating our Git Repository
Now we have the building blocks for our tests let us create a new GIT repository using Bitbucket.
For the purposes of our post **we will not look at the fundamentals of how GIT or Bitbucket work** as this is not the topic of this post, much more information about GIT repositories and Bitbucket can be found here [https://support.atlassian.com/bitbucket-cloud/docs/tutorials/](https://support.atlassian.com/bitbucket-cloud/docs/tutorials/)
Select the *+ sign from the left-hand pane in Bitbucket and you will be presented with a dialog.
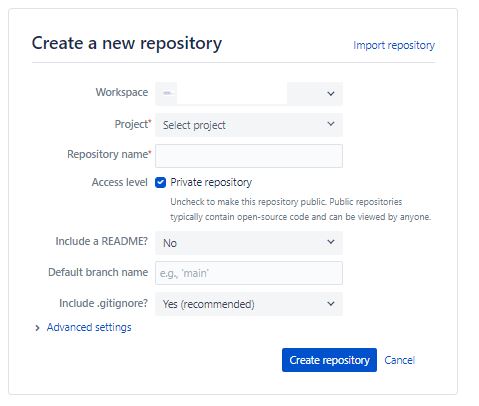
Create a *Project name* and *Repository*, we will call ours `performance-test-repo`.
Select *Create Repository* on the dialog and your repository will be created.
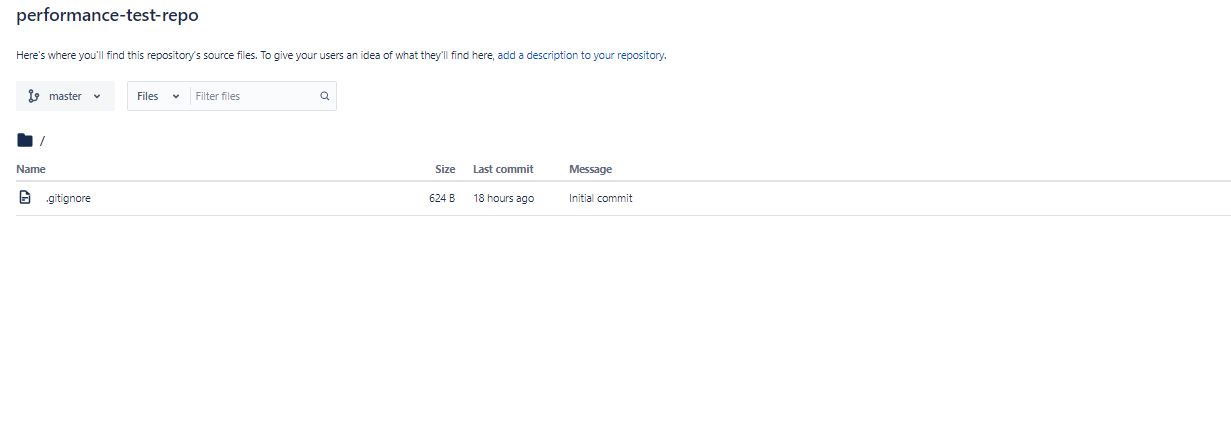
Now we have created our repository we need to clone it to our local machine so we can add our tests and a pipeline groovy file that will manage the execution of our Jenkins Scripted Pipeline.
Now I am aware that there may be terminology and concepts here that you may not be familiar with. **Jenkins scripted pipelines, domain specific language (DSL), groovy syntax** and these may be some of them. To explore them in more details is a new post in its own right and there is plenty of [information online](https://www.geeksforgeeks.org/devops/groovys-domain-specific-language-dsl-for-jenkins-pipelines/ "information online") about this subject.
We will cover the basics later in this post but a clear understanding of the principles of these concepts will allow you to expand your knowledge.
### Cloning our GIT repository
*If you are familiar with GIT then you can skip this section, just clone the repository you have created and move on*.
You will need a local installation of GIT, the steps to do this can be found [in this tutorial](https://git-scm.com/book/en/v2/Getting-Started-Installing-Git "in this tutorial").
If we select the Clone button from our Bitbucket repository you will be presented with this dialog:
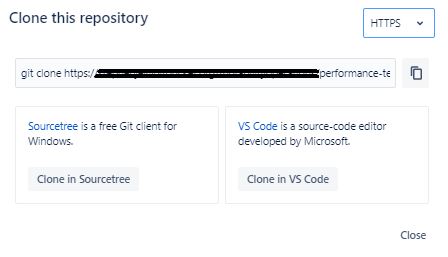
If you select the icon next to the field that contains the git clone command, then the command will be copied to your clipboard.
If you open a command prompt and either move to a file location you want your repository to be located in or create a new directory then firstly do this and then run the command you have copied.
For simplicity we will clone the contents of the repository into the same location as JMeter.

If we list the contents of this directory we see just the `.gitignore` file that was created with our new repository.

### Updating our repository
As our Jenkins pipeline will pull from our GIT repository before running, we need to make sure our script and Pipeline groovy file are added to our local copy of the repository and then these files added to our remote repository in Bitbucket.
We will look at the pipeline groovy file in the next section but for now let’s focus on **pushing our local files to the remote repository**.
Firstly, we will add two directories (scripts and pipelines) to our local version of the GIT repository.

We add our JMeter test to the scripts directory and our pipeline groovy file to the pipelines directory.
If we now go back to our command line, we used when we cloned the repository, we can push these local changes to Bitbucket.
Type `git add .` into the command line and then `git status`.
You will see that our changes are ready to be committed:

Type `git commit -m “Octoperf tests added” ` into the command line:

Type `git push` into the command line:
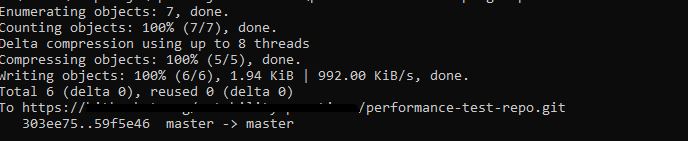
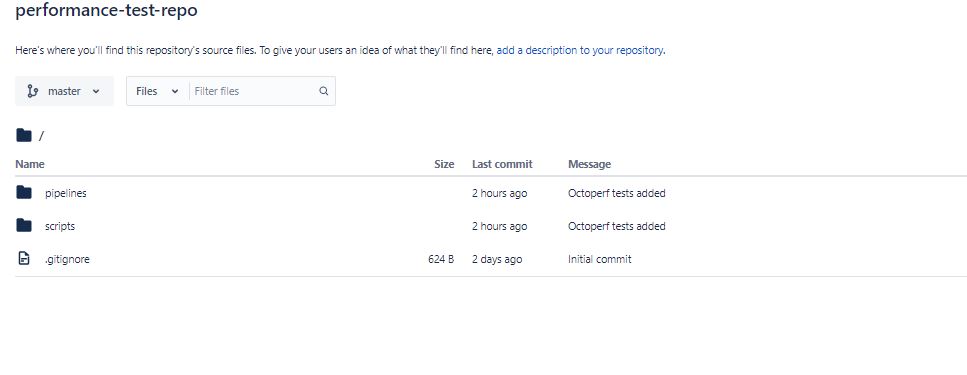
If we now go to our Bitbucket repository we can see our files have been added.
## Pipeline Groovy
We have referenced the pipeline groovy file on a number of occasions in this post and now is the time to look at what it contains, before we do this post uses a scripted pipeline to execute the tests but there are other ways.
**As mentioned before the objective of this post is to demonstrate a working example of JMeter in Jenkins using a GIT repository and therefore will not take a detailed look at the other ways, several good articles on this subject are [here](https://www.jenkins.io/doc/book/pipeline/jenkinsfile/#using-a-jenkinsfile "here") and [here](https://www.theserverside.com/answer/Declarative-vs-scripted-pipelines-Whats-the-difference "here").**
Let’s look at the octoperf-pipeline.groovy file
``` groovy
#!/usr/bin/env groovy
node {
stage('Initialise') {
/* Checkout the scripts */
checkout scm: [
$class: 'GitSCM',
userRemoteConfigs: [
[
url: "https://bitbucket.org/xxxxxxxxxxxx/performance-test-repo.git",
credentialsId: "octoperf-user"
]
],
branches: [[name: "master"]]
], poll: false
}
stage('Complete any setup steps') {
echo "Complete set-up steps"
}
stage('Execute Performance Tests') {
dir("${WORKSPACE}/scripts") {
bat 'c:/apache-jmeter/apache-jmeter/bin/jmeter.bat -n -t Shift-Left.jmx -l Shift-Left.jtl'
}
}
stage('Analyse Results') {
echo "Analyse results"
}
}
```
If we step through the script, at the top we refence the location of groovy by searching your path
```#!/usr/bin/env groovy```
Then we have a node block, which according to the Jenkins documentation is:
> _A node is a machine which is part of the Jenkins environment and is capable of executing a Pipeline._
Under our node we have four stages which allows us to group our tasks being executed in the pipeline.
Our four stages are:
- Initialise,
- Complete any setup steps,
- Execute Performance Tests,
- Analyse Results.
As you can see two of these are empty and just have an echo command, these are here just to demonstrate what you could do with your tests being run through Jenkins where you could have any number of tasks being run before and after your tests to tidy data, analyse results for example.
The two stages that do contain code are the *Initialise* one that contains
```
stage('Initialise') {
/* Checkout the scripts */
checkout scm: [
$class: 'GitSCM',
userRemoteConfigs: [
[
url: "https://bitbucket.org/ xxxxxxxxxxxx /performance-test-repo.git",
credentialsId: "octoperf-user"
]
],
branches: [[name: "master"]]
], poll: false
}
```
**This SCM step is where we check out our repository from version control,** the key points are the _URL_ which is your repository location in Bitbucket, the _credentialsId_ which we will create in the next section but is effectively a user created in Jenkins that has permissions to access your Bitbucket repository; and finally there is branches and as we have checked all our code to the master we define this here.
The other stage is the *Execute Performance Tests*, this contains
```
stage('Execute Performance Tests') {
dir("${WORKSPACE}/scripts") {
bat 'c:/apache-jmeter/apache-jmeter/bin/jmeter.bat -n -t Shift-Left.jmx -l Shift-Left.jtl'
}
}
```
The key points in this stage are the dir command which takes a global variable `${WORKSPACE}` which is where Jenkins builds your project: it contains the source code Jenkins checks out, plus any files generated by the build itself and then from here it switches to the scripts directory.
We then run a command that executes our script using our local installation of JMeter and outputs the results to our `${WORKSPACE}` directory.
Now as stated throughout this post this is clearly a simple example and running on your local machine against a local copy of JMeter will not be something you would do as part of Shift-Left testing.
**You would want to be using your enterprise Jenkins instance and enterprise version control repository but fundamentally the only things that change under these conditions are which repository you check your test into and which JMeter instance you run them against.**
Aside from that the process is identical. We will discuss later in this post how you can get JMeter to run on a Jenkins server that does not have it installed as this is something that is relatively straightforward to do.
## Building the Jenkins pipeline
Now we have discussed the groovy file we can build the Jenkins job to execute our test.
Firstly, we need to set up a user in Jenkins that has access to your Bitbucket repository as these are the credentialsId we use in our pipeline groovy file.
From your Jenkins *Dashboard* select *Manage Jenkins*:
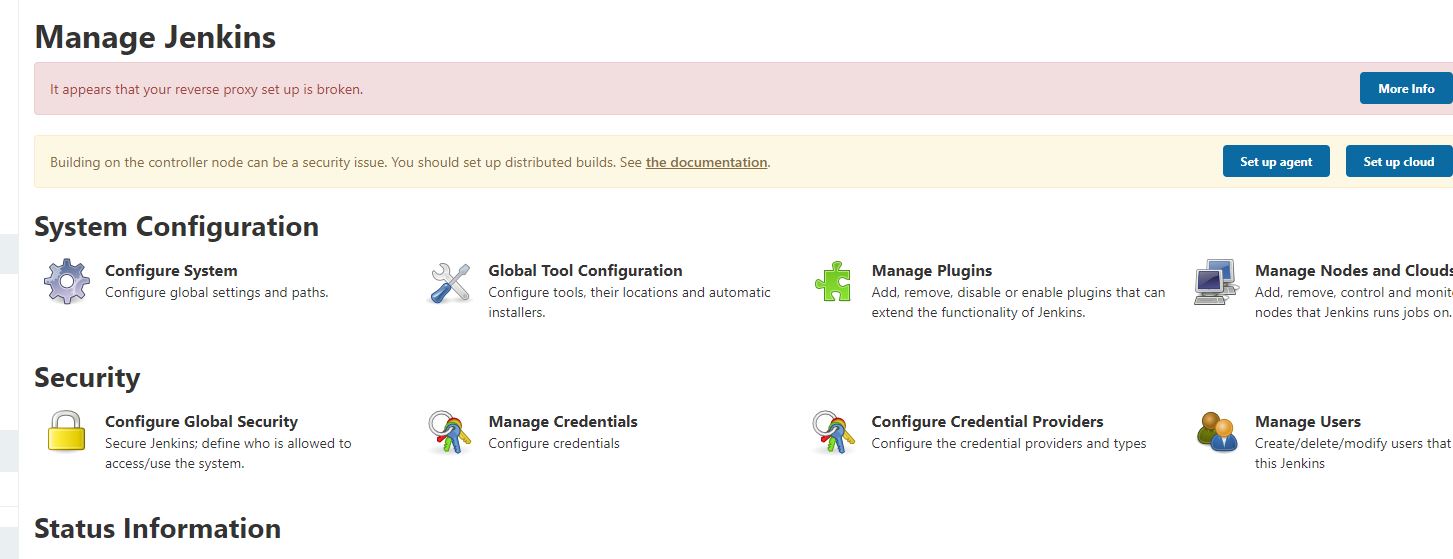
Then select *Manage Credentials*:

Select the Jenkins user:

Select *Global credentials (unrestricted)*:

Select *Add Credentials* and enter you Bitbucket username and password and provide an *ID* and *Description*:
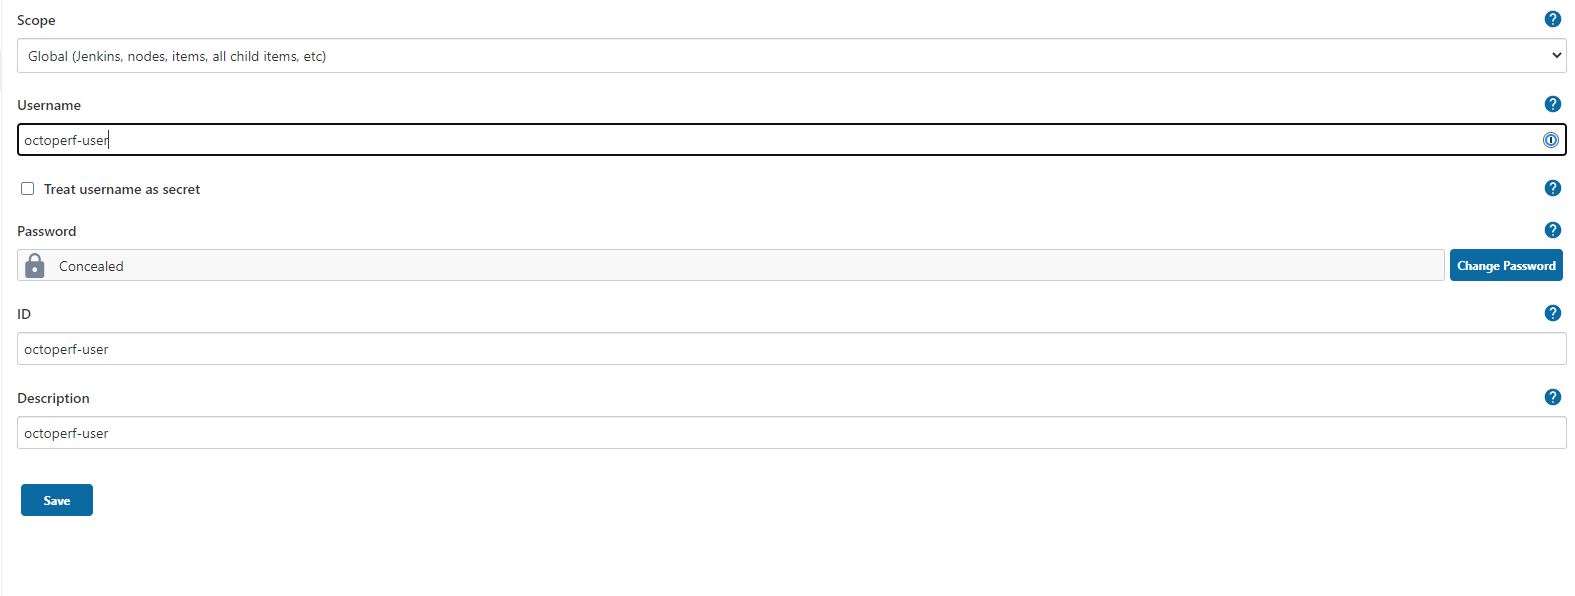
The ID is the value you use in your pipeline groovy file.
You will need a sysadmin to do this for you on your enterprise Jenkins instance, you will probably find that an account to access your enterprise version control repository already exists and is configured and you just need to use it in your pipeline groovy file.
If we go back to our Dashboard we can create our Jenkins pipeline:
Select *New Item*.
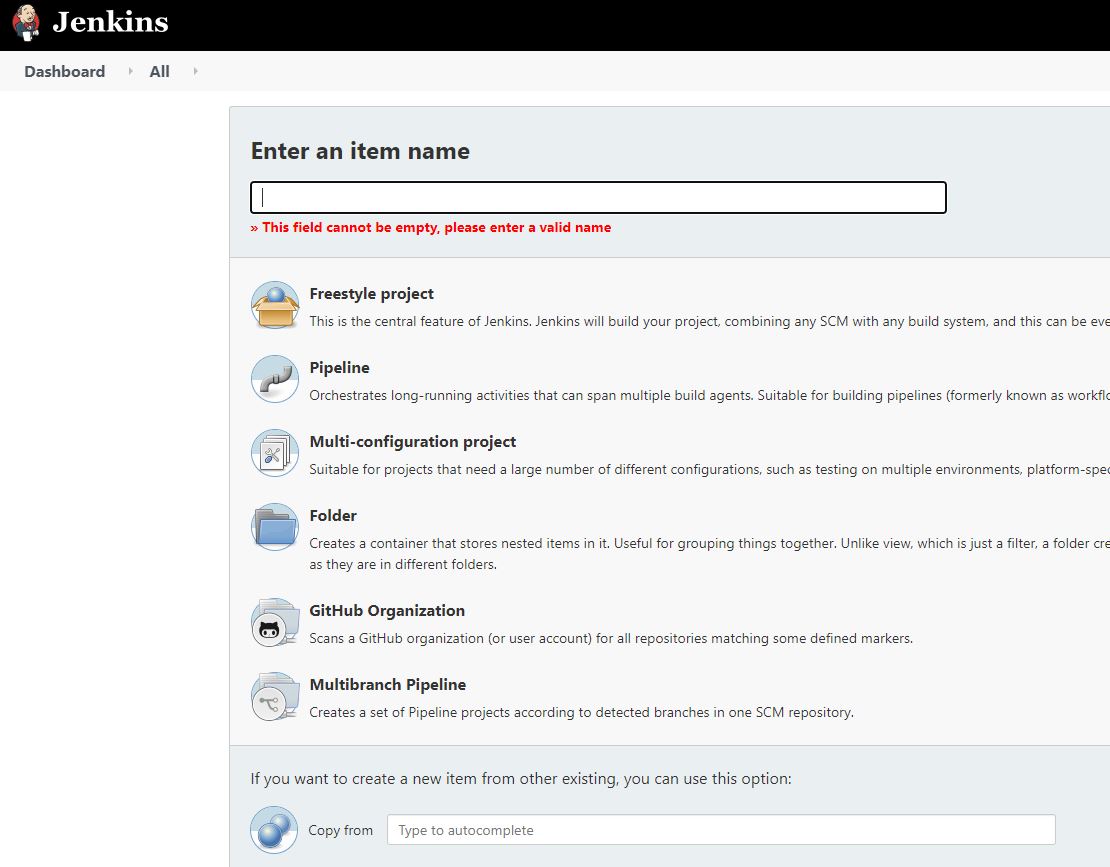
Enter a name, select *Pipeline* and press *OK*.
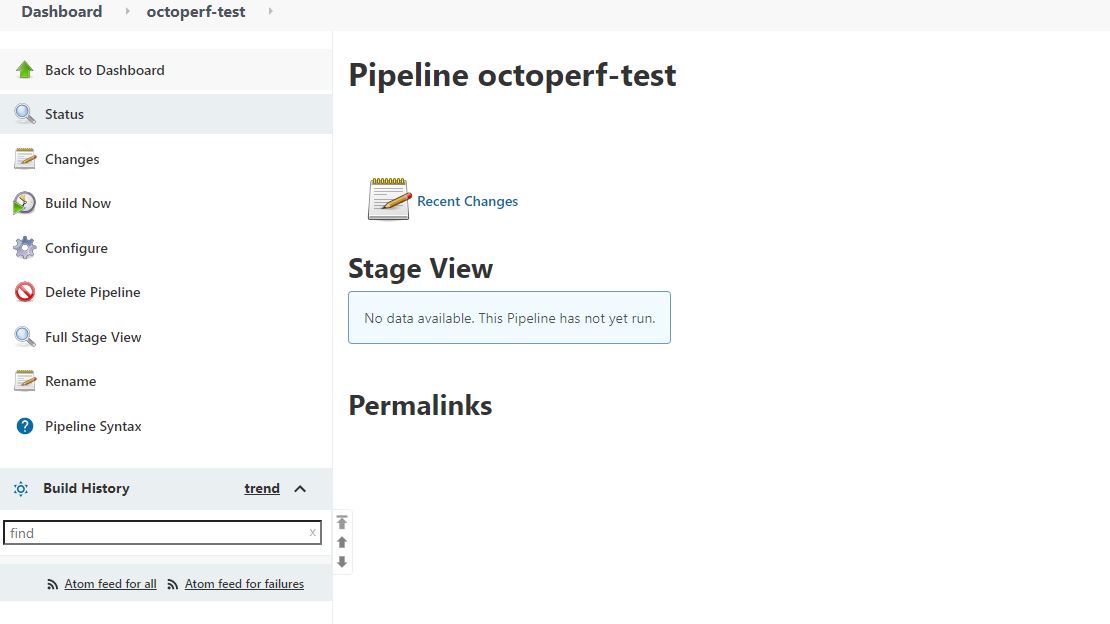
Select *Configure*
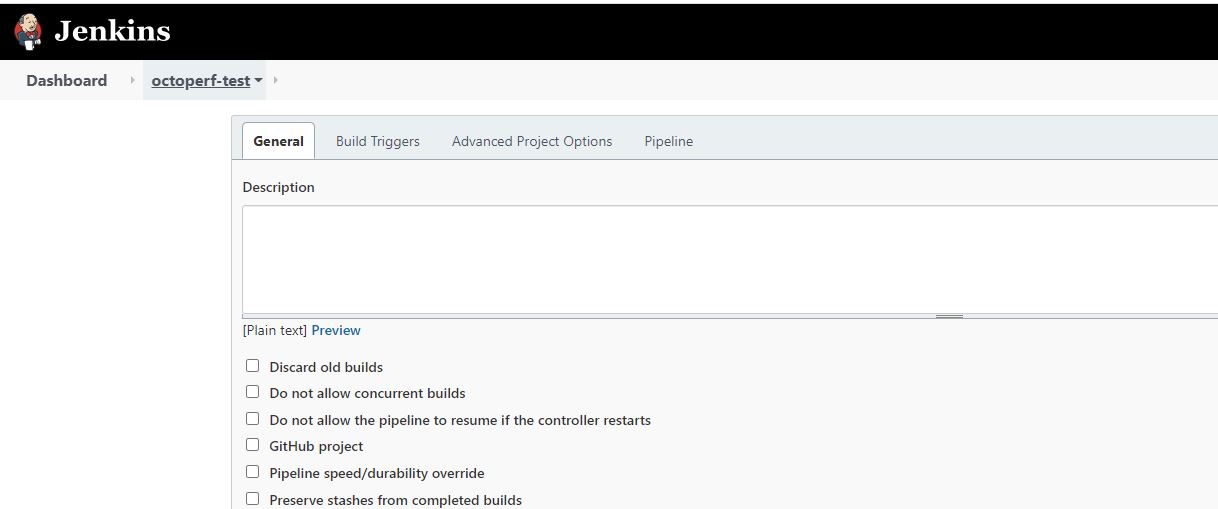
There are a lot of options under *General* and *Build Triggers* and we are going to discuss some of these options later in this post.
If you want to understand these options more there is a significant amount of information to be found online.
The only configuration we need to do is under *Pipeline*.
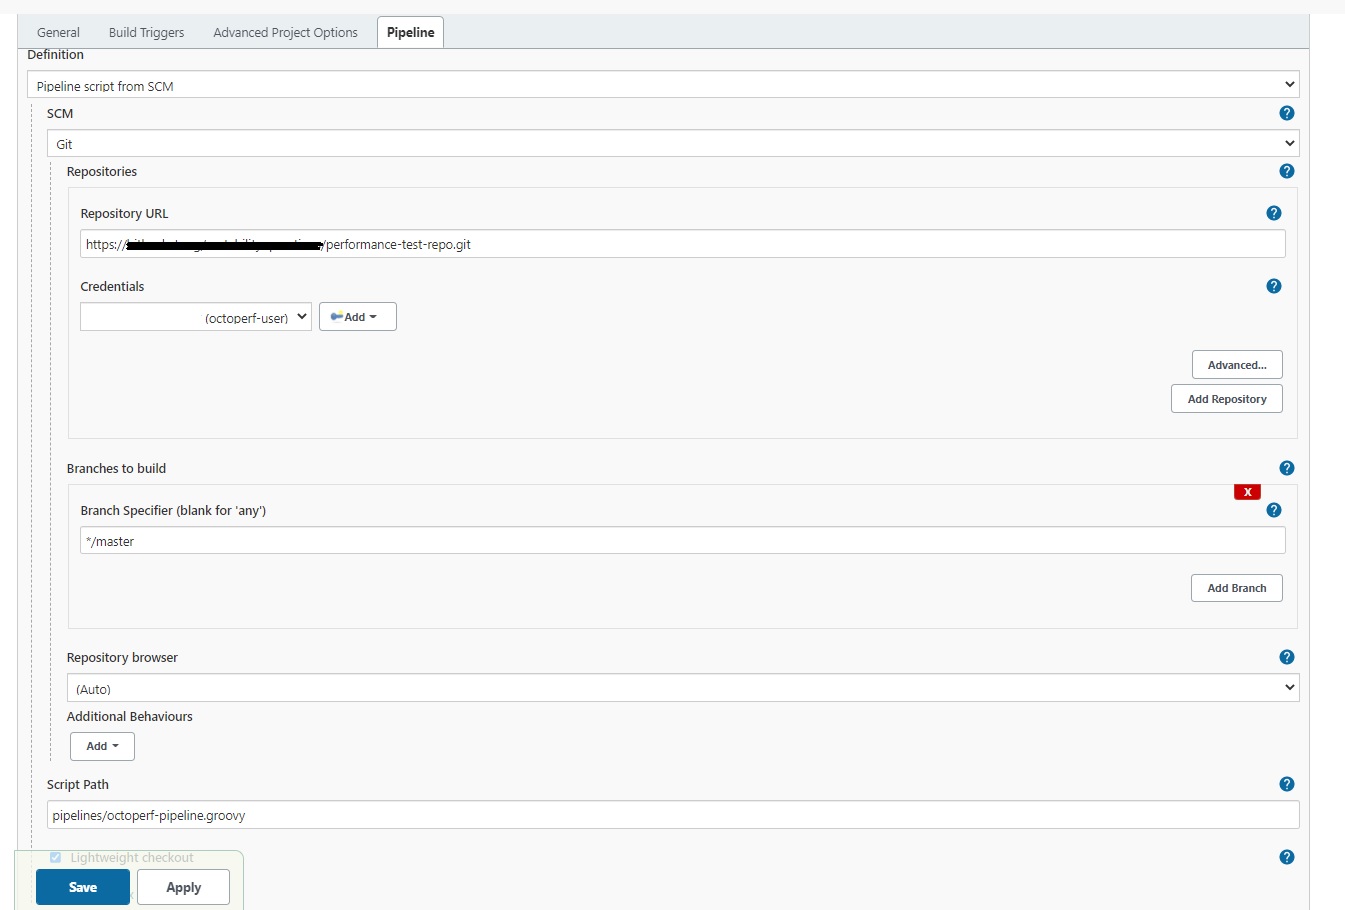
* Under *Definition* you select *Pipeline* script from SCM from the dropdown list.
* Under *SCM* select *GIT* from the dropdown list.
* Enter the URL of our Bitbucket repository.
* Select the credentials we created earlier.
* Set the branch to be master.
* Set the *Script Path* of our pipeline groovy file.
* Press *Save* and your pipeline is created.
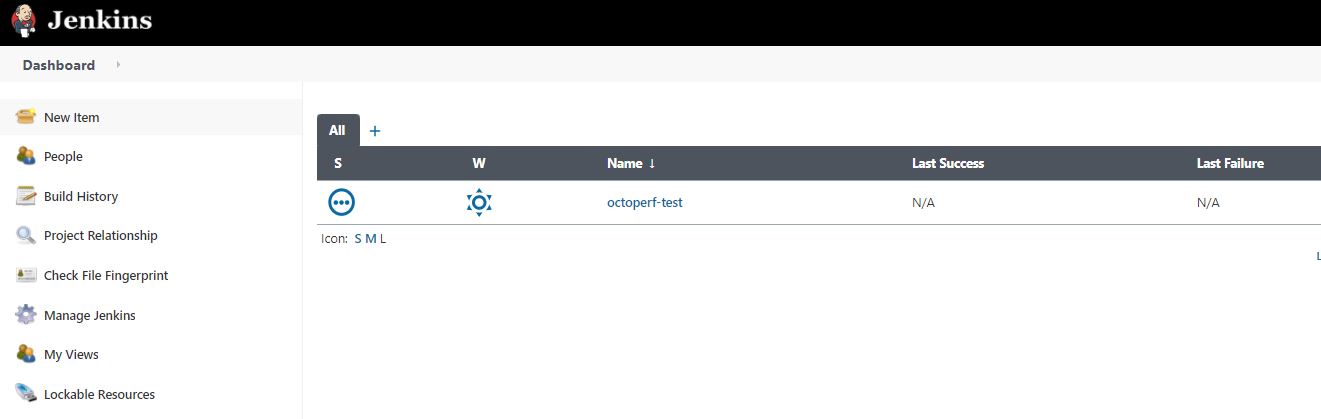
If we select our pipeline and then select the Build Now sidebar option.
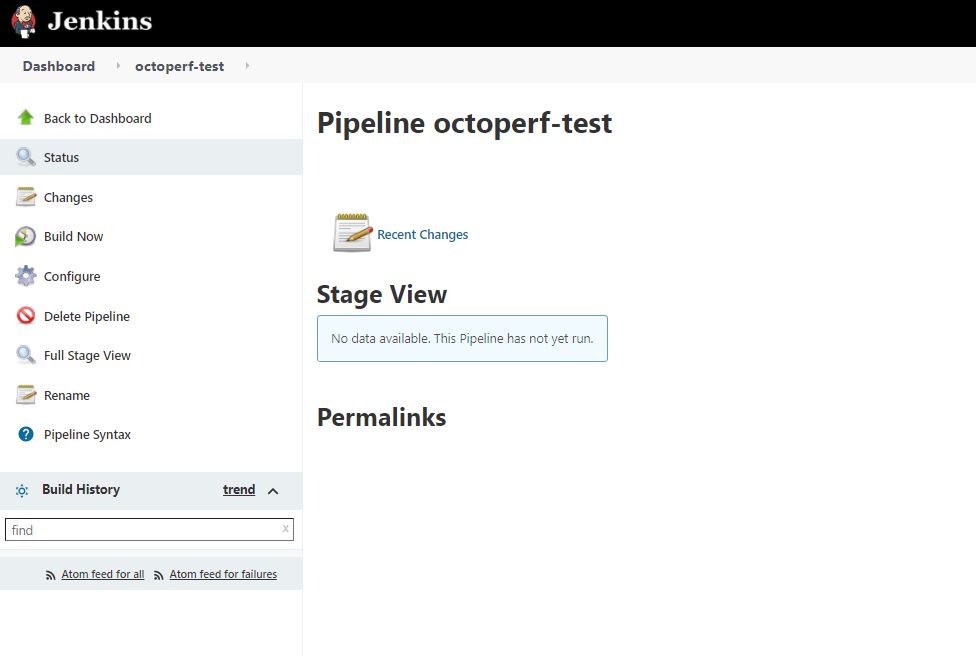
Our pipeline will run and once complete we will see an execution summary.
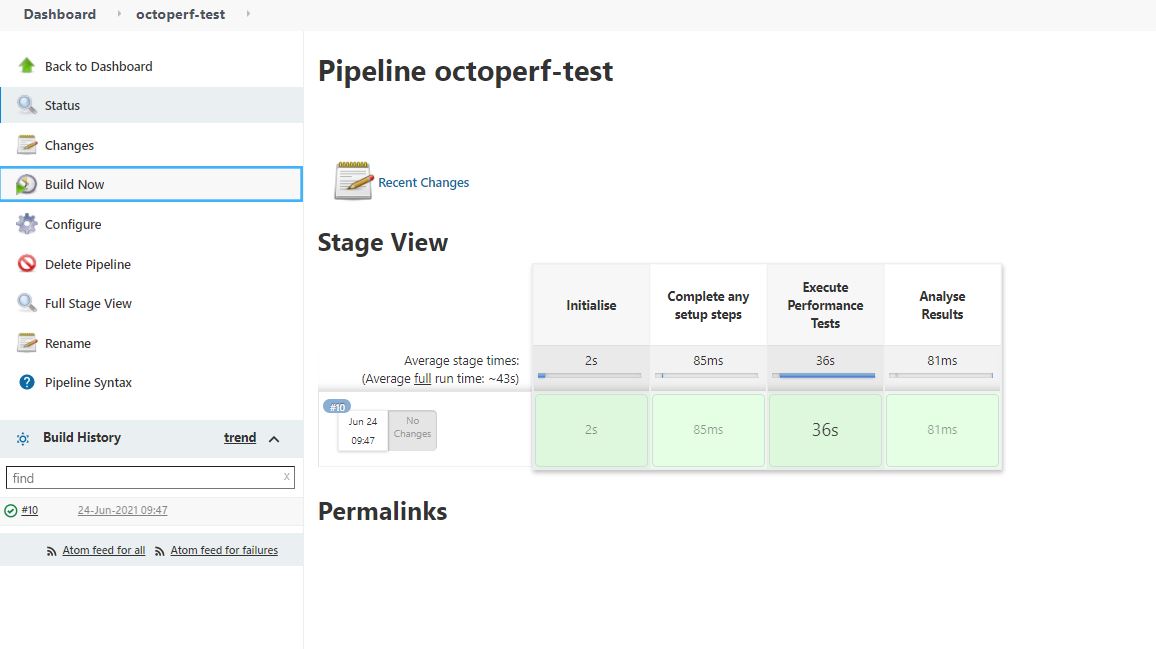
We can see the four stages we created in our pipeline groovy file.
If we select the *Tick* next to the Build under the *Build History*, we see the *Console Output*.
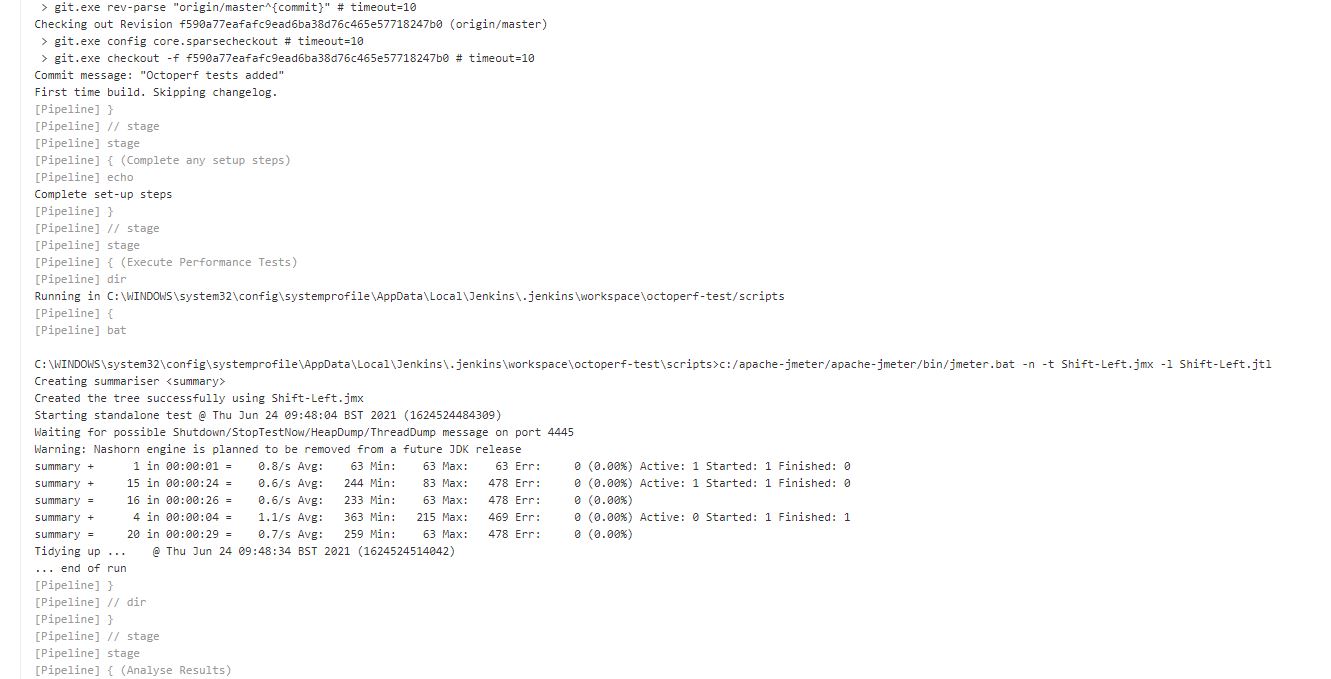
Where we can see the execution of the test.
**You have now run your first JMeter test from Jenkins by pulling your scripts from a GIT repository.**
This is a very simple example and the levels of complexity can be easily increased with a bit of additional reading online.
There are a couple of options that are worth discussing which we will do next.
## General and Build Triggers Options
We are only going to look at 2 of the options under General and Build Triggers, the rest you can easily research later.
Under the *General* setting of your pipeline there is an option called *This project is parameterised*, if you select this and click on the Add Parameter option you have a list of Parameter Types.
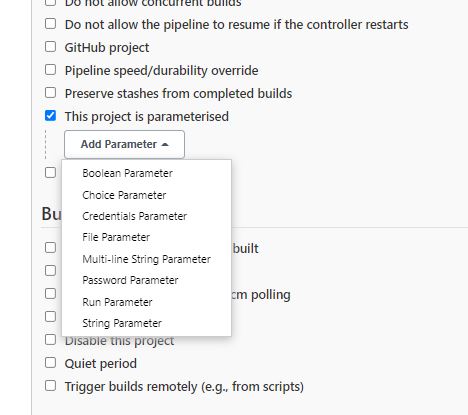
If we select *String Parameter*, we can create a String value to pass into our tests.
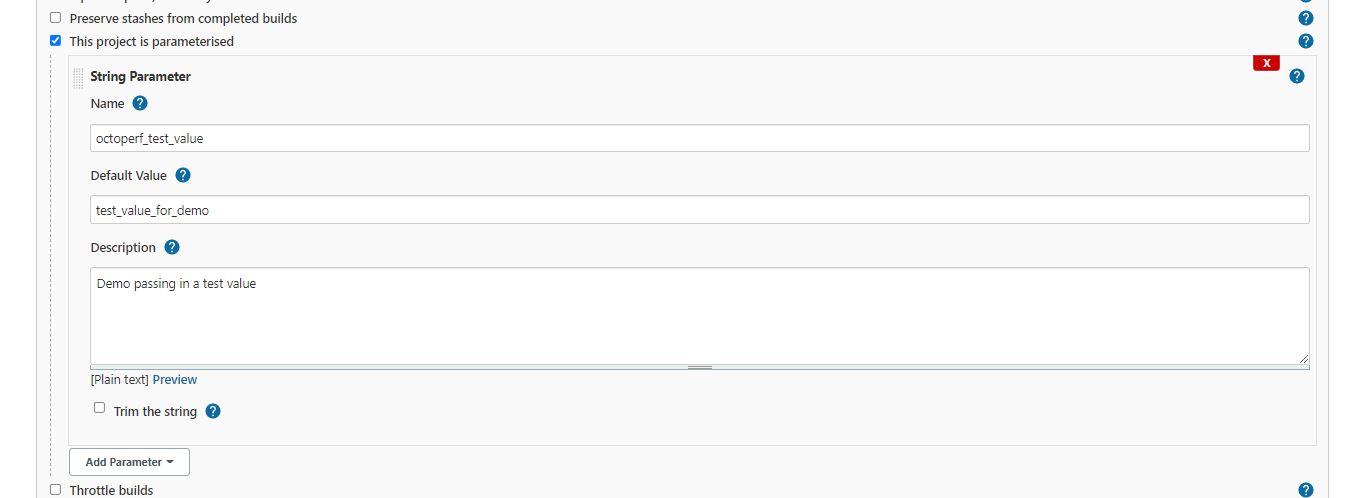
Press *Save* to add this to our pipeline.
You may be wondering what the benefits of this are for our JMeter tests, we could use this value and pass this into our JMeter test from the pipeline groovy, or use it to perform logic in our pipeline groovy file.
Let’s look at how we might do this.
If we update our pipeline groovy file we can use the parameter using ${ octoperf_test_value} so to pass this into our test we could add it to the Execute Performance Tests stage
```bat 'c:/apache-jmeter/apache-jmeter/bin/jmeter.bat -n -t Shift-Left.jmx -l Shift-Left.jtl -Joptestvalue=${octoperf_test_value}'```
We will also add this as an echo statement to the Complete any setup steps stage so we can demonstrate the value being passed in.
```
stage('Complete any setup steps') {
echo "Complete set-up steps"
echo “${octoperf_test_value}”
}
```
**Remember that any changes to your local copy of the pipeline groovy file will need to be pushed to your Bitbucket repository.**
If we re-run our pipeline you can see that the Build Now sidebar option has changed to Build with Parameters and if we select this option we are presented with a text box to add the value we want to pass, it defaults to the value we added when we created the parameter.
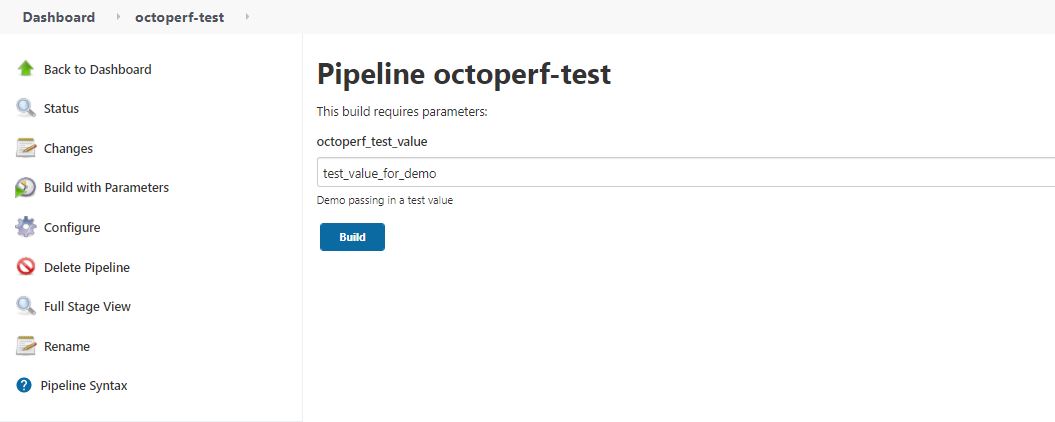
We will leave the default value and select *Build*.
Once the pipeline completes, we can look at the *Console Output* and see that the value we passed in has been used in our pipeline.
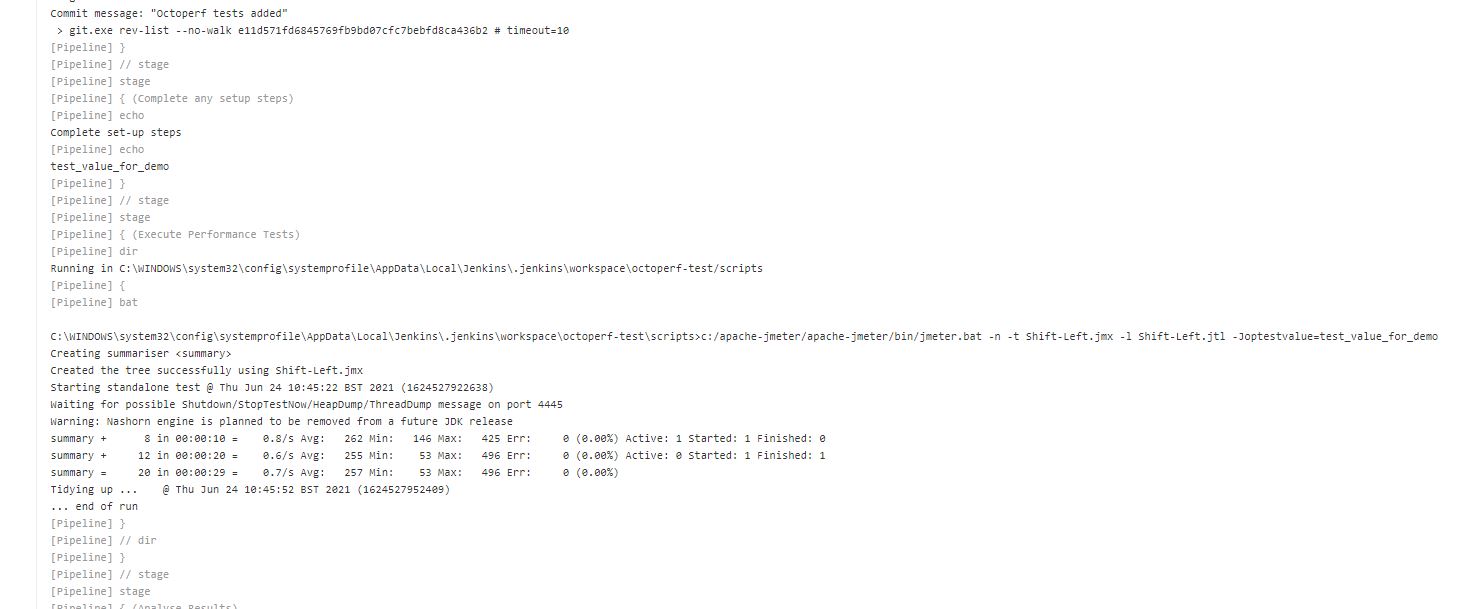
The other options we are going to look at are under the *Build Triggers* setting of you pipeline, here there are options called *Build after other projects are built* and *Build periodically*.
The first offers you the ability to run your pipeline after another completes.

You could for example run your performance test pipeline after a build pipeline or a functional test pipeline.
The second offers you the ability to schedule your pipeline to run, in continuous integration delivery you may not want to be running your performance test after every build and you may just want to run them overnight when the environment is stable and quiet.
**You can enter a CRON expression to schedule your pipeline to run.**
The fields are:
- MINUTES Minutes in one hour (0-59)
- HOURS Hours in one day (0-23)
- DAYMONTH Day in a month (1-31)
- MONTH Month in a year (1-12)
- DAYWEEK Day of the week (0-7) where 0 and 7 are Sunday
So, for example:
```
0 2 * * 1,3,5
```
Would run at 2am on Monday, Wednesday and Friday

## Conclusion
This is very simple and all running locally, in reality you will be running in a Jenkins server in the cloud or externally hosted and whilst the principles remain the same you will face challenges around access and the fact that your Jenkins instance does not have JMeter.
To get around this, there are many options that you could investigate including building your own Docker image and using that in Jenkins or you could use Apache Ant or Apache Maven to get the JMeter libraries when the pipeline is run.
OctoPerf also natively provides all you need to execute JMeter from [Jenkins](https://api.octoperf.com/doc/runtime/edit-scenario/integrations-automation/ci-cd/ci/jenkins/) or [Maven](https://api.octoperf.com/doc/runtime/edit-scenario/integrations-automation/ci-cd/maven/), the cherry on top is that you won't have to manage anything related to JMeter since OctoPerf takes care of it for you.