Browser Automation Debug with Playwright Trace Viewer
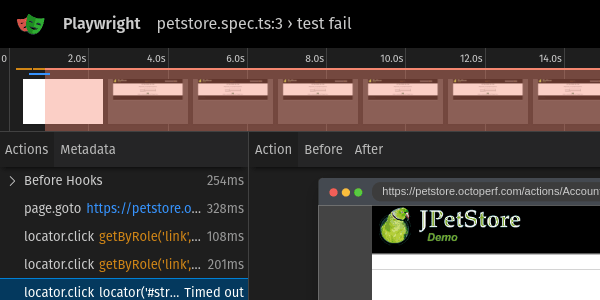
Playwright Trace Viewer is a powerful tool that allows developers and testers to gain deeper insights into the execution of browser automation scripts created with Playwright. It provides a visual representation of script execution, enabling users to diagnose issues, optimize performance, and understand the flow of actions within their automation scripts.
In this blog post, we'll explore how to use Playwright Trace Viewer effectively to enhance your browser automation projects.
Prerequisites
Before diving into Playwright Trace Viewer, ensure you have the following prerequisites in place:
- Playwright: You should have Playwright installed. Playwright Trace Viewer is included as part of the Playwright package, so you don't need to install it separately. Please refer to our previous blog post on Getting Started with Playwright to install the Playwright testing environment.
- A Playwright Automation Script: You'll need
a Playwright script that you want to analyze with the
Trace Viewer. If you don't have one, you can create the file
tests/petstore.spec.tsand use the following script for its content.
import {test, expect} from '@playwright/test';

test('test fail', async ({page}) => {
    await page.goto('https://petstore.octoperf.com/');
    await page.getByRole('link', {name: 'Enter the Store'}).click();
    await page.getByRole('link', {name: 'Sign In'}).click();
    await page.locator('#stripes--1962445802').click();
    await page.locator('#stripes--1962445802').fill('user1');
    await page.locator('input[name="password"]').click();
    await page.locator('input[name="password"]').fill('pass');
});

test('test', async ({page}) => {
    await page.goto('https://petstore.octoperf.com/');
    await page.getByRole('link', {name: 'Enter the Store'}).click();
    await page.getByRole('link', {name: 'Sign In'}).click();
    await page.locator('input[name="username"]').click();
    await page.locator('input[name="username"]').fill('user1');
    await page.locator('input[name="password"]').click();
    await page.locator('input[name="password"]').fill('pass');
    await page.getByRole('button', {name: 'Login'}).click();
    await page.locator('#SidebarContent').getByRole('link').first().click();
    await page.getByRole('link', {name: 'FI-SW-01'}).click();
    await page.getByRole('link', {name: 'EST-1'}).click();
    await page.getByRole('link', {name: 'Add to Cart'}).click();
});
Capturing a Trace
To start using Playwright Trace Viewer, you first need to capture a trace of your Playwright script's execution. Here's how:
-
Open your terminal or command prompt and navigate to the directory containing your Playwright script.
-
Run your Playwright script with tracing enabled by adding the
--trace onflag:
npx playwright test tests/petstore.spec.ts --trace on
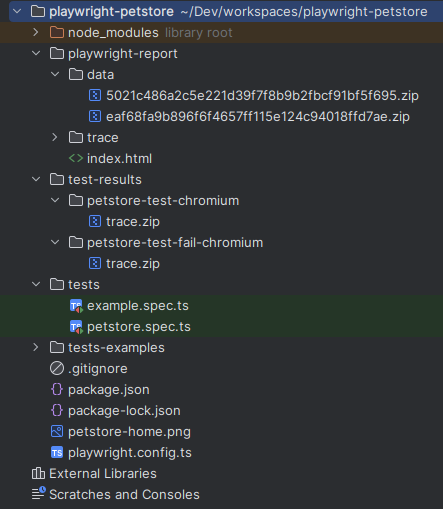
This command will execute your script and create a trace file (usually named trace.zip) in the test-results
directory for each executed test.
ubuntu@pop-os:~/Dev/workspaces/playwright-petstore$ npx playwright test tests/petstore.spec.ts --trace on

Running 2 tests using 2 workers
  1) [chromium] › petstore.spec.ts:3:5 › test fail ─────────────────────────────────────────────────

    Test timeout of 30000ms exceeded.

    Error: locator.click: Page closed
    =========================== logs ===========================
    waiting for locator('#stripes--1962445802')
    ============================================================

       5 |     await page.getByRole('link', {name: 'Enter the Store'}).click();
       6 |     await page.getByRole('link', {name: 'Sign In'}).click();
    >  7 |     await page.locator('#stripes--1962445802').click();
         |                                                ^
       8 |     await page.locator('#stripes--1962445802').fill('user1');
       9 |     await page.locator('input[name="password"]').click();
      10 |     await page.locator('input[name="password"]').fill('pass');

        at /home/ubuntu/Dev/workspaces/playwright-petstore/tests/petstore.spec.ts:7:48

    Pending operations:
      - locator.click at tests/petstore.spec.ts:7:48


    attachment #1: trace (application/zip) ─────────────────────────────────────────────────────────
    test-results/petstore-test-fail-chromium/trace.zip
    Usage:

        npx playwright show-trace test-results/petstore-test-fail-chromium/trace.zip

    ────────────────────────────────────────────────────────────────────────────────────────────────

  1 failed
    [chromium] › petstore.spec.ts:3:5 › test fail ──────────────────────────────────────────────────
  1 passed (30.7s)

  Serving HTML report at http://localhost:9323. Press Ctrl+C to quit.
The console logs invite you to execute the show-trace command in order to view a
specific trace.
The HTML report is also generated in the playwright-report folder and automatically opened
to give you access to execution results and traces:
Note: Trace settings can either be configured using the
--tracecommand line parameter or by specifying thetraceoption in theplaywright.conig.tsconfiguration file:export default defineConfig({ use: { /* Collect trace when retrying the failed test. See https://playwright.dev/docs/trace-viewer */ trace: 'on-first-retry', }, });Available values for the trace option are specified in the official documentation.
Playwright Trace Viewer Access
There are several ways to access the generated traces:
- HTML Report: the generated HTML report gives you interactive access to the Trace Viewer for each executed test.
- Command line Trace Viewer: A standalone Trace Viewer can be run using command line tools.
- OctoPerf Trace Viewer: Playwright test can be uploaded on OctoPerf to be debugged and executed in load tests.
Playwright HTML Report Trace Viewer
The HTML report is automatically opened (if you use the default playwright.config.ts value reporter: 'html')
when running your scripts.
It can also be opened with the shell command npx playwright show-report.
- Click on the trace whose trace you want to analyze:

- Scroll at the bottom of the execution logs and click on the Trace Screenshot:
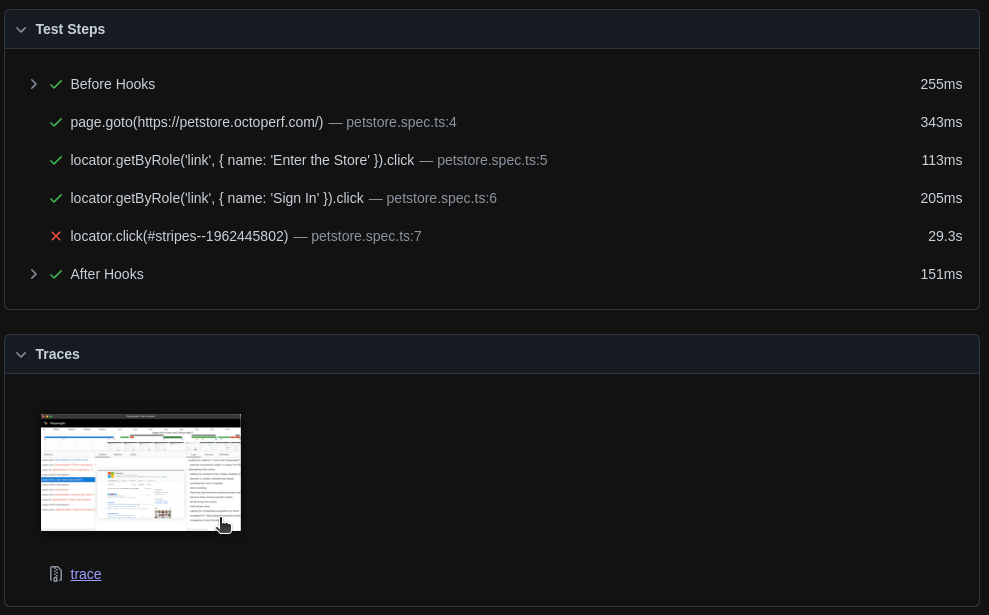
The Playwright Trace Viewer is opened in a new browser tab. Check the chapter Analyzing the Playwright trace for more information.
Launching Playwright Trace Viewer
Once you have captured a trace, you can launch Playwright Trace Viewer to analyze it:
-
In your terminal, navigate to the directory where the trace file is located (for example in
test-results/petstore-test-chromium/). -
Run the following command to open Playwright Trace Viewer:
npx playwright show-trace trace.zip
This command will open a web-based interface in your default web browser, displaying the captured trace data. Skip to the chapter Analyzing the Playwright trace to know how to use it.
Note: You can also open traces using the remote application available at trace.playwright.dev.
OctoPerf Debug
Another solution to access Playwright Trace Viewer is to import the Project in OctoPerf.
OctoPerf is a load testing platform that supports JMeter, Selenium WebDriver and Playwright.
Playwright NodeJS projects can be imported in OctoPerf to be executed both in the cloud and on-premise.
-
Connect to OctoPerf at https://api.octoperf.com/ui/ and register (or login if you already have an account).
-
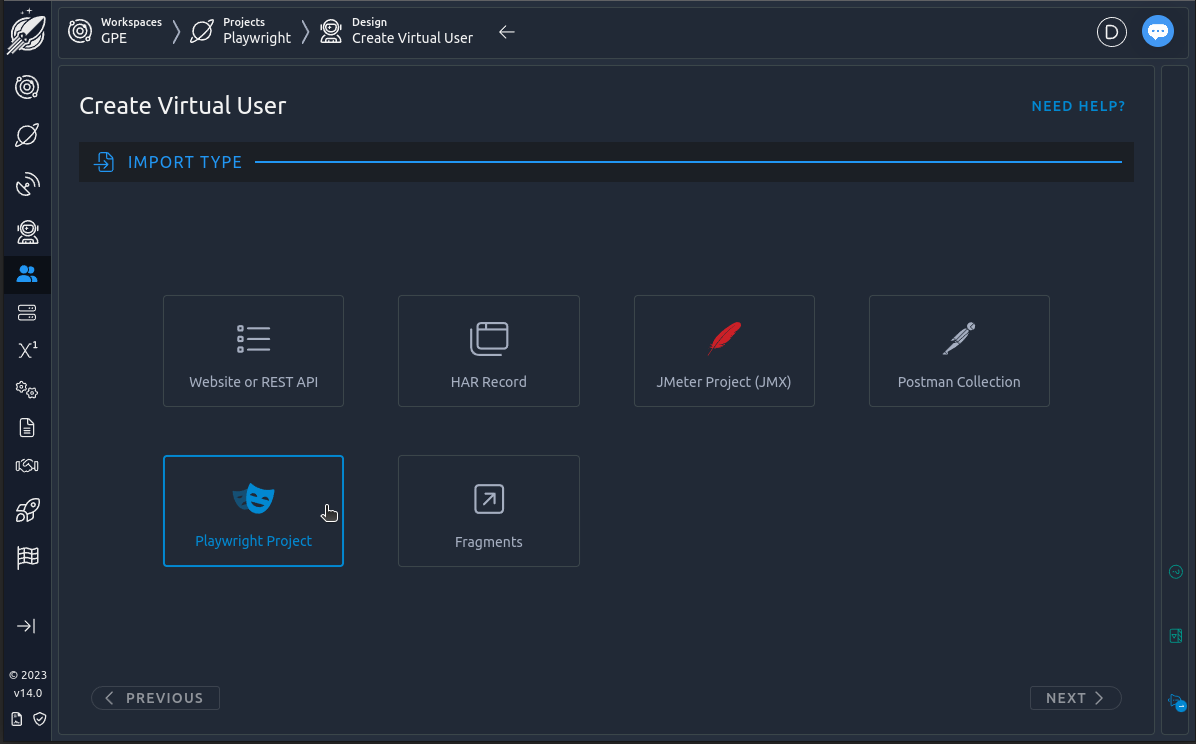
Create a Project and a new Virtual User, click on Playwright Project.
- Upload the specification file (i.e.
petstore.spec.ts) by clicking on Upload Files in the Spec Files zone.
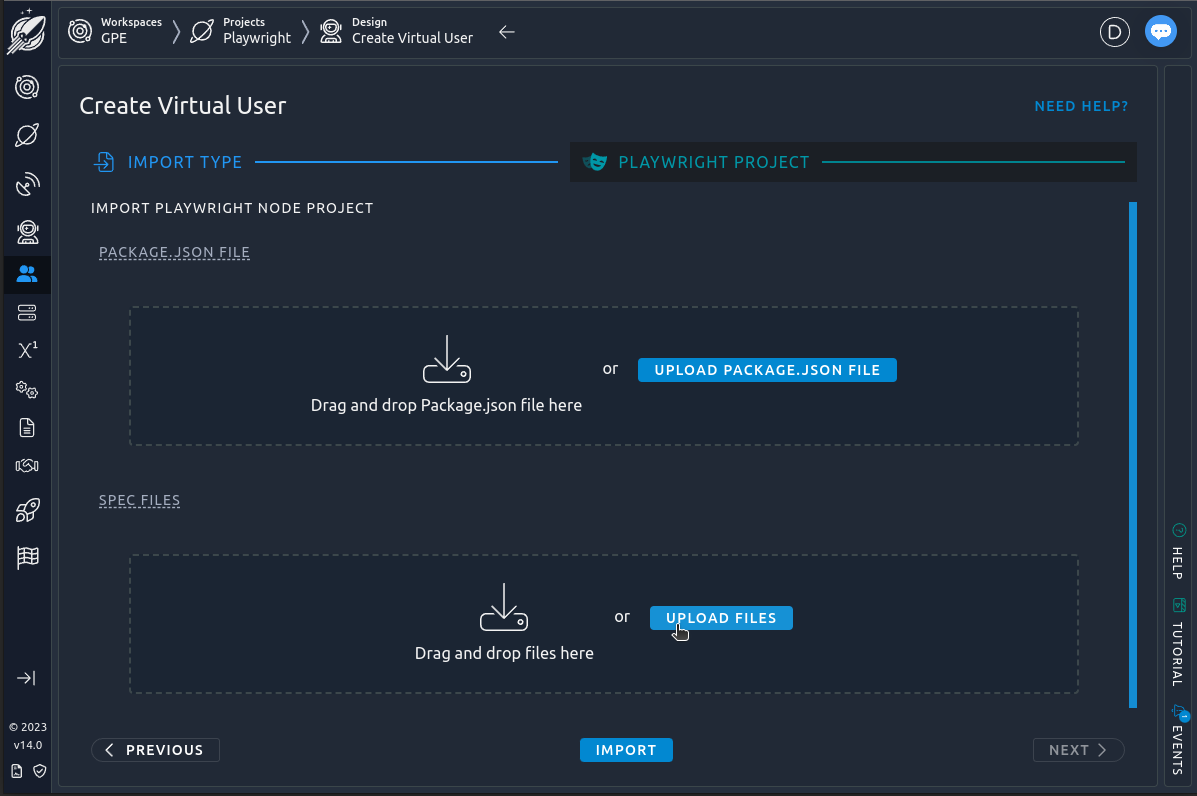
- A new Virtual User is created. Click on its name to open it.

- Open the Validation tab and click on Run Validation.
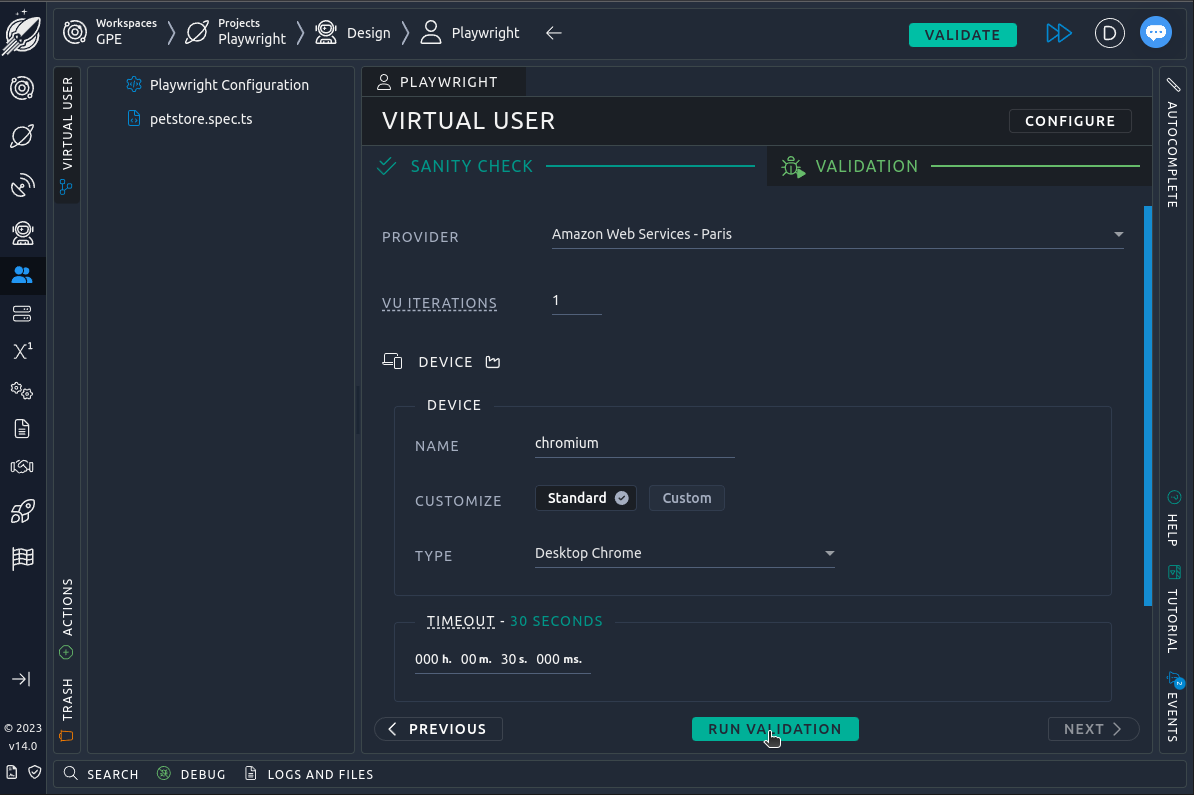
- Select the uploaded spec file in the actions tree (on the left) and open the Debug tab at the bottom.
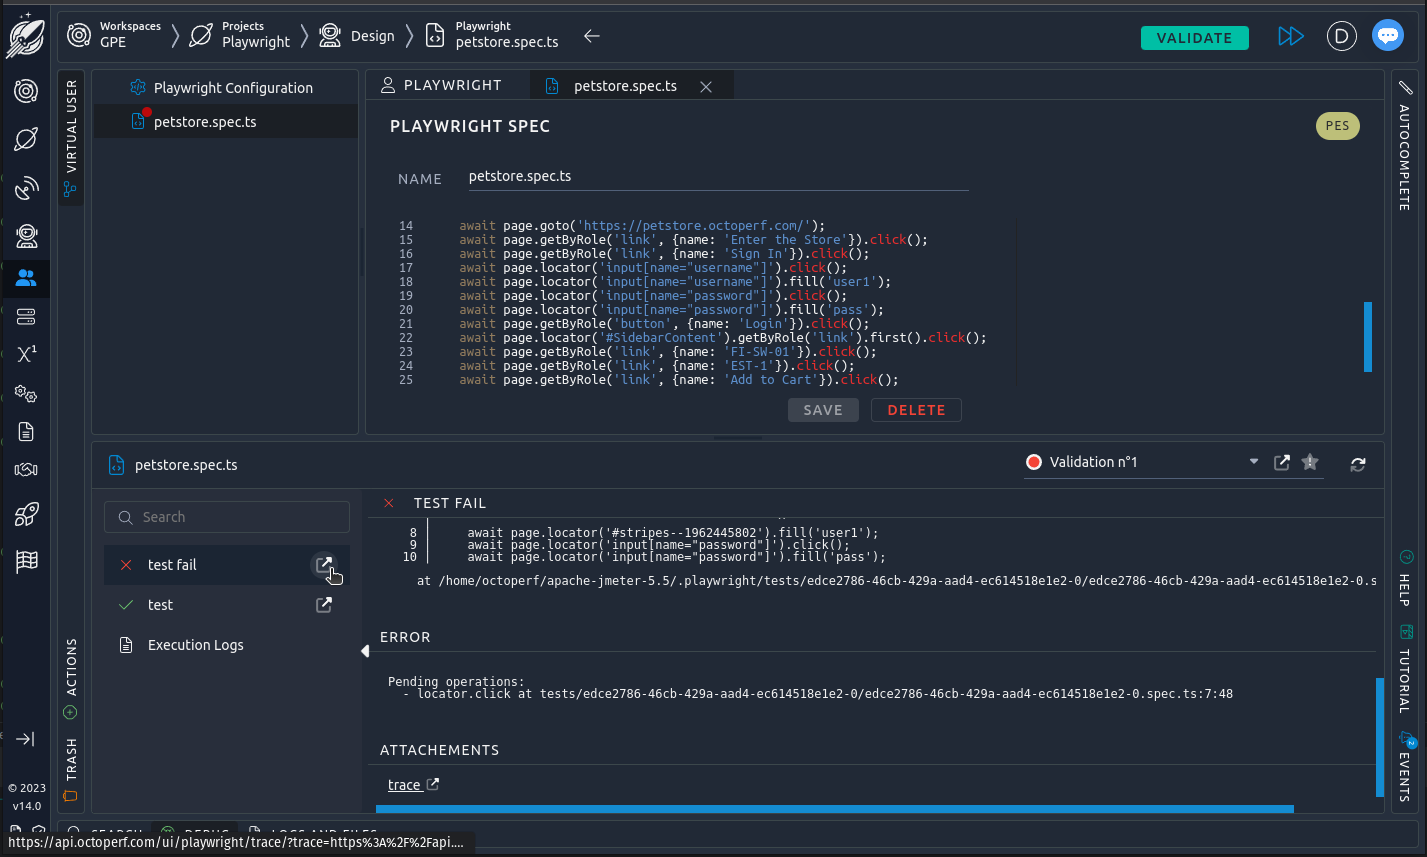
The OctoPerf debug displays the same information as the Playwright HTML report. Clicking on the attachment button opens the Playwright Trace Viewer in a new tab.
Head on to the next chapter to know more about it!
Analyzing the Trace
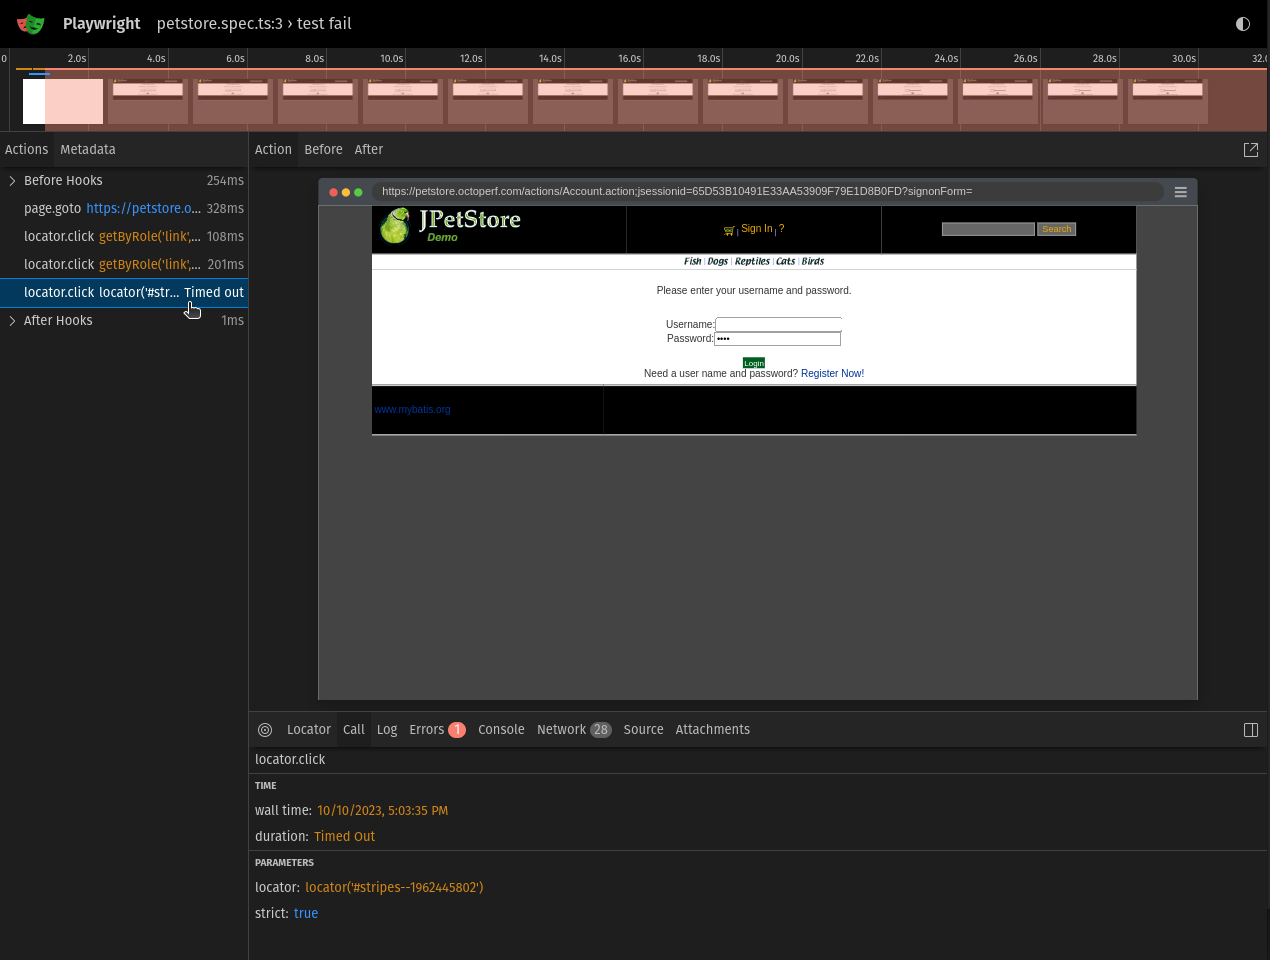
Playwright Trace Viewer provides various features and tools to help you analyze the trace data effectively:
-
Timeline Overview: The timeline overview at the top of the page provides an overview of the entire trace. You can zoom in and out to focus on specific sections of the trace.
-
Interaction Timings: Playwright Trace Viewer visualizes the timing of user interactions and browser events ( Actions), making it easy to understand the sequence of actions.
-
Event Details: Click on specific events in the trace to view detailed information about them (Call), including timestamps, event types, and associated data.
More information about Playwright Trace viewer can be found in the official documentation.
Conclusion
Playwright Trace Viewer is a valuable tool for gaining insights into the execution of your Playwright browser automation scripts.
Whether you're debugging issues, optimizing performance, or simply understanding the flow of actions, this tool provides a visual and data-rich representation of your automation process.
Incorporating Playwright Trace Viewer into your testing and development workflow will help you create more robust and efficient automation scripts.
