
Continuous Delivery Test Reporting
We have spoken in a previous blog post about documentation about how we believe that if you are building performance tests that support either Continuous Integration or Continuous Delivery then having to produce performance testing documentation before and after each test does not fit with this methodology.
This got us to thinking that if we truly want to use an agile framework and continually push code to production then we need to also consider how we monitor and report on our performance test results produced from our testing tools.
If you have an agile testing process, then you will have functional tests built into this deployment process that run in each environment and if you have a mature robust process then this process deploys to production with no manual intervention if all the functional tests have passed along with any deployment checks.
Now in reality we need to have a performance testing stage in this process as well as each release needs to go through a performance test, whether that is a full suite of peak volume, soak test, scalability tests scenarios or whether that is a regression tests of core functionality.
And this is the bit that we are going to discuss in this blog post because if your organisation wants to push code directly to production then you do not have the luxury of running your performance test, analysing the results and writing up a report to be signed off.
Standard testing process
Let’s just briefly discuss what many organisations do, and to be clear this is not a criticism; many organisations have a dedicated performance testing phase and test in a fashion that would not be considered a Continuous Integration or Continuous Delivery way.
This can still be considered agile in the way the work is allocated and development takes place but reverts to a more standard approach to testing.
This means that progression of code to production is halted for the testing to take place. This blog post is focussed on how we can build performance tests to support the automation of builds to production. It does not focus on how functional tests can support this although there are many good articles on the subject.
Building a solution for your performance testing that is fully automated and self-checking also removes the need for performance sign off reports which is where we started with this blog post.
Concepts of Never Green
There are various names for this principle in Information Technology and the wider corporate world but basically what we are talking about is do we really need to report on and present data if the results are good and meet non-functional requirements you may have.
Surely, we are only interested in performance test results if there is an issues or response time fail your requirements.
There is a blog post on how to define your non-functional requirements that you might find useful as for you to feel confident in approaching your testing this way you need to have a robust set of requirements against which to measure against.
We are going to consider in this post how we might go about building a JMeter test that only throws an error should a performance requirement be missed by your tests and while this is a simple example it will hopefully give you the ambition to look at other ways you can self-check tests using JMeter during execution to determine the performance of your application.
In order for your performance tests to be executed in a fashion that supports Continuous Integration or Continuous Delivery they need to be executed using a pipeline technology and there is a example of how this can be done here.
Building tests and reporting on failure
Let’s consider a very simple test using several Dummy Samplers. We will set each dummy sampler up to respond within a different time range:
| Sampler Name | Sampler Response Time |
|---|---|
| Sampler A | 100 – 200 |
| Sampler B | 200 – 500 |
| Sampler C | 500 – 1000 |
| Sampler D | 1000 – 1500 |
| Sampler E | 1500 – 5000 |
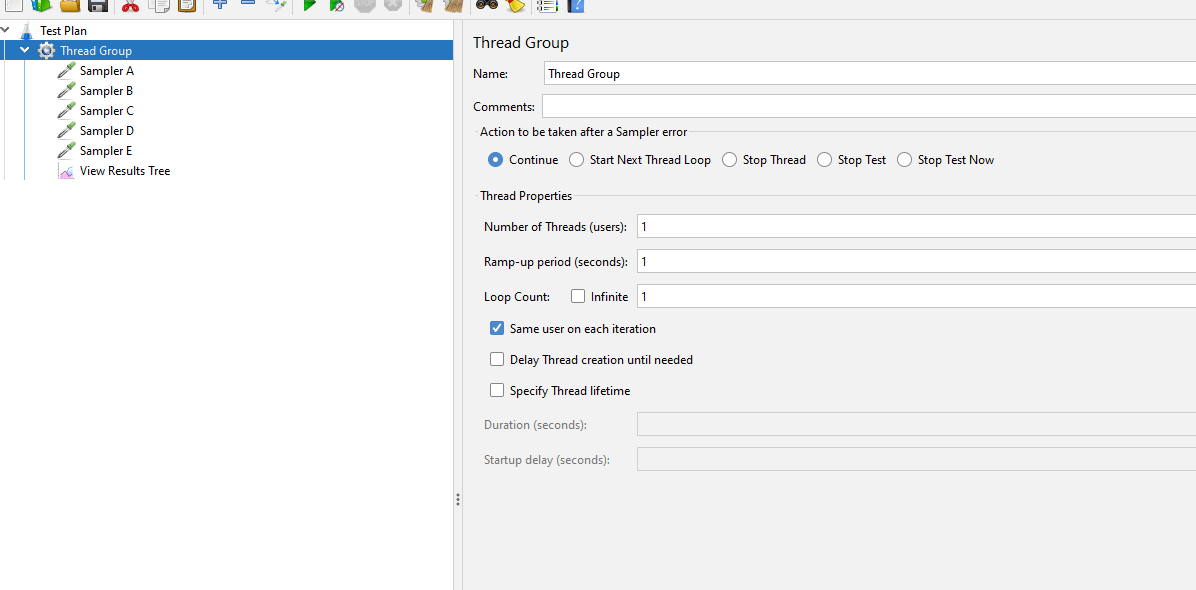
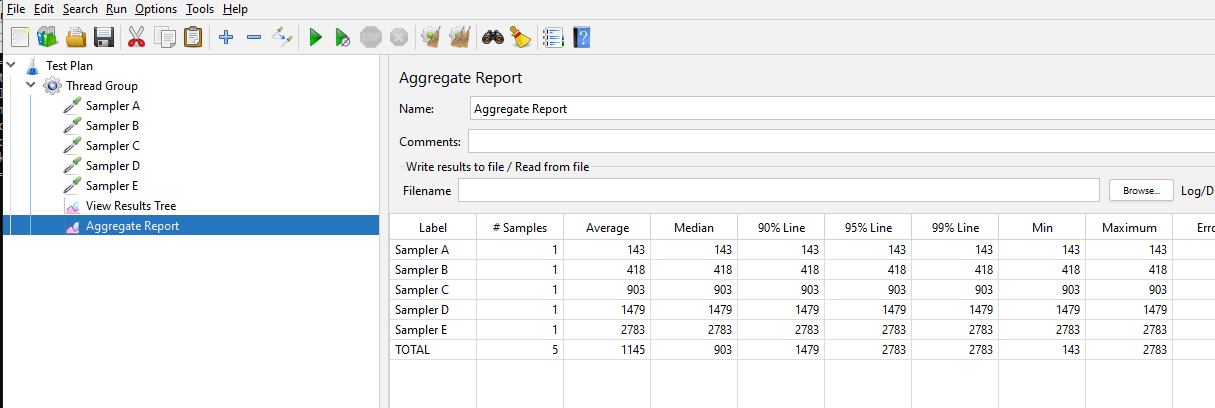
If we run this test, we get a range of sampler response times:
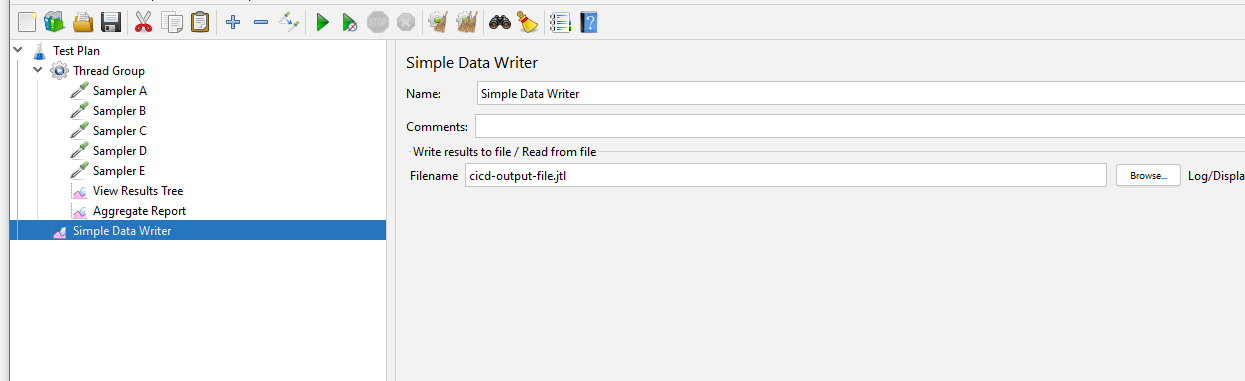
Let’s extend this test a bit further and add a Simple Data Writer to output the response time data to.
This will create a .jtl file which contains the response times of the samplers in our tests, if you are running your performance tests from the command line you would use the -l flag to output your results to a file.
When running a performance test for which you want to extract performance test results then this is the approach you will take as from this file you can produce graphs and reports using any custom reporting tools you have or using the JMeter Report Dashboard which is a very powerful way of outputting your results after a test.
To understand how the JMeter Report dashboard works here is a link to the tutorial.
Here is our test with the Simple Data Writer:
Let’s run our test now and look at the output file that gets produced:
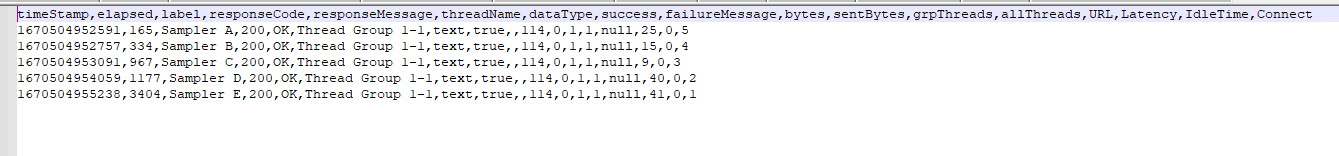
We can see that our output is now in an output file.
So, this is all simple so far so let’s increase the volumes and generate a report, once we have done this, we can start to look at how we might adjust this to suit test execution in a continuous delivery way.
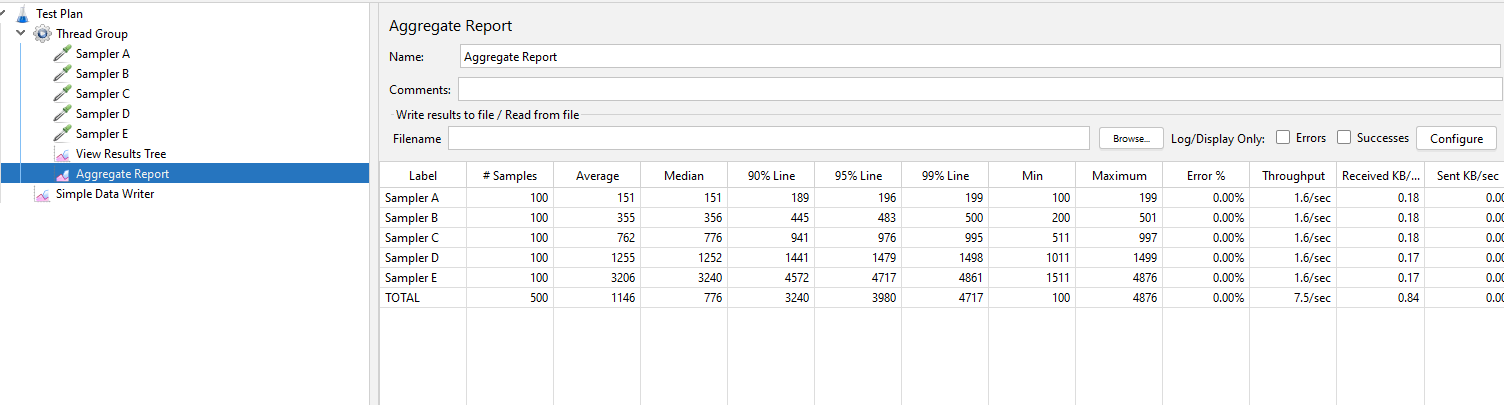
We have used 10 threads with 10 iterations each giving us 100 timing points for each Dummy Sampler.
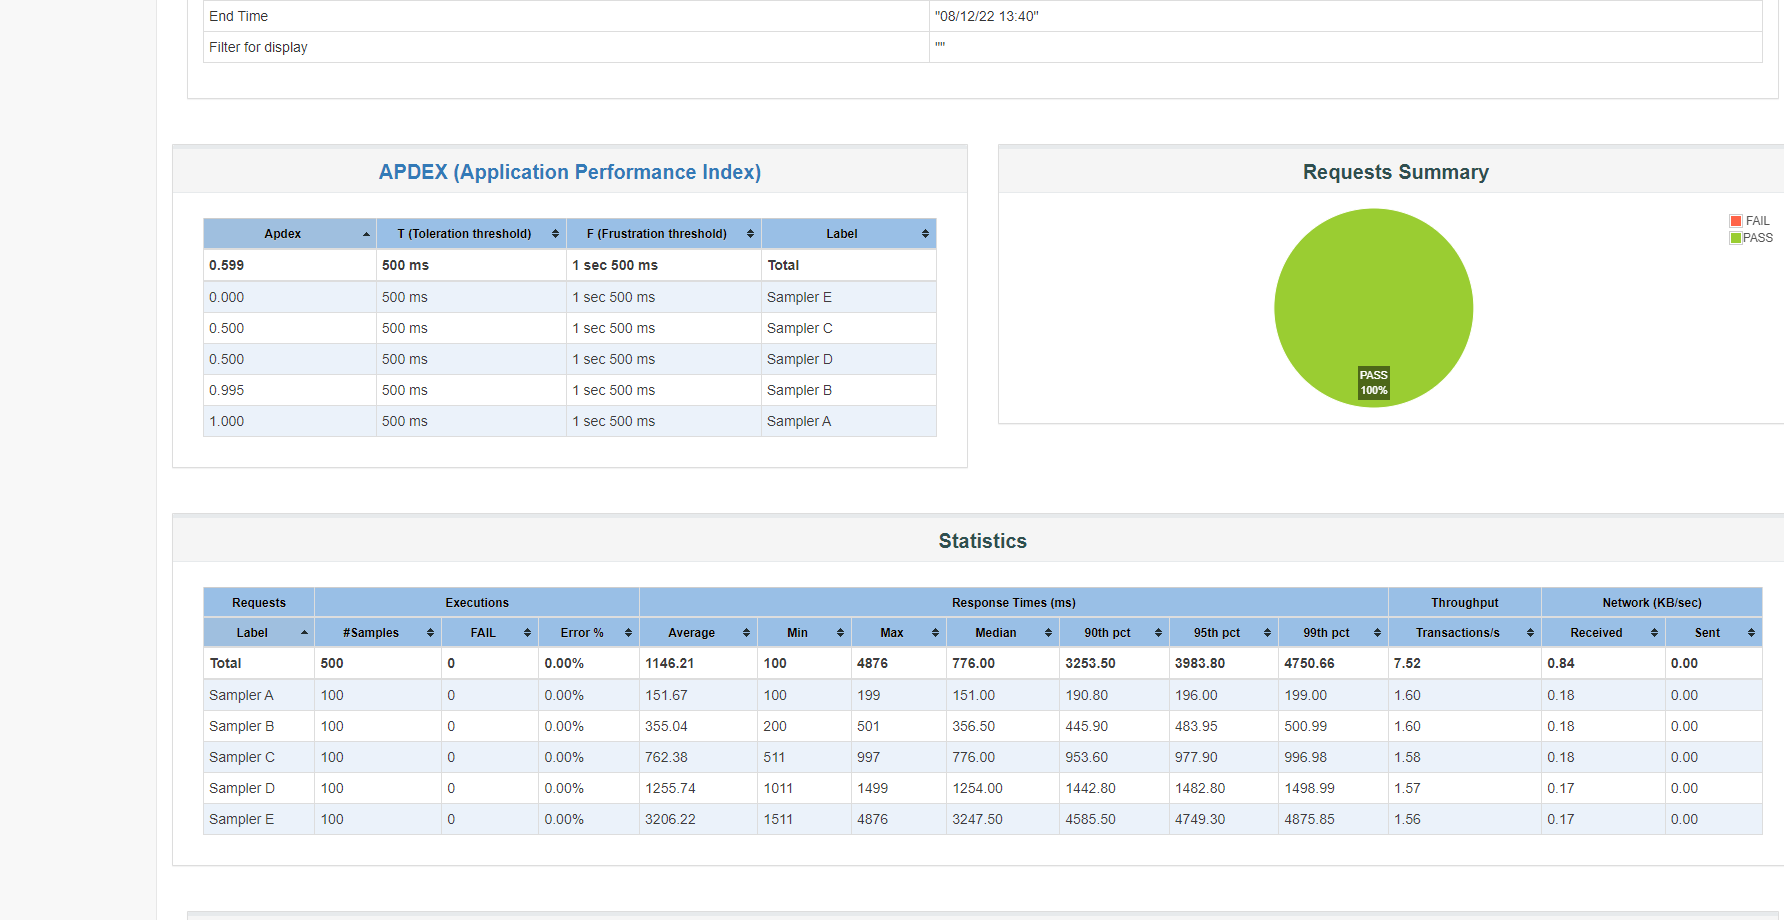
The HTML report gives us a nice report based on our tests.
So, this is good, but it does not solve our problem of how we build tests that allows the deployment of code into production if they pass and stop if they fail. There are many ways to do this, and we will look at a few but hopefully these examples will encourage you to consider how you can use this in your organisation.
The bigger picture
Before we continue, we need to just discuss how we would achieve our goal of stopping a pipeline should performance be an issue with a build and the example we will use is the JMeter performance plugin for Jenkins pipelines.
If you don’t use Jenkins in your organisation, then you will need to discuss with you sysadmin team how you incorporate JMeter testing into your pipeline technology and while this is outside the scope of this post the techniques we will look at in the next section are still applicable.
Basically, using the JMeter plugin for Jenkins you can configure it to set the pipeline that is running to failed based on the error percentage meaning that you can, upon failure, halt any pipeline.
If you then have a performance test stage in your deployment pipelines and you experience failure, then the pipeline will fail at the performance test stage and not complete its promotion to production.
Now, the issues we are going to look at next is how we can force a JMeter test to fail based on a set of performance criteria which in turn will cause your pipeline to fail.
Updating our test
Let’s look at a few techniques to force our tests to fail based on performance criteria, as we have already mentioned these are some simple examples that you can build on should you wish to.
We will reset out thread and iteration count back to 1 for the purposes of explaining these examples. The first thing we are going to look at is adding a simple JSR223 Assertion:
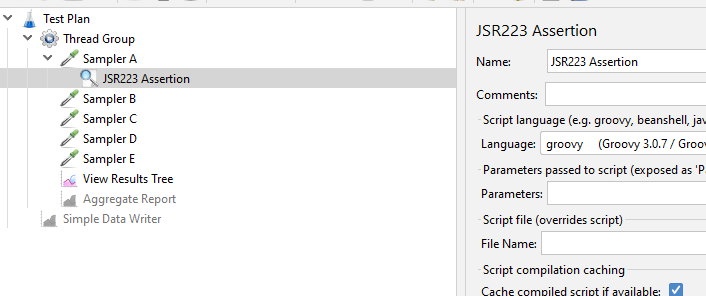
This is what it looks like:
if(prev.getTime() > 90){
    AssertionResult.setFailure(true);
    AssertionResult.setFailureMessage("Response time failed Non-Functional requirement");
}
So, this is a very simple example where if the response time of the previous sampler is greater than 90 milliseconds then fail the sampler.
As the Dummy sampler is set to return a response time between 100 and 200 milliseconds this is always going to be fail.
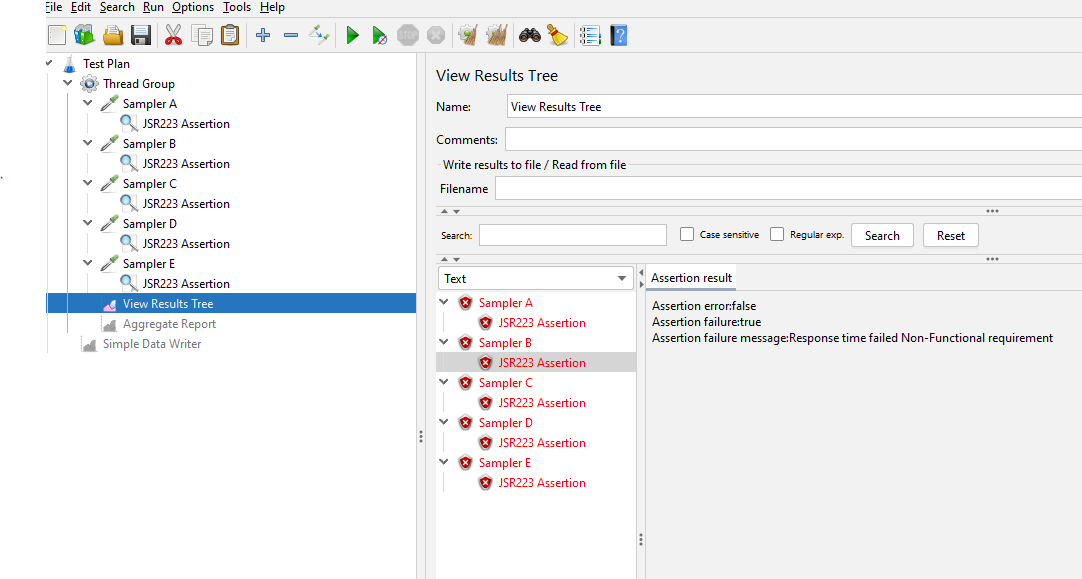
Let’s run our test again.
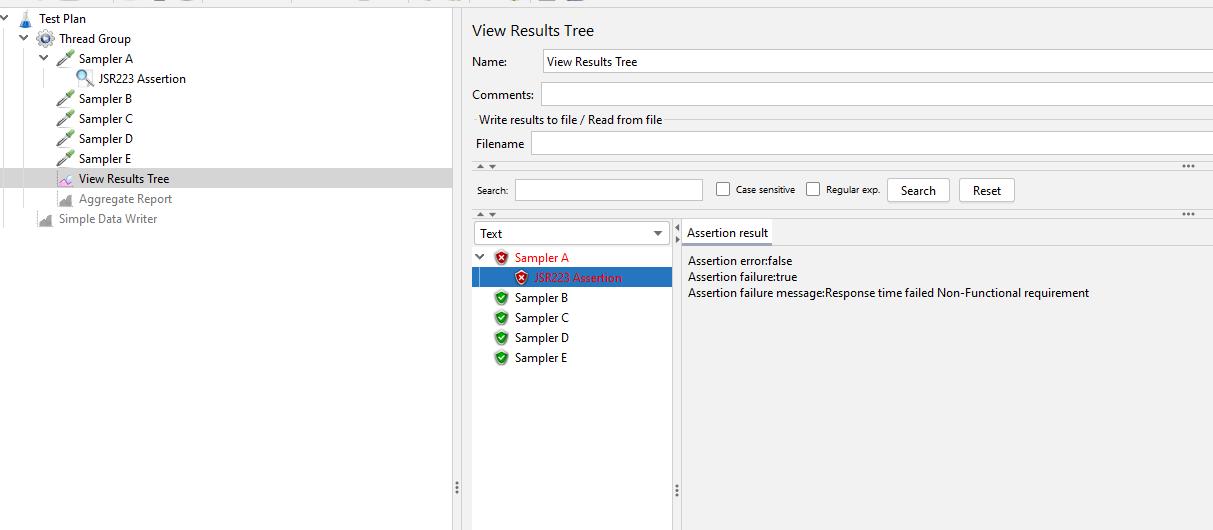
We can see that we have added an Assertion for which we defined the failure conditions and therefore this allows us to check our test as it executes meaning that in conjunction with our pipeline, we are able to determine if the release performs and if it does not we fail the pipeline and the deployment to production.
You can see that we have used prev in our Assertion, this is shorthand for SamplerResult and there are a significant number of things you can check for, or set, the documentation for this can be found here.
Let’s update the tests with some more checks and change hardcoded values to use properties which we can define outside of the test itself. We will change our JSR223 Assertion to be this:
Integer samplerAResponseTime = Integer.parseInt(props.get("samplerAResponse"));

if(prev.getTime() > samplerAResponseTime){
    AssertionResult.setFailure(true);
    AssertionResult.setFailureMessage("Response time failed Non-Functional requirement");
}
And we will replicate this across all the Samplers in our test.
Let’s now start our test from the command line in GUI mode so we can pass in values for all the properties we have set.
This is what our command line looks like:
.\jmeter.bat -t .\continuous-delivery-test-reporting.jmx -JsamplerAResponse=10 -JsamplerBResponse=10 -JsamplerCResponse=10 -JsamplerDResponse=10 -JsamplerEResponse=10
Where we are passing in our test and assigning a response time of 10 milliseconds for each sampler.
Now we know, based on the table earlier in this post, that all the samplers take longer than 10 seconds to complete as the quickest is between 100 and 200 therefore they will all fail.
If we run our test:
Now we are going to have more than one iteration in our real tests, and do we want the tests to fail if one sampler exceeds its expected response time, probably not.
We need to therefore use some more logic in our tests to aggregate the results once completed and assign a status then.
This is a more complex example and one that may give you confidence to experiment with using your tests.
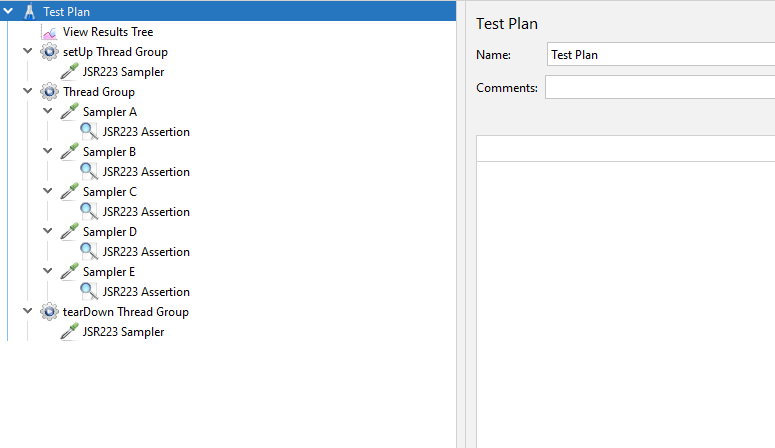
We have:
- Added a setUpThreadGroup,
- Set the ThreadGroup values that control the number of iterations to be parameters,
- Changed the Assertion logic,
- Added a tearDownThreadGroup to calculate whether the test is successful or not.
Let’s look at these and then look at running our test and how the values we pass in affect the outcome.
In the setUpThreadGroup we have a single JSR223 Sampler that sets a property to count errors.
// Set up a count property
props.put("errorCount", "0");
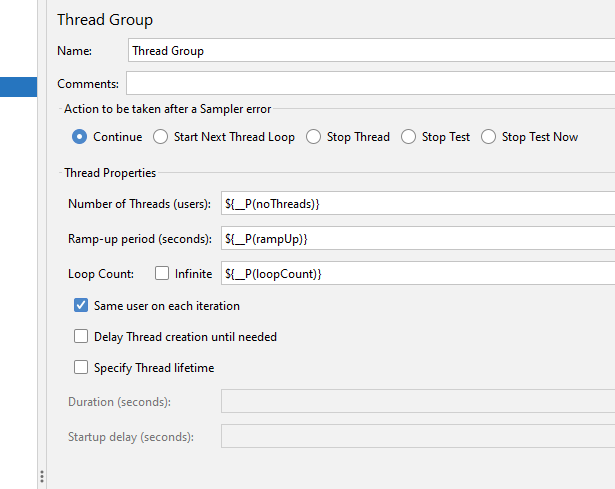
The ThreadGroup now has these properties to control the load profile:
The Assertion logic has changed to now be:
Integer samplerAResponseTime = Integer.parseInt(props.get("samplerAResponse"));
Integer currentErrorCount = Integer.parseInt(props.get("errorCount"));

if(prev.getTime() > samplerAResponseTime){
    currentErrorCount ++;
    props.put("errorCount",currentErrorCount.toString())
}
Where we still check to see if we have met our expected response time but if we do not, we increment the errorCount property rather than fail the sampler.
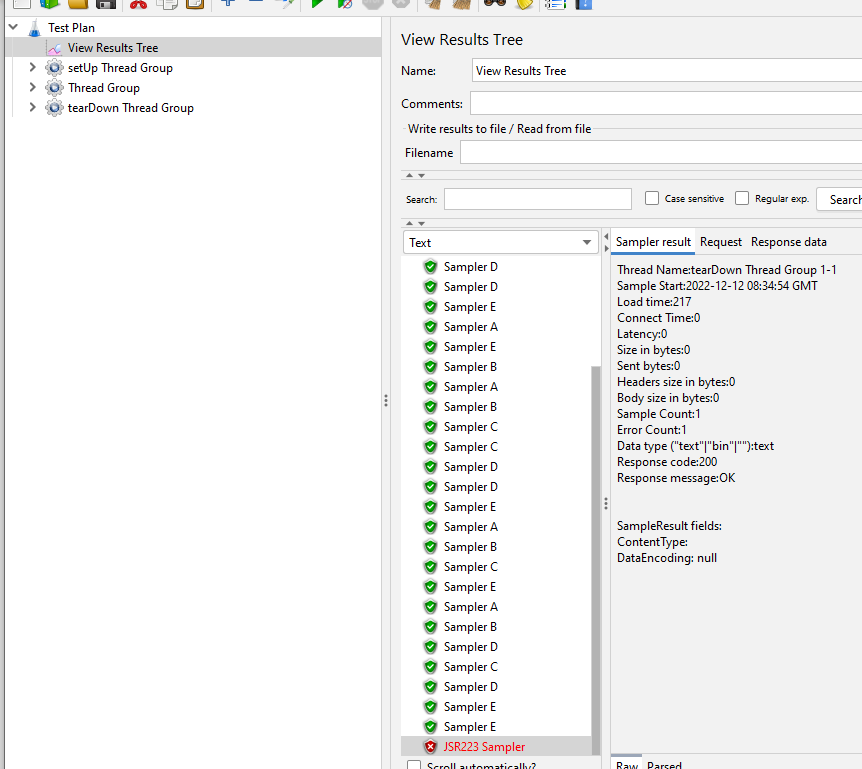
Finally, we provide a bit of logic into the tearDownThreadGroup to determine if we think the test has passed or failed.
// Return properties as integers so we can do some maths using them
Integer errorCount = Integer.parseInt(props.get("errorCount"));
Integer noThreads = Integer.parseInt(props.get("noThreads"));
Integer loopCount = Integer.parseInt(props.get("loopCount"));
Integer acceptablePercentageFailure = Integer.parseInt(props.get("acceptablePercentageFailure"));

// Write to the log for demonstration purposes
log.info("----------------------------------------------------------------");
log.info("Error Count = " + errorCount.toString());
log.info("No Threads = " + noThreads.toString());
log.info("Loop Count = " + loopCount.toString());
log.info("Acceptable Percentage Failure = " + acceptablePercentageFailure.toString());
log.info("----------------------------------------------------------------");


/*------------------------------------------------------------------*/
// Get the unique sampler count using the test engine
def engine = engine = ctx.getEngine()
def testPlan = engine.test

def samplerSearch = new org.apache.jorphan.collections.SearchByClass<>(kg.apc.jmeter.samplers.DummySampler.class)
testPlan.traverse(samplerSearch)
samples = samplerSearch.getSearchResults()
samplerCount = samples.size();


// Write to the log for demonstration purposes
log.info("----------------------------------------------------------------");
log.info("Sampler Count = " + samplerCount.toString());
log.info("----------------------------------------------------------------");

/*------------------------------------------------------------------*/

if(errorCount > 0) {
    // Some response times exceeded their expected response time
    // We work out the sampler count which is a combination of no of samplers (which we calculated above)
    // Multiplied by the no of threads which we pass in as a property
    // Multiplied by the number of iterations which again we pass in as a property
    Integer totalSamplersExecuted = noThreads * loopCount * samplerCount

    // Write to the log for demonstration purposes
    log.info("----------------------------------------------------------------");
    log.info("Total Samplers Executed = " + totalSamplersExecuted.toString());
    Integer percentageFailure = (errorCount / totalSamplersExecuted) * 100;
    log.info("Percentage Failed = " + percentageFailure.toString());
    log.info("----------------------------------------------------------------");

    if((errorCount / totalSamplersExecuted) * 100 > acceptablePercentageFailure) {
        SampleResult.setSuccessful(false);
    }
    else {
        SampleResult.setSuccessful(true);
    }
}
else {
    // No errors, all response times were less than their expected response time
    SampleResult.setSuccessful(true);
}
Let’s look at what we are doing here.
Firstly we are going to write some of the input properties to variables, we are also outputting to the log so we can track this when we run the test shortly.
// Return properties as integers so we can do some maths using them
Integer errorCount = Integer.parseInt(props.get("errorCount"));
Integer noThreads = Integer.parseInt(props.get("noThreads"));
Integer loopCount = Integer.parseInt(props.get("loopCount"));
Integer acceptablePercentageFailure = Integer.parseInt(props.get("acceptablePercentageFailure"));

// Write to the log for demonstration purposes
log.info("----------------------------------------------------------------");
log.info("Error Count = " + errorCount.toString());
log.info("No Threads = " + noThreads.toString());
log.info("Loop Count = " + loopCount.toString());
log.info("Acceptable Percentage Failure = " + acceptablePercentageFailure.toString());
log.info("----------------------------------------------------------------");
Notice how we are adding an acceptable percentage value as a property which we will pass into the test, how this will be used will be explained shortly.
Next, we are using the ctx variable to get access to the JMeter engine where we are counting the samplers, this could have been hardcoded but we wanted to show you how powerful the ctx variable is, you can read more about it here.
/*------------------------------------------------------------------*/
// Get the unique sampler count using the test engine
def engine = engine = ctx.getEngine()
def testPlan = engine.test

def samplerSearch = new org.apache.jorphan.collections.SearchByClass<>(kg.apc.jmeter.samplers.DummySampler.class)
testPlan.traverse(samplerSearch)
samples = samplerSearch.getSearchResults()
samplerCount = samples.size();


// Write to the log for demonstration purposes
log.info("----------------------------------------------------------------");
log.info("Sampler Count = " + samplerCount.toString());
log.info("----------------------------------------------------------------");

/*------------------------------------------------------------------*/
Finally, we are going to determine whether we think the test passes or failed based on the criteria we have supplied.
All we are doing is simply multiplying the noThreads and the loopCount and samplerCount variable to get the number of executed samplers we then calculate a percentage of errors from the errorCount variable and if this exceeds our acceptable failure value the tests fails, otherwise it passes.
if(errorCount > 0) {
    // Some response times exceeded their expected response time
    // We work out the sampler count which is a combination of no of samplers (which we calculated above)
    // Multiplied by the no of threads which we pass in as a property
    // Multiplied by the number of iterations which again we pass in as a property
    Integer totalSamplersExecuted = noThreads * loopCount * samplerCount

    // Write to the log for demonstration purposes
    log.info("----------------------------------------------------------------");
    log.info("Total Samplers Executed = " + totalSamplersExecuted.toString());
    Integer percentageFailure = (errorCount / totalSamplersExecuted) * 100;
    log.info("Percentage Failed = " + percentageFailure.toString());
    log.info("----------------------------------------------------------------");

    if((errorCount / totalSamplersExecuted) * 100 > acceptablePercentageFailure) {
        SampleResult.setSuccessful(false);
    }
    else {
        SampleResult.setSuccessful(true);
    }
}
else {
    // No errors, all response times were less than their expected response time
    SampleResult.setSuccessful(true);
}
We are going to run this with some different values to see the outcomes.
Let’s consider this set of values:
.\jmeter.bat -t .\continuous-delivery-test-reporting.jmx -JsamplerAResponse=10000 -JsamplerBResponse=10000 -JsamplerCResponse=10000 -JsamplerDResponse=10000 -JsamplerEResponse=10000 -JnoThreads=2 -JrampUp=2 -JloopCount=3
-JacceptablePercentageFailure=10
We are saying that each samplers must respond in 10 seconds, we are going to use 2 threads ramping up over 2 seconds and have 3 iterations and we have an error threshold of 10%.
Now we know that each of our Dummy samplers takes less that 10 seconds to complete as we have built the test this way, so we are expecting a pass.
Let’s run this test:
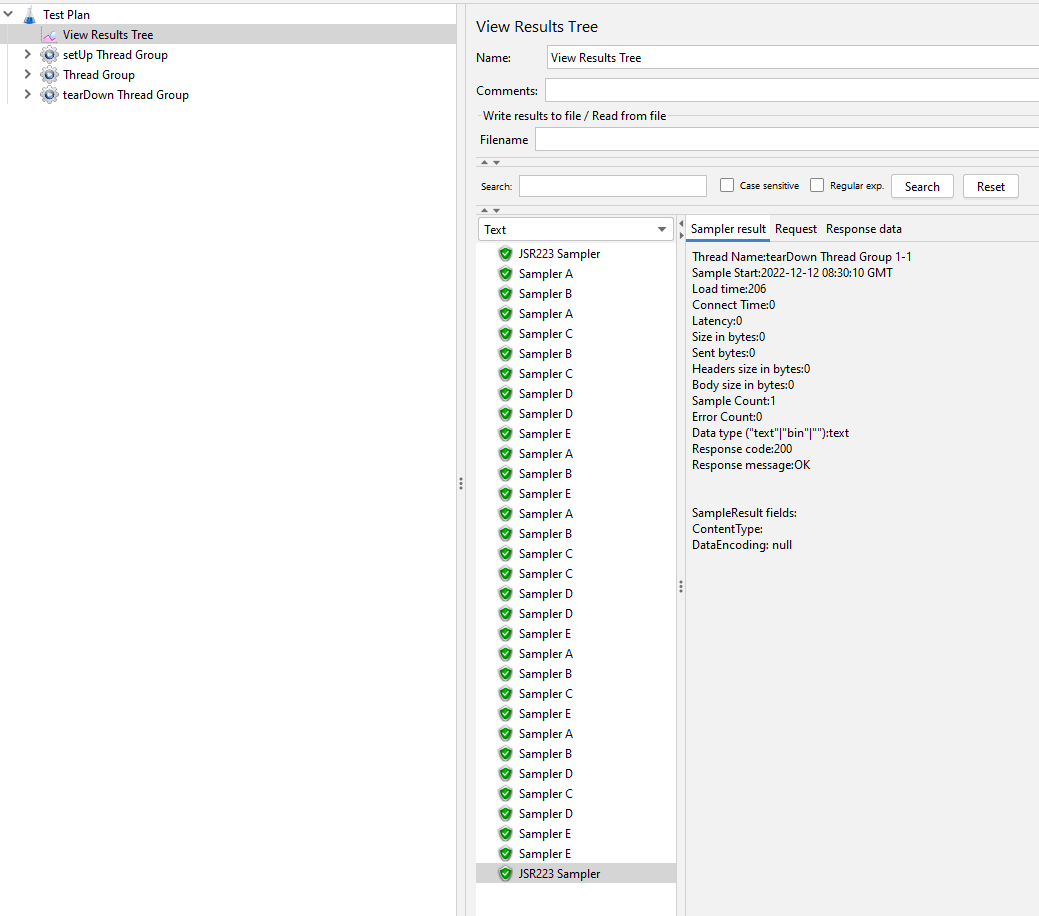
As we can see the test has passed.
Let’s now run this with different values.
.\jmeter.bat -t .\continuous-delivery-test-reporting.jmx -JsamplerAResponse=10 -JsamplerBResponse=10 -JsamplerCResponse=10 -JsamplerDResponse=10 -JsamplerEResponse=10 -JnoThreads=2 -JrampUp=2 -JloopCount=3
-JacceptablePercentageFailure=10
We now set the acceptable response time value to 10 milliseconds, and we know that the quickest Dummy Sampler takes between 100 and 200 milliseconds we will therefore expect the test to fail.
Let’s tun this test:
And we can see that the test has failed.
You can play around with response times and acceptable percentage values if you wish but what we have tried to show you is that it can be extremely useful for you to get your tests to determine whether performance is acceptable rather than you analysing lots and lots of performance data in a manual way.
Conclusion
Now clearly in order to for this to be useful in your organisation you need to be able to fail a pipeline from a JMeter test and this may not be possible or even acceptable.
But regardless of how you run your performance testing it is worth considering using some of the techniques we have discussed to allow your tests to determine whether they have passed or failed based on your input criteria. This can save time when analysing tests and provide some insights as to where the performance problems with your application are.
The example test plan used in this blog post can be found here.