D3.js Tutorial: Mouse Events Handling
This tutorial explains how to handle mouse events using D3.js along with other useful notions:
- SVG shapes definitions and use,
- D3 animations and transitions,
- D3 event propagation,
- Single element data binding using datum.
It consists in a series of explained code samples and live examples. If you are not familiar with D3.js or simply need a reminder, please read our D3.js getting started tutorial.
A Simple SVG Map
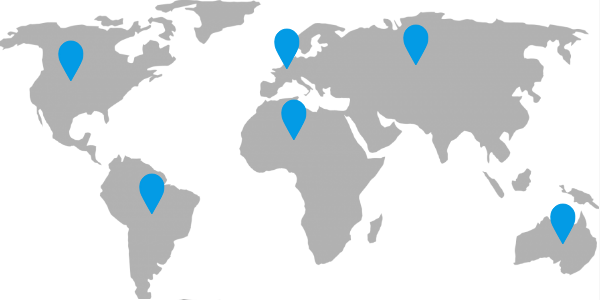
For this tutorial we will use a simple map:
- A DIV element with a world map set as the background image,
- An SVG (Scalable Vector Graphics) to draw google-maps like pointers.
<div class="svg-container">
<svg id="click" xmlns="http://www.w3.org/2000/svg" width="600" height="300">
    <defs>
        <g id="pointer" transform="scale(0.8)">
            <path d="M0-1c-14.5-25.6-14.5-25.7-14.5-33.8c0-8.1,6.5-14.6,14.5-14.6s14.5,6.6,14.5,14.6C14.5-26.7,14.5-26.6,0-1z"></path>
            <path d="M0-49c7.7,0,14,6.3,14,14.1c0,8,0,8.1-14,32.8c-14-24.7-14-24.9-14-32.8C-14-42.7-7.7-49,0-49 M0-50c-8.3,0-15,6.8-15,15.1 S-15-26.5,0,0c15-26.5,15-26.5,15-34.9S8.3-50,0-50L0-50z"></path>
        </g>
    </defs>
</svg>
</div>
Our SVG contains the definition (<defs>) of our pointer (<g id="pointer" ...>).
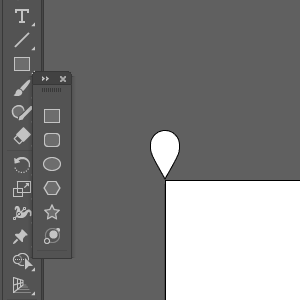
I made this pointer shape using Illustrator (can also be done using InkSkape) and took care of placing its origin at the lower extremity of the pointer:

That way if we create a pointer using the code <use href="#pointer" x="50" y="100"></use>, its pointy end will be placed at the position (50, 100).
Using shape definitions allows for code reuse and simplifies the creation of complex shapes with D3.js.
Since the original shape was too big for my map, I applied a scale of 0.8 (
transform="scale(0.8)") to my pointer definition. This transformation along with any other style (fill, stroke, etc.) made on this definition will be applied to every<use/>.
That's it for the static HTML/SVG part. Let's get to the real D3.js code!
How to handle mouse event using D3.js
Now that we have created a static map, we can handle events on the SVG with D3 to create pointers (click on the map to create new shapes):
The JavaScript used to create pointers is:
var svg = d3.select("svg");
svg.on("click", function () {
    var mouse = d3.mouse(this);
    svg
        .append("use")
        .attr("href", "#pointer")
        .attr("x", mouse[0])
        .attr("y", mouse[1])
        .attr("fill", "#039BE5")
        .attr("stroke", "#039BE5")
        .attr("stroke-width", "1px");
});
The syntax to bind a method to an event is .on("eventType", function).
To easily get the mouse position, D3 provides the mouse method.
It takes a DOM element as a parameter, not a D3 selection! And inside the event callback, the DOM element is referred as this;
If you need to get the current D3 selection, you can call
d3.select(this)or store it in a variable like in the example above.
The mouse method returns an array of coordinates [x,y]. It is used here to create (append("use")) a new pointer at the mouse position (.attr("x", mouse[0]).attr("y", mouse[1])).
But it lacks a bit of smooth animations, doesn't it?
How to animate transforms with D3.js
Now we want the pointer shape to grow at the mouse position instead of appearing at its full scale:
It gives our map a better user experience.
To do it we use the transition() and duration() D3 methods:
var svg = d3.select("svg");

svg.on("click", function () {
    var mouse = d3.mouse(this);

    var pointer = svg
        .append("use")
        .attr("href", "#pointer")
        .attr("transform", "translate(" + mouse[0] + "," + mouse[1] + ")scale(0)")
        .attr("fill", "#039BE5")
        .attr("stroke", "#039BE5")
        .attr("stroke-width", "1px");

    pointer
        .transition()
        .duration(500)
        .attr("x", mouse[0])
        .attr("y", mouse[1])
        .attr("transform", "scale(1)");
});
The first step to create this animation it to add our shape without specifying (x,y) coordinates but using the translate(x,y) transformation.
You may wonder why we do so? The answer is that the shape coordinates are affected by the scale transform.
If you set a shape coordinates to (50,100) and a scale to 0.5, it will be placed at (25,50). So doing otherwise would create the shape at (0,0) (anything scaled to 0 is 0), and progressively move it to our mouse coordinates.
Then we create an animation that lasts for 500ms (.transition().duration(500)) and:
- Sets the shape (x,y) to the mouse coordinates
.attr("x", mouse[0]).attr("y", mouse[1]) - Scales our pointer to its original size
scale(1)(the 0.8 scale of the shape definition is still kept even if we transform the current pointer), - Removes the translate transformation.
The click handler method does not have any parameter. You may wonder how to know if a keyboard key is pressed down during the mouse click?
How to use D3.event object
The D3 way of fetching the event object is by calling d3.event. For example, in the map bellow you can click on the map to create pointers, and CTRL + click on pointers to remove them:
Just like with the native JavaScript object, you can use d3.event.ctrlKey to check if the CTRL key is pressed:
var svg = d3.select("svg");
svg.on("click", function () {
    var mouse = d3.mouse(this);

    var pointer = svg
        .append("use")
        .attr("href", "#pointer")
        .attr("transform", "translate(" + mouse[0] + "," + mouse[1] + ") scale(0)")
        .attr("fill", "#039BE5")
        .attr("stroke", "#039BE5")
        .attr("stroke-width", "1px");

    pointer
        .transition()
        .duration(500)
        .attr("transform", "scale(1)")
        .attr("x", mouse[0])
        .attr("y", mouse[1]);

    pointer.on("click", function () {
        if (d3.event.ctrlKey) {
            pointer.transition()
                .duration(500)
                .attr("transform", "translate(" + pointer.attr("x") + "," + pointer.attr("y") + ") scale(0)")
                .remove();
        }
        d3.event.stopPropagation();
    });
});
transition() to scale down the pointer to 0 instead of simply removing it.
Once again, since the scaling down affect the (x,y) coordinates of the shape, we must translate it towards its position during the animation (translate(" + pointer.attr("x") + "," + pointer.attr("y") + ")).
The call to d3.event.stopPropagation(); prevents the event from propagating to the SVG click handler.
Without it a new pointer would be created where the current one is being removed.
We can now add and remove points on our map. Let's add a way to select them!
How to bind data using D3.datum
In this last live example you can:
- Click on the map to create a new pointer,
- Click while CTRL is pressed on a pointer to remove it,
- Click on a pointer to select it,
- Click on a selected pointer to unselect it.
The selected state of each pointer is stored in the element data. This can be done with D3.js datum() function:
var svg = d3.select("svg");

svg.on("click", function () {
    var mouse = d3.mouse(this);

    var pointer = svg
        .append("use")
        .datum({selected: false})
        .attr("href", "#pointer")
        .attr("transform", "translate(" + mouse[0] + "," + mouse[1] + ") scale(0)")
        .attr("fill", "#039BE5")
        .attr("stroke", "#039BE5")
        .attr("stroke-width", "1px");

    pointer
        .transition()
        .duration(500)
        .attr("transform", "scale(1)")
        .attr("x", mouse[0])
        .attr("y", mouse[1]);

    pointer.on("click", function () {
        if (d3.event.ctrlKey) {
            pointer.transition()
                .duration(500)
                .attr("transform", "translate(" + pointer.attr("x") + "," + pointer.attr("y") + ") scale(0)")
                .remove();
        } else {
            if (pointer.datum().selected) {
                pointer
                    .datum({selected: false})
                    .transition()
                    .duration(500)
                    .attr("stroke", "#039BE5")
                    .attr("stroke-width", "1px");
            } else {
                // select
                pointer
                    .datum({selected: true})
                    .transition()
                    .duration(500)
                    .attr("stroke", "#455A64")
                    .attr("stroke-width", "3px");
            }
        }
        d3.event.stopPropagation();
    });
});
When we create a pointer we initialize its data with (.datum({selected: false})): all pointers are unselected by default.
Just like calling .attr("x") returns the x coordinate of a D3 selection, you can simply call .datum() without parameters to get its data.
We use it to know if a point is selected (if (pointer.datum().selected) {) and act accordingly:
- Select a point by setting its selected state to true (
.datum({selected: true})) and changing its outline (.attr("stroke", "#455A64").attr("stroke-width", "3px")), - Unselect a point by setting its selected state to false (
.datum({selected: false})) and reverting its outline to its original color and width.
datumas a different usage thatdata: datum lets you bind data to a single element while data lets you bind an array of values (or complex object) to a D3 selection.
Conclusion
I hope you enjoyed this tutorial, if you need more information about D3.js some other guides are available on this blog.
