
Extend OctoPerf results with Instana
Today we have a look at the added value you get by using a combination of load testing and APM. Our tool of choice at OctoPerf is Instana, because we share a lot of common values. To put it short we both have a huge focus on ease of use and docker oriented platforms. I think it makes this collaboration even more relevant for our users.
Anyway, as you probably know OctoPerf is oriented toward running realistic tests as easily as possible. And Instana will get you live insight about your entire platform allowing you to instantly understand the consequences of your load test. This blog post is a collaboration with folks at Instana and you can find the second part whith a detailed analysis of the test on their blog.
Test script
We will be conducting a small test on the robot shop platform provided by Instana:

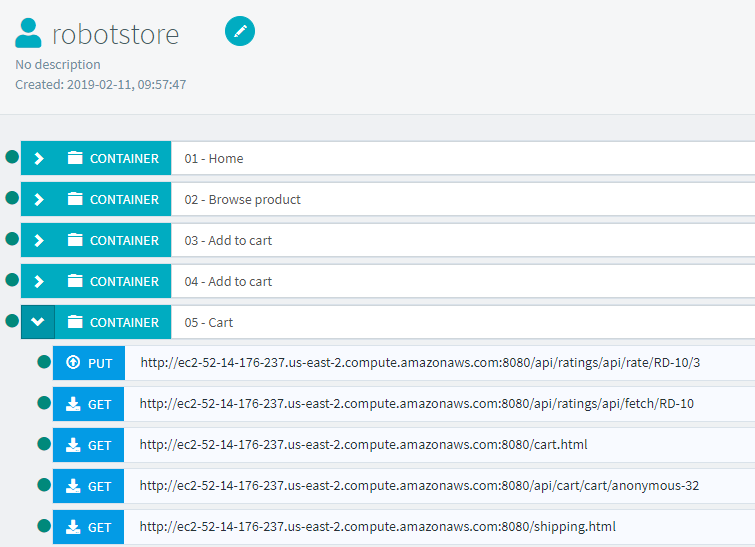
I recorded a quick test script adding two products to the cart, I named the transactions this way:
Runtime configuration
Load policy
And regarding the runtime, we will be launching 200 users in total but split between 2 cloud locations:

EU West is an Amazon Web Services zone in Paris and EU is the Amsterdam zone from Digital Ocean. Since the robot shop is hosted on Amazon as well but not in Paris we expect to see different results from both zones. In particular coming from outside Amazon's network should take longer.
Instana integration
Before launching the test, we activated the Instana header in OctoPerf:
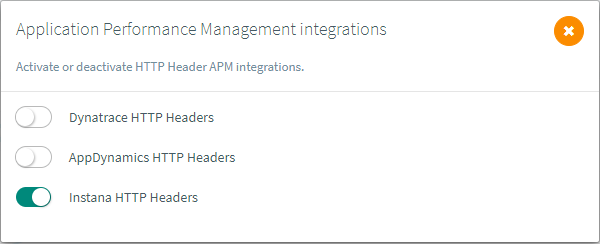
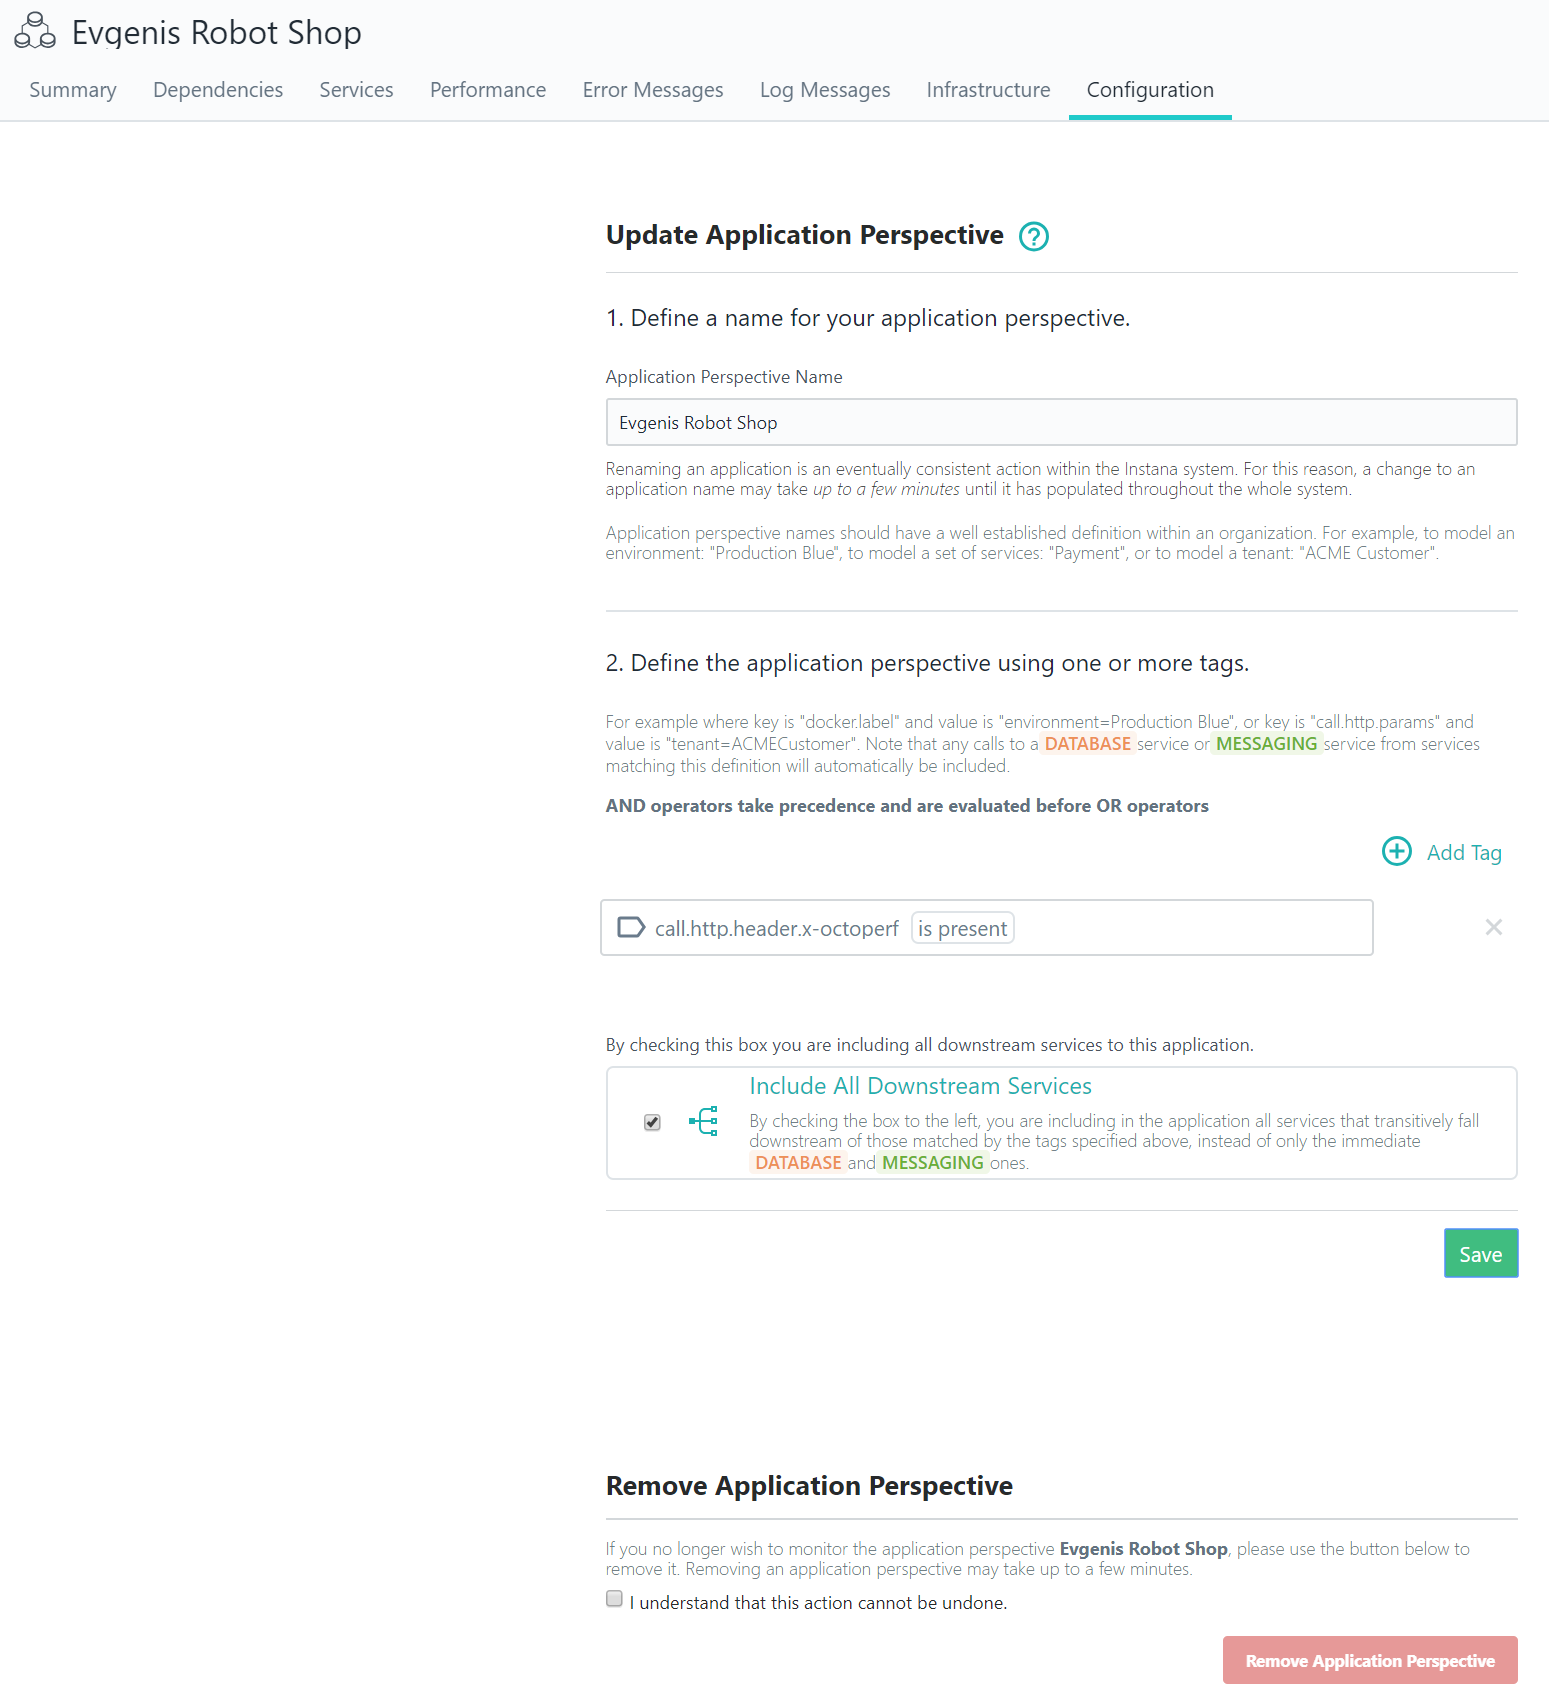
That way we'll send additional information on the test we run. The following configuration has been done on Instana to catch it:
Test results
Overview
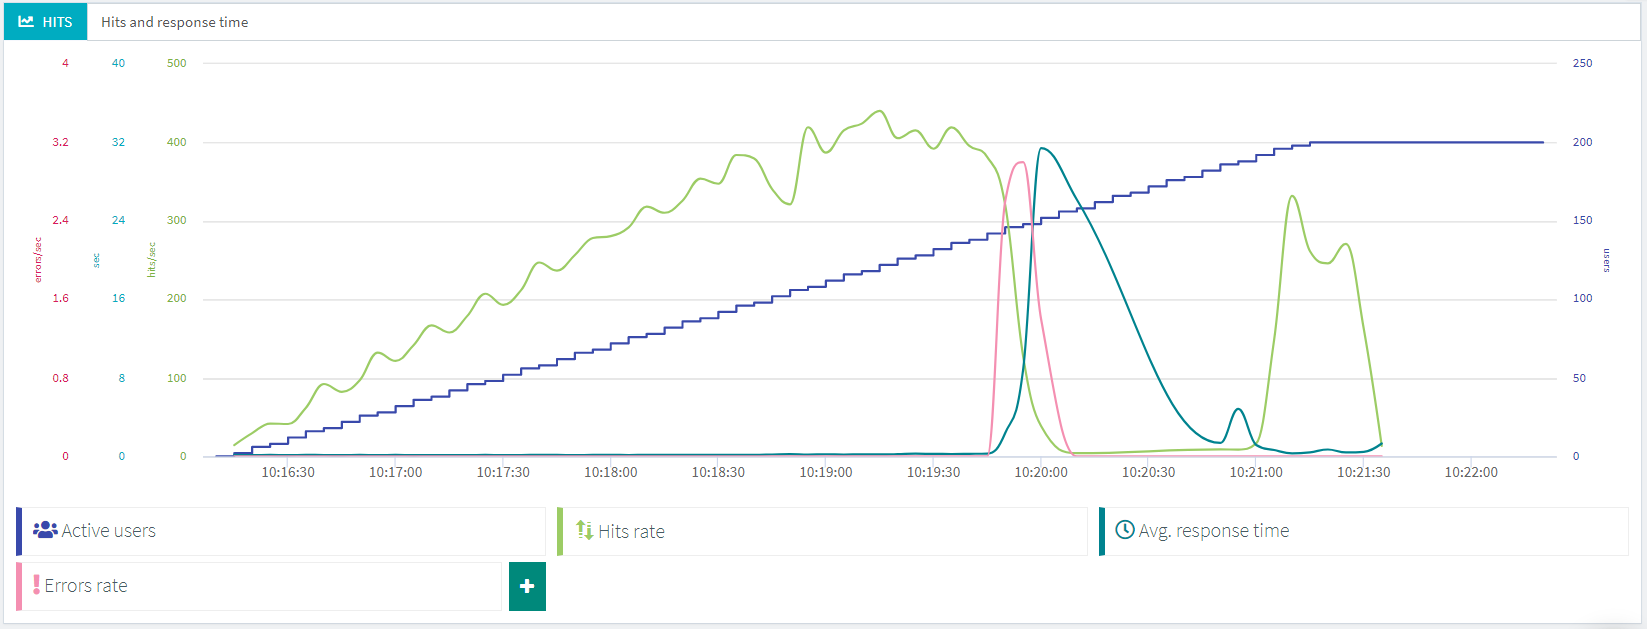
If we focus on the hit rate in light green we clearly see something's wrong just before 10:20. At the same time, the error rate is increasing along with response times.
APDEX
The APDEX graph shows the same issue:

It drops down at the same time than the hit rate, indicating a decrease in quality of service all the way down to 0 for a short time.
Results prior to failure
Using a time range filter I first focused on the period before the issue:
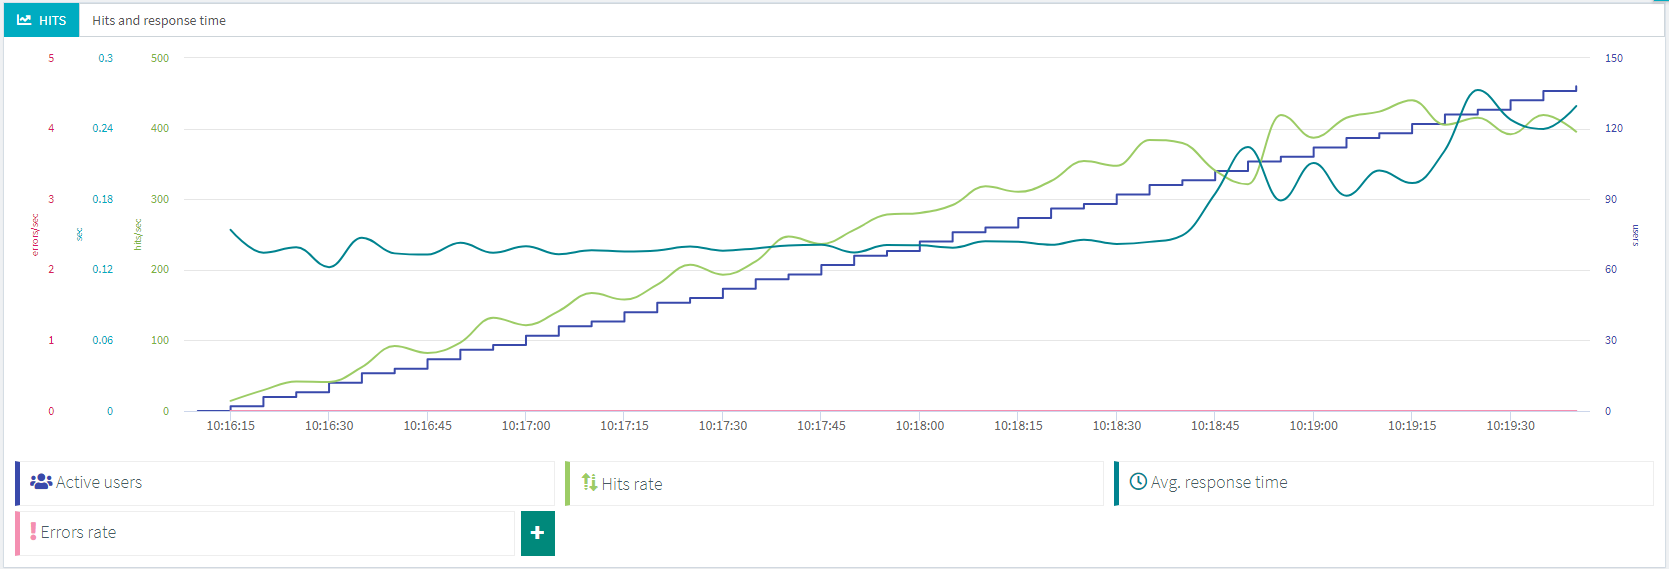
It is interesting to see that even before we have a critical failure, response times are already starting to increase. The hit rate mostly follows the number of users running meaning the test is still ok so far. But as we know this will not be the case for long.
Error details
Looking at the details of one error we can see the application is not responding anymore (timeout):
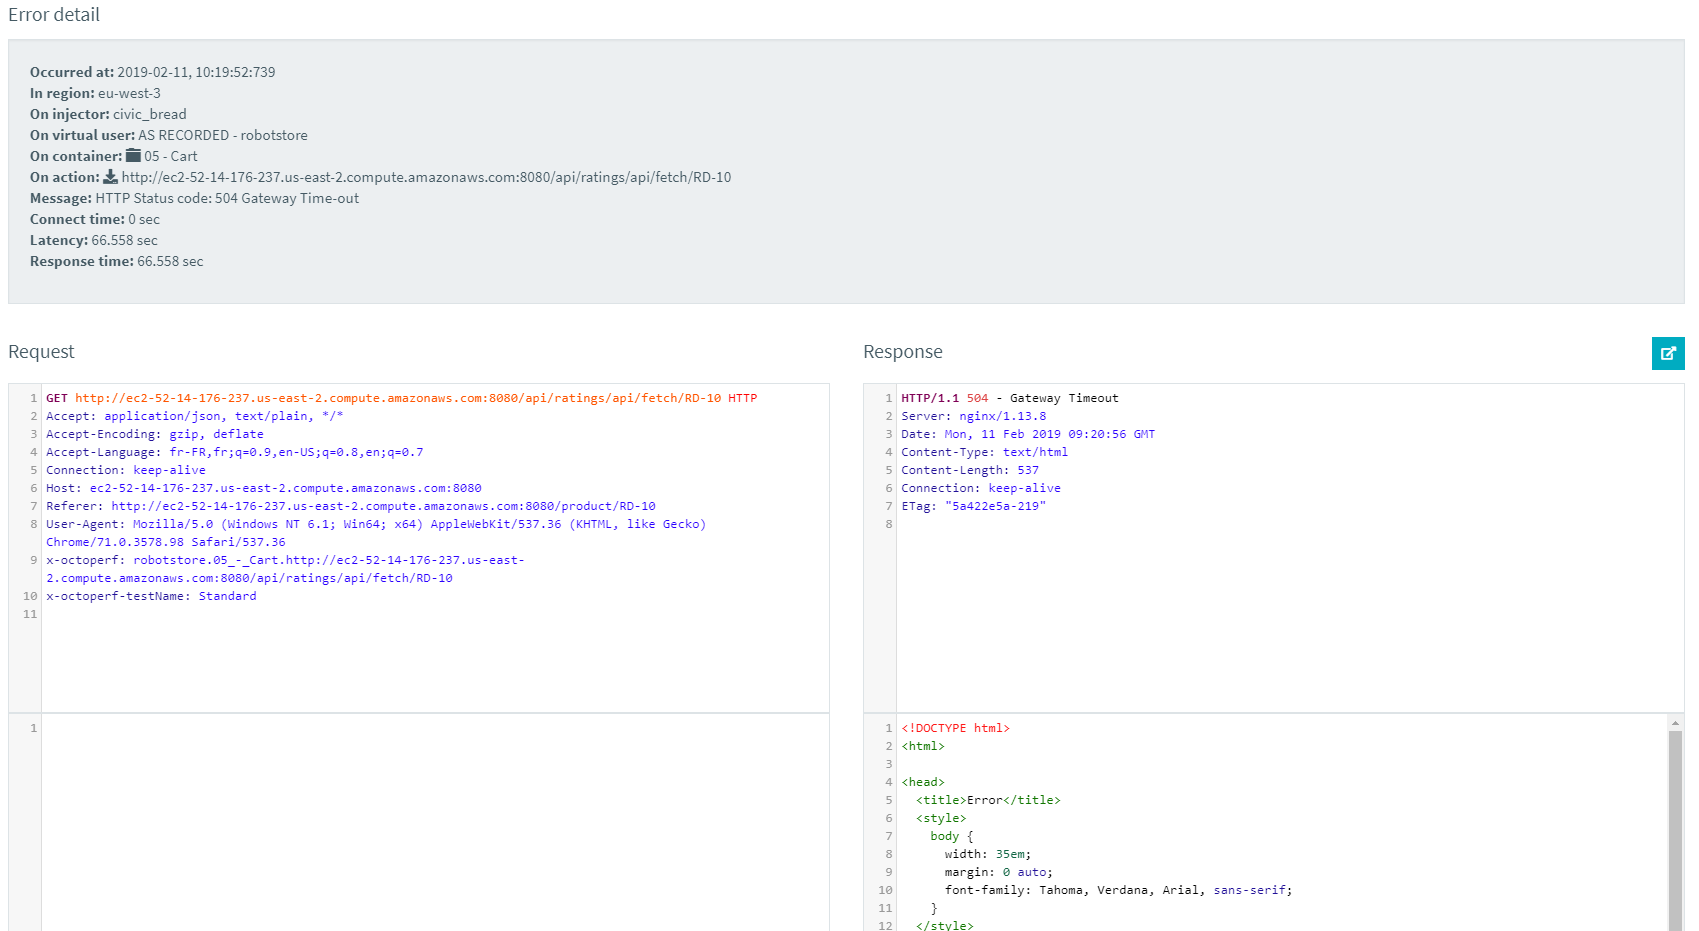
That certainly explains why the response times are getting higher at that time.
Result tree
A look at the result tree gives us valuable information:
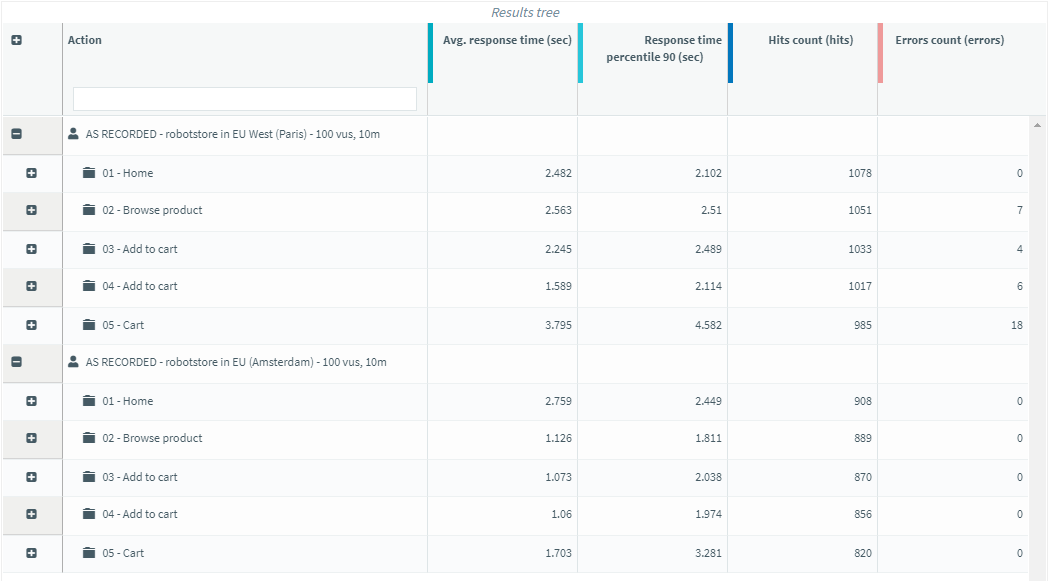
First we can see that we only get errors from AWS in Paris whereas the application is not available anymore after 10:20. What's going on is that users coming from Digital Ocean in amsterdam are having a longer timeout. In fact the test had time to finish before they could get any answer. We clearly see that the network path taken is not the same since the behavior is very different. It only stresses out that coming from outside the application network, like a real user would do is critical to realistic tests.
AWS versus DO
On this table, we have AWS on the left and DO on the right:
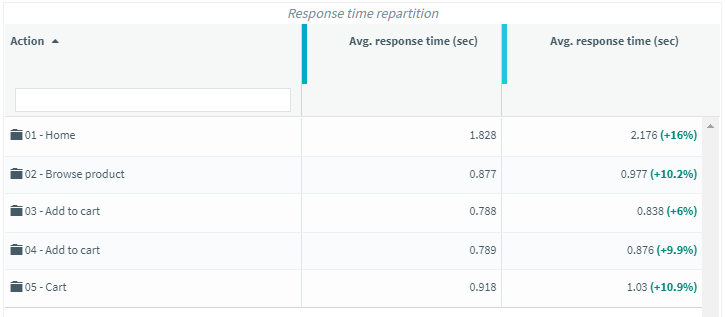
We clearly see that the users coming from outside AWS have a longer response time.
Response time breakdown
Looking at the response time breakdown we see mostly server time:

Since latency and response time increase together we can tell that the server is overloaded.
Throughput
A quick look at the throughput is alway interesting:

Since it's mostly images (png and jpg), we can tell that the text content is optimized. But looking at the list of bandwidth hungry ressources, we see one in particular:

The image graph.png is using 1.3 GB of bandwidth out of the 1.7 GB used for this test.
It's probably worth investigating this further.
Instana analysis
While the test is running in OctoPerf, we quickly get a warning on Instana: SYSTEM LOAD TOO HIGH.
We then get another message: SYSTEM MEMORY EXHAUSTED telling us the server is out of memory.

Looking into the details we can also see the performance dropping quickly for each layer:
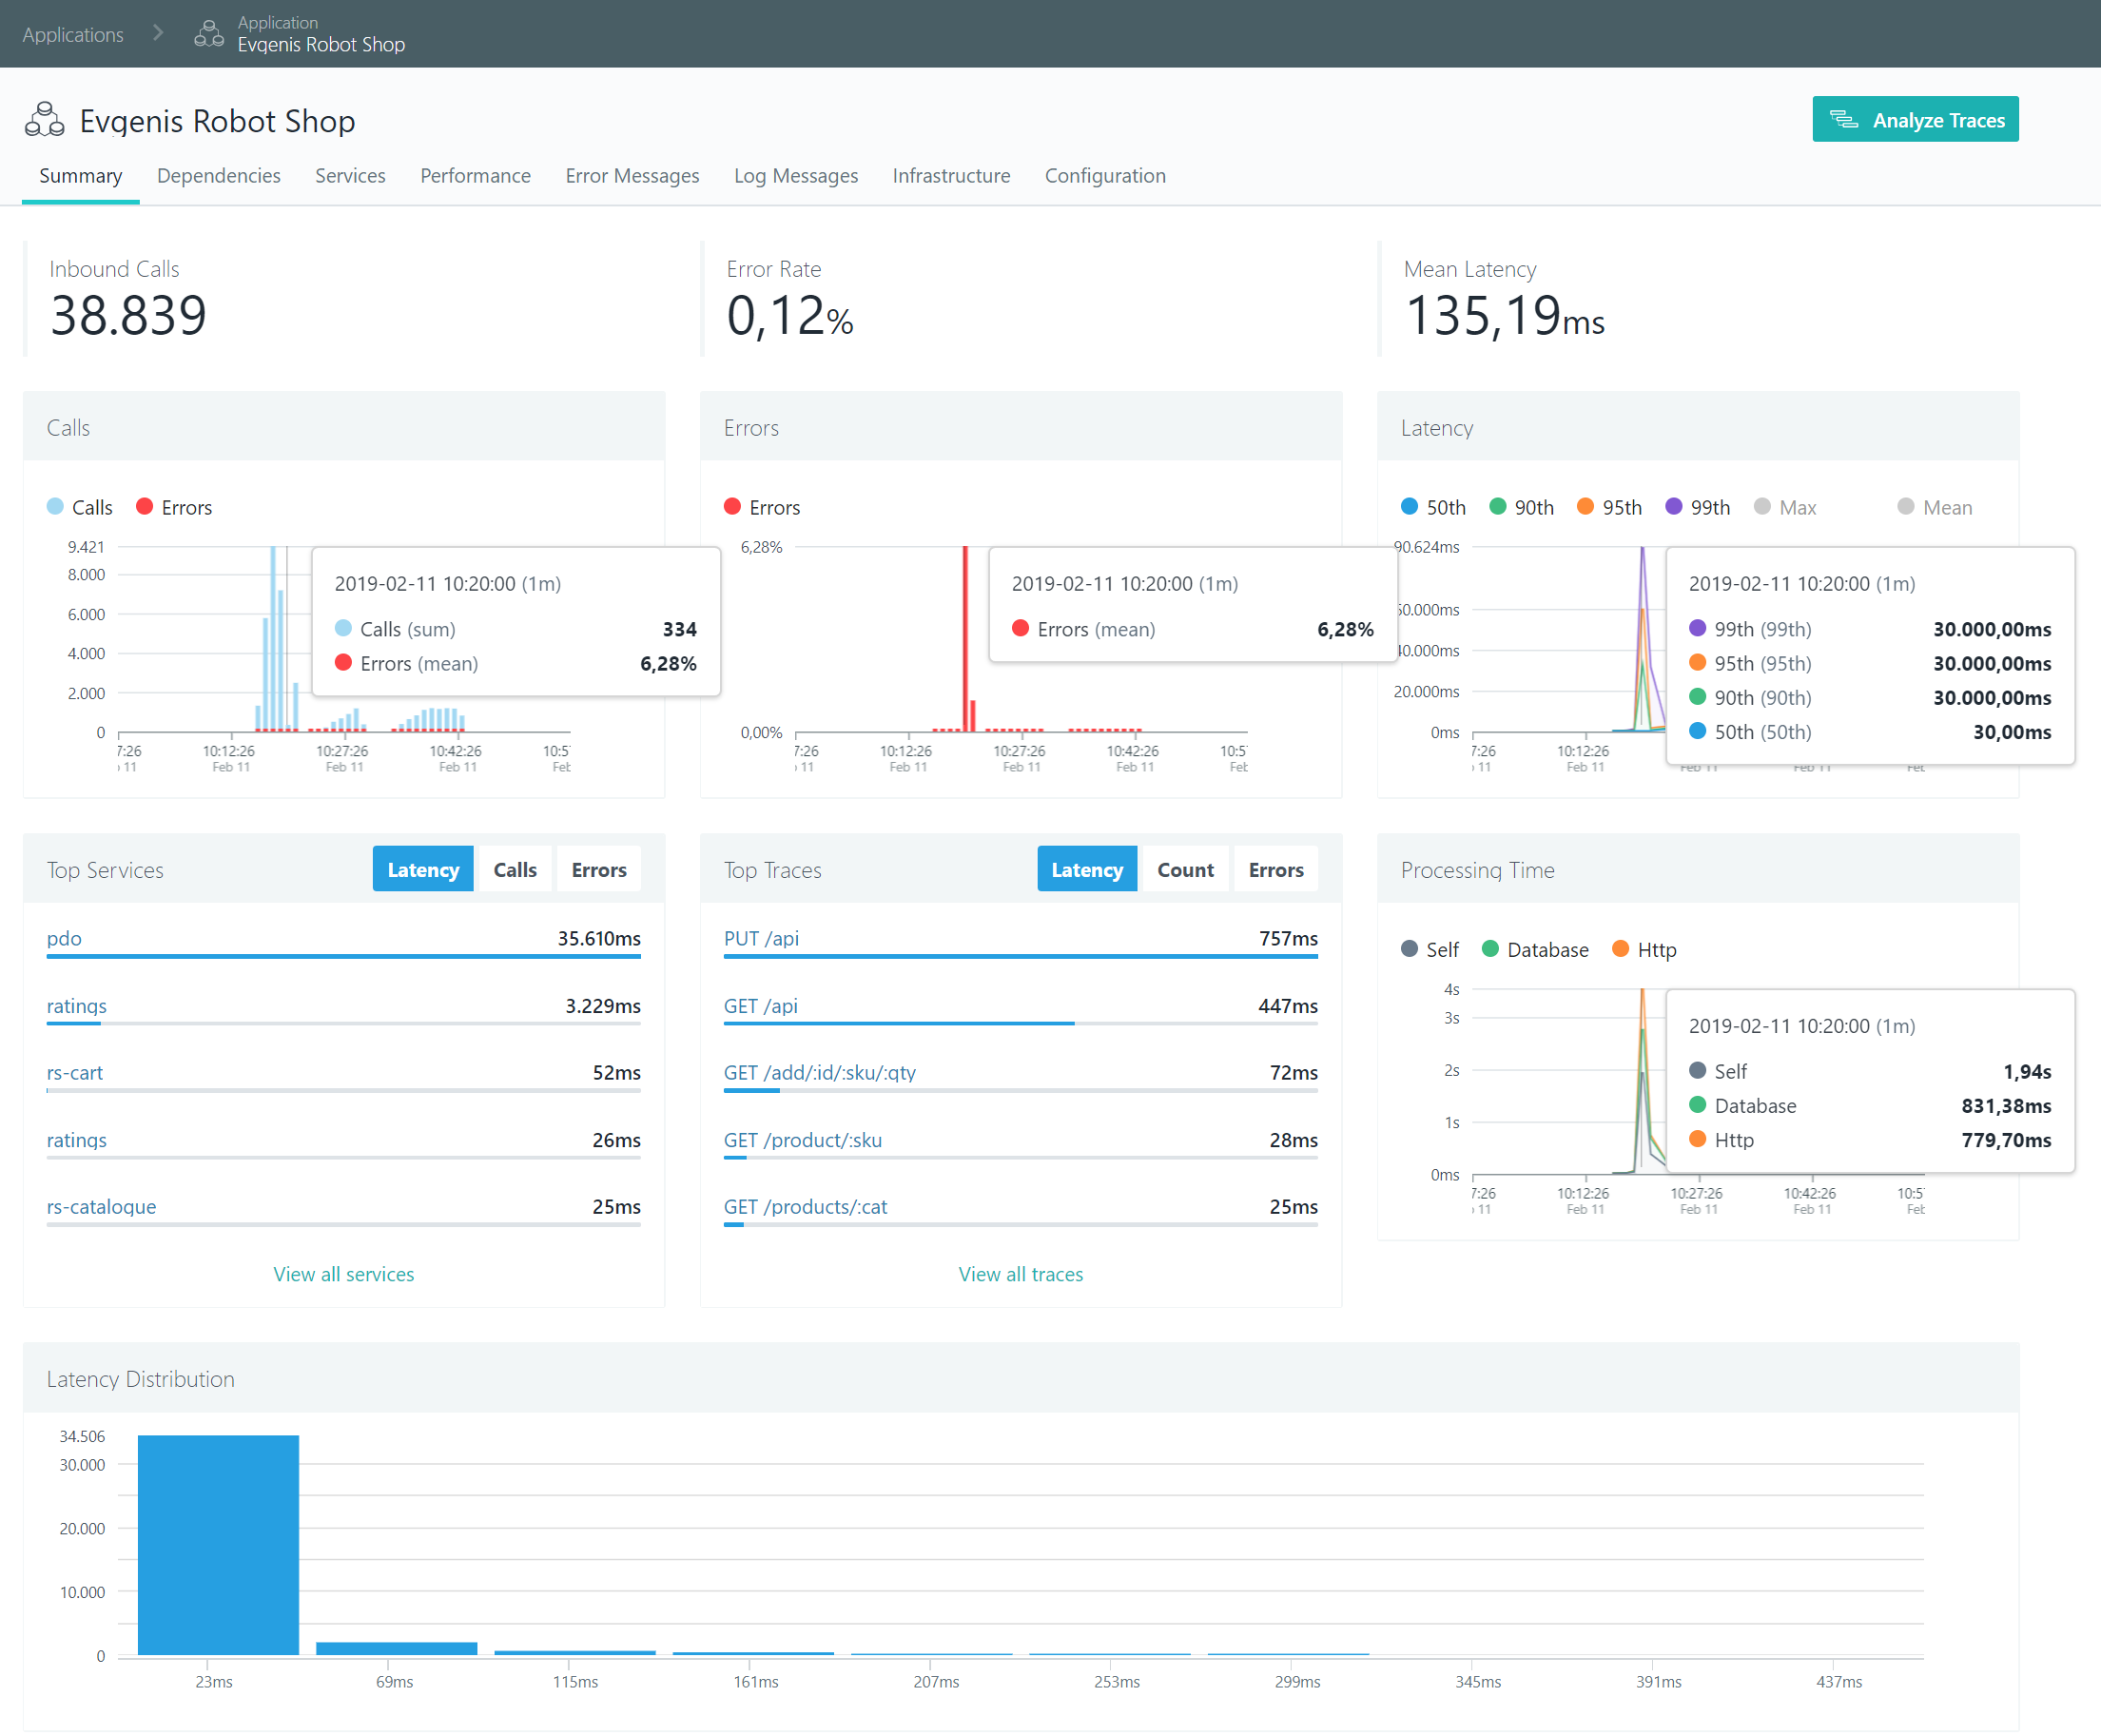
Then the database stops answering around 10:20 which explains the timeouts we get later. But this is just a quick overview of all you can get out of Instana. Again, you can find a more detailed analysis in the second part of this blog on their website.
Conclusion
A load test, as realistic as it might be, is only worth as much as you can get out of its analysis. Since Instana makes this process even easier, it is a perfect match for a load testing tool like OctoPerf. Plus it's been a real pleasure working with folks at Instana on this blog post, so you can expect more collaboration in the future.
