
How to configure and use JMeter logging
We are going to look at how JMeter outputs to both the log panel in GUI mode and the log file in non-GUI mode. We will look at the properties relating to the GUI log panel and the Appenders and Loggers that determine what data is output and at what level the logs are output at.
JMeter uses log4j to provide its logging mechanism and from the log4j website:
Log4j has three main components: loggers, appenders and layouts. These three types of components work together to enable developers to log messages according to message type and level, and to control at runtime how these messages are formatted and where they are reported.
We will look at how Jmeter configures Appenders and Loggers separately but they work together to produce the logged output.
The logging level can be set in several ways:
- From the log4j2.xml file,
- From the menu,
- From the command line.
We will explore all of these during this post. Note that you can download the sample JMX here.
Configuring the log panel
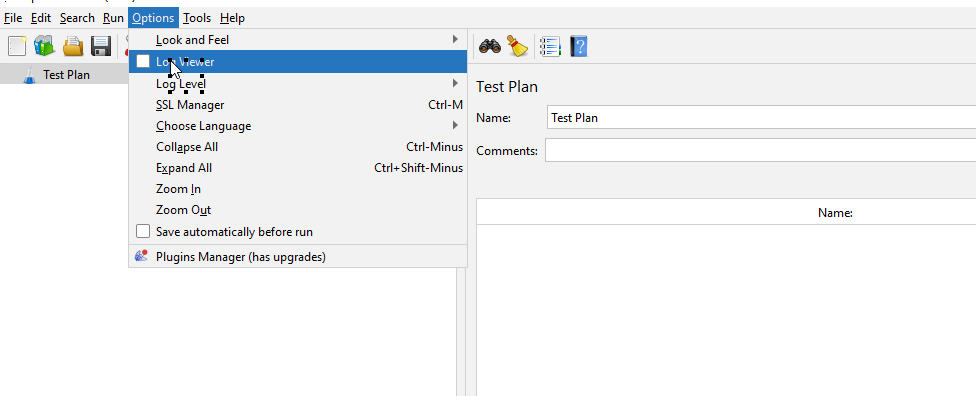
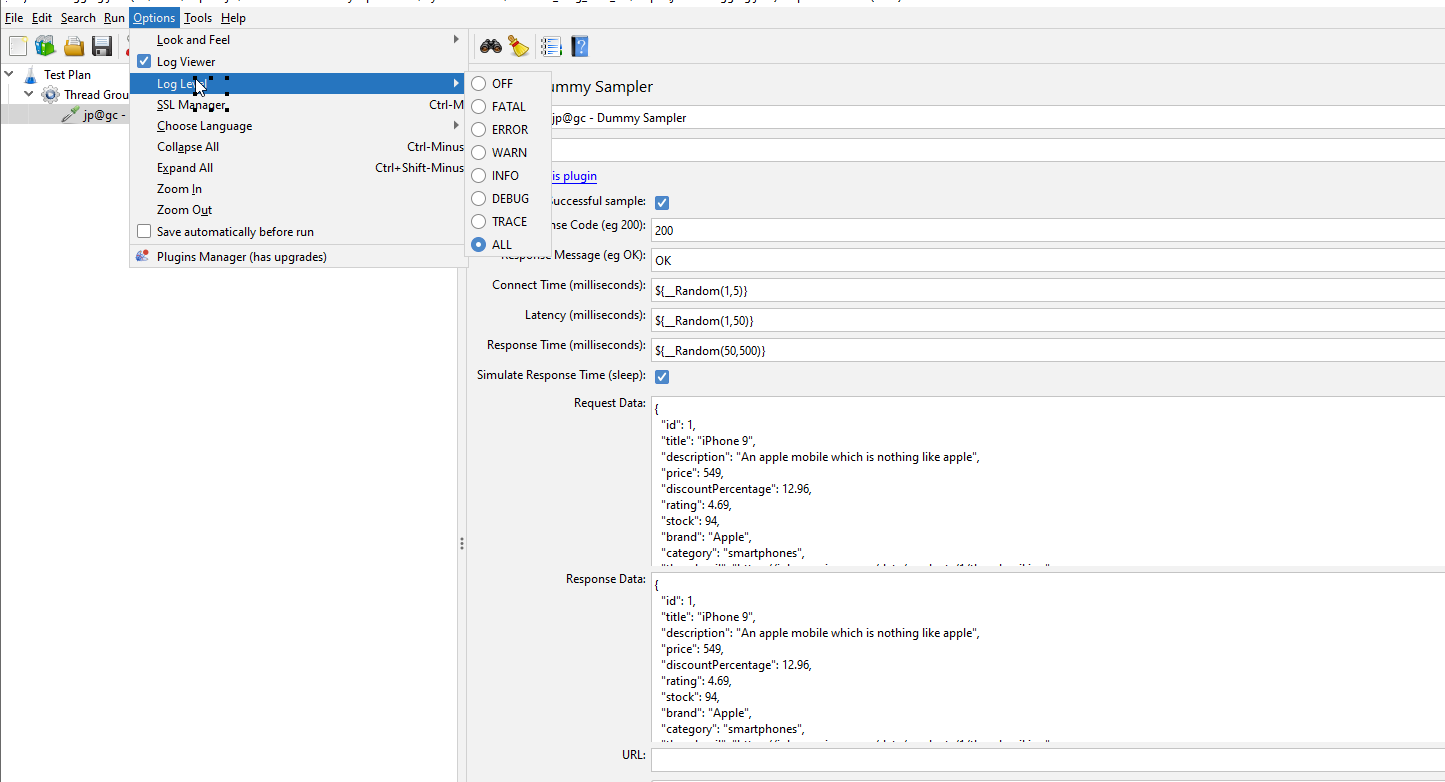
The log panel that is displayed in the GUI can be made visible using the Option -> Log Viewer menu option which I am sure you are familiar with.
There are a number of configurable options in the jmeter.properties file that support the log viewer in the GUI.
These are all by default commented out and consist of:
# LoggerPanel display
# default to false

#jmeter.loggerpanel.display=false

# Enable LogViewer Panel to receive log event even if closed
# Enabled since 2.12
# Note this has some impact on performances, but as GUI mode must
# not be used for Load Test it is acceptable

#jmeter.loggerpanel.enable_when_closed=true

# Max lines kept in LoggerPanel, default to 1000 chars
# 0 means no limit

#jmeter.loggerpanel.maxlength=1000

# Interval period in ms to process the queue of events of the listeners

#jmeter.gui.refresh_period=500
Let’s look at these in turn.
display
The first one is basically displaying the log panel when JMeter starts in GUI mode, this defaults to false when commented out.
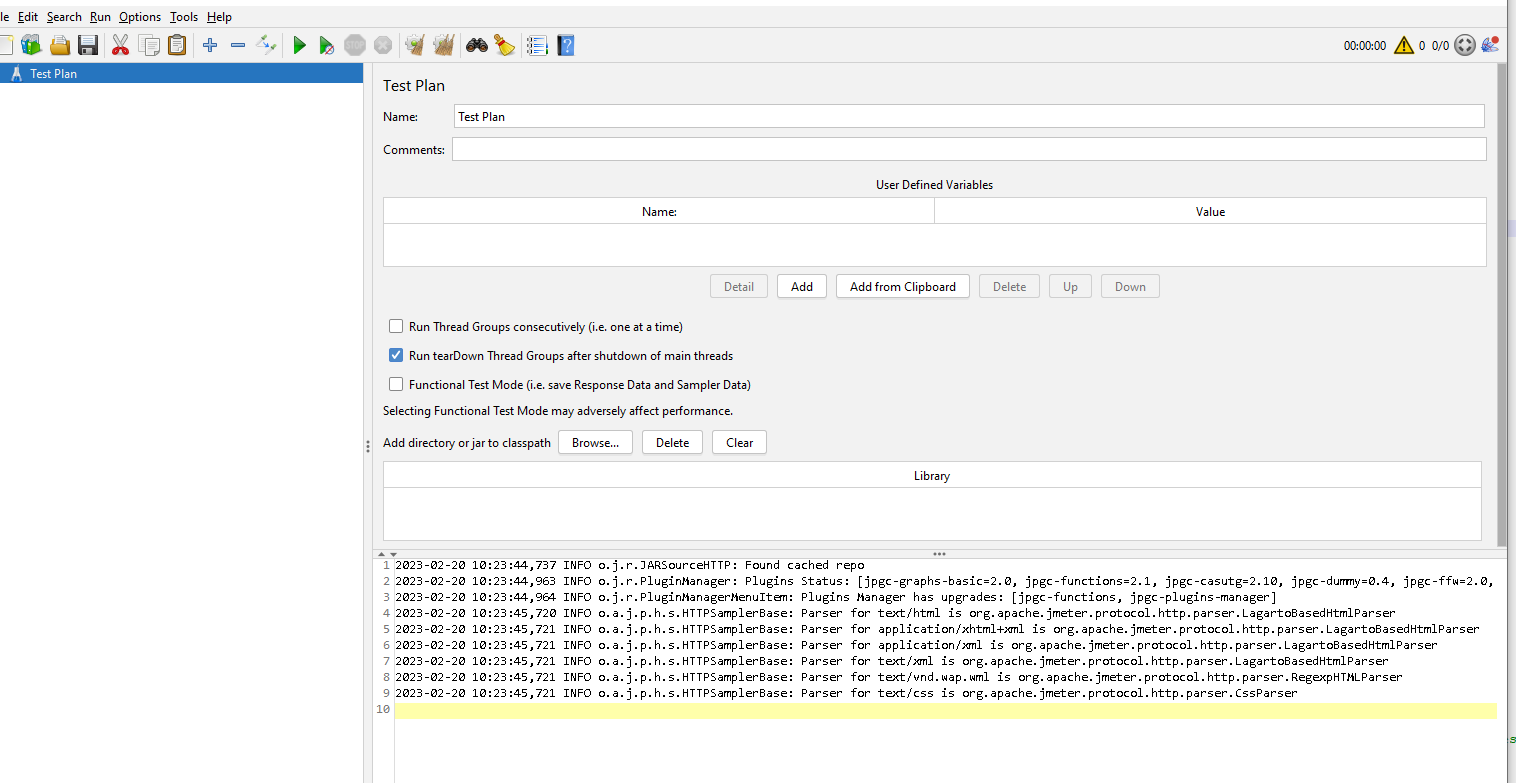
If we change this to true and re-start JMeter we see that the log panel is opened on start-up.
jmeter.loggerpanel.display=true
enable_when_closed
The next option basically writes to the log viewer even when closed.
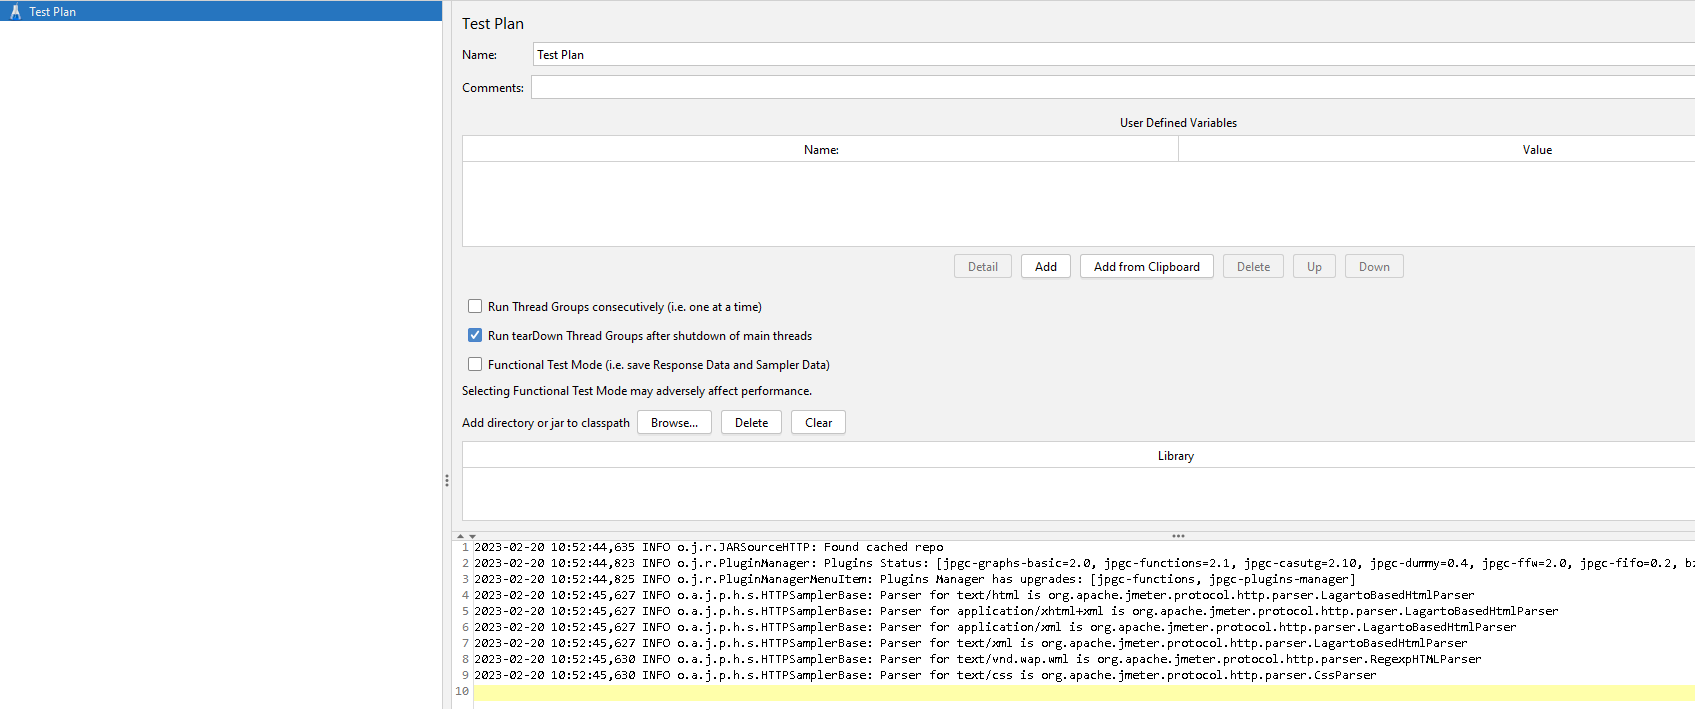
jmeter.loggerpanel.enable_when_closed=true
So, if you start JMeter the log panel is closed, as we have undone the first change we made, but if we open the log viewer, we can see it has been written to even though it was closed.
Length and refresh
We will not demo the last 2 options as they are straightforward to understand.
This one increases the log size before it starts to cycle:
jmeter.loggerpanel.maxlength=1000
And this one allows you to change the interval, in milliseconds, that the log is written to:
jmeter.gui.refresh_period=500
Appenders
The Appenders section is configured in the log4j2.xml file and consists of these configurable parameters.
<Appenders>

<!-- Uncomment to set rotating logs up to 5 files of 100 MB-->
<!--

<RollingFile name="jmeter-log" fileName="${sys:jmeter.logfile:-jmeter.log}" append="false"
filePattern="jmeter-%d{yyyyMMdd}-%i.log.gz">

<PatternLayout>
<pattern>%d %p %c{1.}: %m%n</pattern>
</PatternLayout>

<Policies>
<SizeBasedTriggeringPolicy size="100 MB" />
</Policies>

<DefaultRolloverStrategy max="5" />

</RollingFile>
-->

<File name="jmeter-log" fileName="${sys:jmeter.logfile:-jmeter.log}" append="false">

<PatternLayout>
<pattern>%d %p %c{1.}: %m%n</pattern>
</PatternLayout>

</File>

<GuiLogEvent name="gui-log-event">

<PatternLayout>
<pattern>%d %p %c{1.}: %m%n</pattern>
</PatternLayout>

</GuiLogEvent>

</Appenders>
Let’s look at each in turn.
Rolling logs
We’ll start with the section that is commented out which allows you to output rolling logs, by default it is configured to output a maximum of 5 logs and for each to have a maximum size of 100MB.
This is configurable, and so we can look at how it works we will lower trigger size to 5 KB.
<Policies>

<SizeBasedTriggeringPolicy size="5 KB" />

</Policies>
And we’ll leave the DefaultRolloverStrategy at 5.
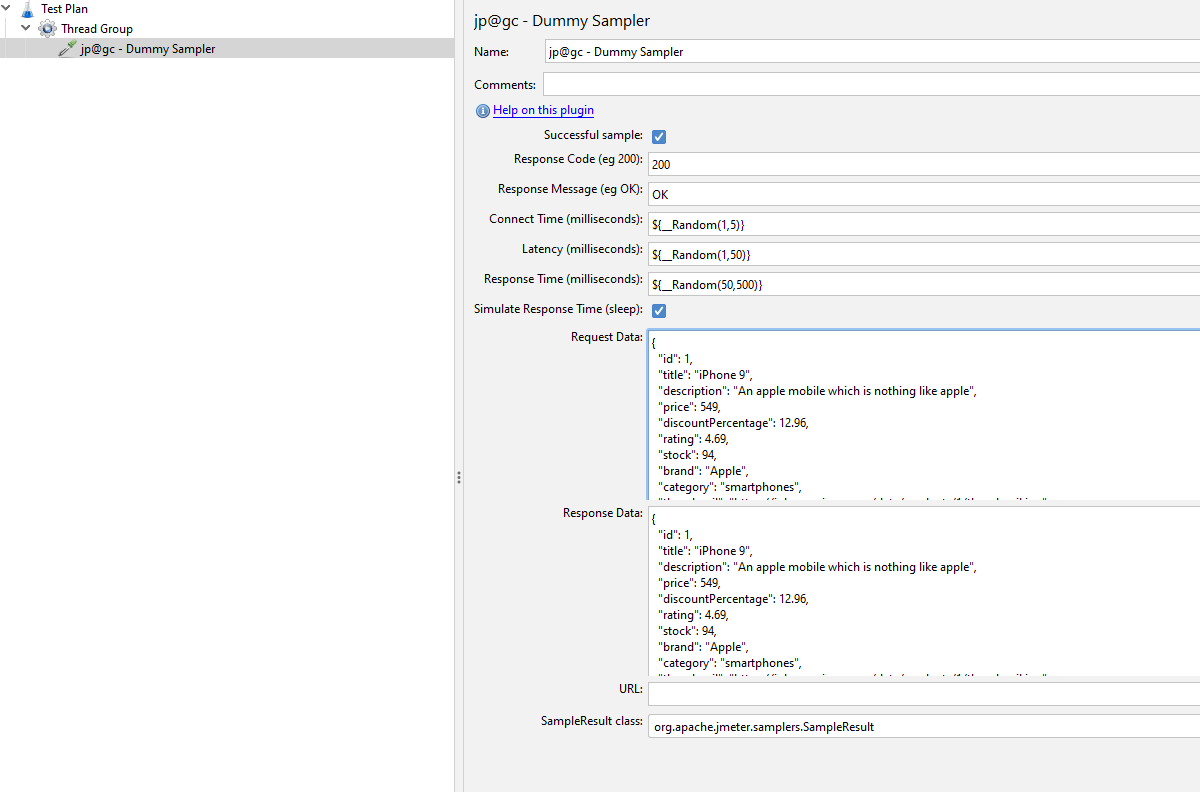
We have added a Dummy Sampler to our test and have set a random JSON Request and Response.
We will also need to set the debug level to be the highest it can be so we generate enough output to fill the logs, we will discuss this topic later in his post but for now will do this from the Menu items and set this to ALL.
We’ll set the Loop Count to be 100 to give us a reasonable number of iterations and run the test.
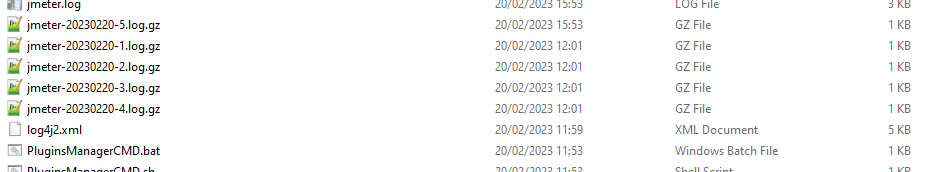
We can see that we get 5 compressed logs as expected all formatted as defined in the filePattern element of the log4j2.xml file.
filePattern="jmeter-%d{yyyyMMdd}-%i.log.gz">
Patterns
We will re-comment the rolling logs elements in the log4j2.xml file and move onto the pattern elements.
The Appenders section defines what information is output into the logs and this is defined in this section.
<File name="jmeter-log" fileName="${sys:jmeter.logfile:-jmeter.log}" append="false">

<PatternLayout>
<pattern>%d %p %c{1.}: %m%n</pattern>
</PatternLayout>

</File>

<GuiLogEvent name="gui-log-event">

<PatternLayout>
<pattern>%d %p %c{1.}: %m%n</pattern>
</PatternLayout>

</GuiLogEvent>
We can see that the output to the log file and the GUI log view has the same pattern by default, this being:
%d %p %c{1.}: %m%n
So what does this pattern mean? it is documented here which also shows other options you can add to your JMeter logging output message.
Let’s look at each one in turn, and then we’ll look at extending the output pattern using some of the other options.
%d
Used to output the date of the logging event. The date conversion specifier may be followed by a date format specifier enclosed between braces. For example, %d{HH
ss,SSS} or %d{dd MMM yyyy HH
The date format specifier admits the same syntax as the time pattern string of the SimpleDateFormat. Although part of the standard JDK, the performance of SimpleDateFormat is quite poor.
For better results it is recommended to use the log4j date formatters. These can be specified using one of the strings "ABSOLUTE", "DATE" and "ISO8601" for specifying AbsoluteTimeDateFormat, DateTimeDateFormat and respectively ISO8601DateFormat. For example, %d{ISO8601} or %d{ABSOLUTE}.
These dedicated date formatters perform significantly better than SimpleDateFormat.
%p
Used to output the priority of the logging event.
%c
Used to output the category of the logging event. The category conversion specifier can be optionally followed by precision specifier, that is a decimal constant in brackets.
If a precision specifier is given, then only the corresponding number of right most components of the category name will be printed. By default the category name is printed in full.
For example, for the category name "a.b.c" the pattern %c{2} will output "b.c".
%m
Used to output the application supplied message associated with the logging event.
%n
Outputs the platform dependent line separator character or characters.
This conversion character offers practically the same performance as using non-portable line separator strings such as "\n", or "\r\n". Thus, it is the preferred way of specifying a line separator.
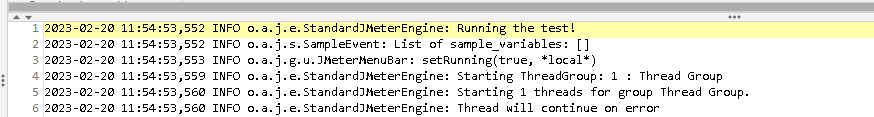
If we look at an example from our GUI log viewer or log file, we can see that this is what we are seeing.
Let’s look at extending the pattern to this
<PatternLayout>
<pattern>%d %p %t %c{1.}: %m%n</pattern>
</PatternLayout>
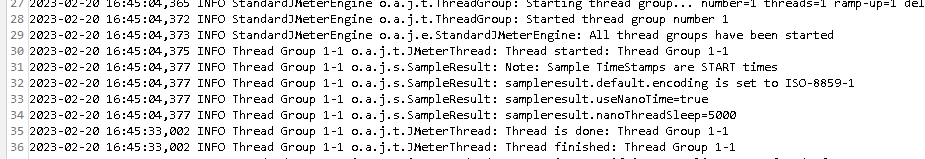
We have added the %t conversion character to the pattern.
From the log4j documentation we see
%t
Used to output the name of the thread that generated the logging event.
We have done this for both the GUI log viewer and the log file, if we generate some log entries we see that the Thread Group has been added.
There is no reason that the GUI log viewer and log file needs to follow the same pattern, they can have their own.
We have looked at how we can format the message detail, now we are going to look at how we can change the log level.
Loggers
We have already looked at one way to change the granularity of the logs, and this is to use the JMeter menu.
Where you can set the log level at run time, this is self-explanatory where you set your log level depending on the detail you want to see in your log files.
The log4j2.xml file does however give you more control over what gets output to the log files, and we will look at this here.
The loggers section in this file is mainly commented out by default.
<Loggers>

<Root level="info">

<AppenderRef ref="jmeter-log" />
<AppenderRef ref="gui-log-event" />

</Root>

<Logger name="org.apache.jmeter.junit" level="debug" />

<!--
<Logger name="org.apache.jmeter.control" level="debug" />
<Logger name="org.apache.jmeter.testbeans" level="debug" />
<Logger name="org.apache.jmeter.engine" level="debug" />
<Logger name="org.apache.jmeter.threads" level="debug" />
<Logger name="org.apache.jmeter.gui" level="warn" />
<Logger name="org.apache.jmeter.testelement" level="debug" />
<Logger name="org.apache.jmeter.util" level="warn" />
<Logger name="org.apache.jmeter.protocol.http" level="debug" />
-->

<!-- # For CookieManager, AuthManager etc: -->
<!--
<Logger name="org.apache.jmeter.protocol.http.control" level="debug" />
<Logger name="org.apache.jmeter.protocol.ftp" level="warn" />
<Logger name="org.apache.jmeter.protocol.jdbc" level="debug" />
<Logger name="org.apache.jmeter.protocol.java" level="warn" />
<Logger name="org.apache.jmeter.testelements.property" level="debug" />
-->

<Logger name="org.apache.jorphan" level="info" />

<!-- # Apache HttpClient logging examples -->

<!-- # Enable header wire + context logging - Best for Debugging -->
<!--
<Logger name="org.apache.http" level="debug" />
<Logger name="org.apache.http.wire" level="error" />
-->

<!-- # Enable full wire + context logging -->
<!-- <Logger name="org.apache.http" level="debug" /> -->

<!-- # Enable context logging for connection management -->
<!-- <Logger name="org.apache.http.impl.conn" level="debug" /> -->

<!-- # Enable context logging for connection management / request execution -->
<!--
<Logger name="org.apache.http.impl.conn" level="debug" />
<Logger name="org.apache.http.impl.client" level="debug" />
<Logger name="org.apache.http.client" level="debug" />
-->

<!-- # Reporting logging configuration examples -->

<!-- # If you want to debug reporting, uncomment this line -->
<!-- <Logger name="org.apache.jmeter.report" level="debug" /> -->

<!-- # More user specific logging configuration examples. -->

<!-- <Logger name="org.apache.jorphan.reflect" level="debug" /> -->
<!--
# Warning: Enabling the next debug line causes javax.net.ssl.SSLException: Received fatal alert: unexpected_message for certain sites when used with the default HTTP Sampler
-->

<!--
<Logger name="org.apache.jmeter.util.HttpSSLProtocolSocketFactory" level="debug" />
<Logger name="org.apache.jmeter.util.JsseSSLManager" level="debug" />
-->

<!-- # Enable Proxy request debug -->
<!-- <Logger name="org.apache.jmeter.protocol.http.proxy.HttpRequestHdr" level="debug" /> -->

</Loggers>
Let’s consider the first part of this
<Root level="info">

<AppenderRef ref="jmeter-log" />
<AppenderRef ref="gui-log-event" />

</Root>
This means that if no other loggers are set explicitly then the logging level is set to Info.
The next block looks at how we can set logging levels for specific types of requests and tests.
<Logger name="org.apache.jmeter.junit" level="debug" />

<!--
<Logger name="org.apache.jmeter.control" level="debug" />
<Logger name="org.apache.jmeter.testbeans" level="debug" />
<Logger name="org.apache.jmeter.engine" level="debug" />
<Logger name="org.apache.jmeter.threads" level="debug" />
<Logger name="org.apache.jmeter.gui" level="warn" />
<Logger name="org.apache.jmeter.testelement" level="debug" />
<Logger name="org.apache.jmeter.util" level="warn" />
<Logger name="org.apache.jmeter.protocol.http" level="debug" />
-->
<Logger name="org.apache.jorphan" level="info" />
JUnit
The first entry is uncommented
<Logger name="org.apache.jmeter.junit" level="debug" />
and means that by default if you use the Junit Sampler as part of your tests then these automatically output debug level logging to the log files.
JOrphan
The last entry in this block is also uncommented
<Logger name="org.apache.jorphan" level="info" />
Jorphan (JMeter Orphan) are a set of utility classes that were created by one of JMeter’s committers, their JavaDocs can be found here
So basically, by default anything that forms part of this utility class will output at an info level to the logs.
Control
<Logger name="org.apache.jmeter.control" level="debug" />
This class manages the Controllers you will use as you build your tests, and therefore if you want to set the log level explicitly for these you would do this here.
The package definition can be found here.
Testbeans
<Logger name="org.apache.jmeter.testbeans" level="debug" />
This class manages the TestBeans you may use in your tests, and therefore if you want to set the log level explicitly for these you would do this here.
The package definition can be found here.
Engine
<Logger name="org.apache.jmeter.engine" level="debug" />
This class manages the JMeter engine that is responsible for the execution of your tests, and therefore if you want to set the log level explicitly for these you would do this here.
The package definition can be found here.
Threads
<Logger name="org.apache.jmeter.threads" level="debug" />
This class manages the Thread Groups that manage the threads and duration of your tests, and therefore if you want to set the log level explicitly for these you would do this here.
The package definition can be found here.
Gui
<Logger name="org.apache.jmeter.gui" level="warn" />
This class manages the JMeter GUI that includes the Listeners, and therefore if you want to set the log level explicitly for these you would do this here.
The package definition can be found here.
Testelement
<Logger name="org.apache.jmeter.testelement" level="debug" />
This class manages the Test Plan, and therefore if you want to set the log level explicitly for these you would do this here.
The package definition can be found here.
Util
<Logger name="org.apache.jmeter.util" level="warn" />
This class manages several aspects of your tests including the JSR223 and BeanShell elements, and therefore if you want to set the log level explicitly for these you would do this here.
The package definition can be found here.
Http
<Logger name="org.apache.jmeter.protocol.http" level="debug" />
This class manages HTTP Requests and aspects of the Cache Manager and Authentication Manager, and therefore if you want to set the log level explicitly for these you would do this here.
The package definition can be found here.
Others
The remaining 5 deal explicitly with various protocols
<Logger name="org.apache.jmeter.protocol.http.control" level="debug" />
<Logger name="org.apache.jmeter.protocol.ftp" level="warn" />
<Logger name="org.apache.jmeter.protocol.jdbc" level="debug" />
<Logger name="org.apache.jmeter.protocol.java" level="warn" />
<Logger name="org.apache.jmeter.testelements.property" level="debug" />
The final section in the log4j2.xml file provides some examples of how you can set up logging for specific scenarios and are again self-explanatory.
Command Line
You can explicitly set the logging level on the command line in the format
-L[category]=[priority]
So for example if you want to set the logging level for one of our examples above you would on the command line add
-Lorg.apache.jmeter.testelements.property=debug
And the results would be the same as setting this explicitly in the log4j2.xml file
Conclusion
Clearly logging can assist in building and debugging your tests and understanding how you configure this to provide as much detail as possible is useful, this is what we have tried to achieve in this post.
Just as a finishing note, logging during performance tests will have a detrimental impact on your tests and the results produced when you have high levels of JMeter logging enabled may not be accurate or representative.