Infrastructure Monitoring
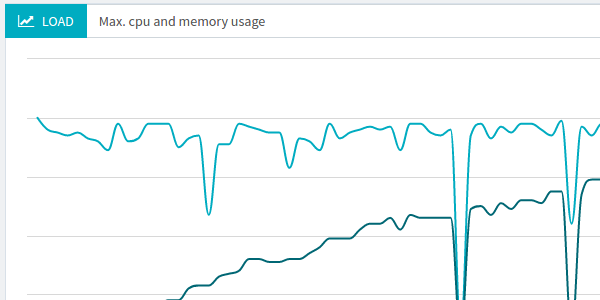
We're proud to introduce brand new analysis metrics. Load generators monitoring has been asked frequently and we felt like it was something crucial missing in load testing reports. By providing monitoring metrics for every load generator during the load test, you can quickly get an overview of all load generators health.
Although we take care of the infrastructure, these information are important to the performance tester: he can quickly pinpoint if a slow down is due to its infrastructure or due to a load generator being overhelmed. These metrics are crucial for us to further tune the capacity of the machines being launched.
The following hardware usage metrics are available.
- CPU Usage (%): cpu usage per machine in percent,
- Memory Usage (%): RAM usage per machine in percent.
The following network metrics are available:
- Network received (Bytes): incoming network traffic,
- Network sent (Bytes): outgoing network traffic,
- TCP Connections Established: number of active TCP connections, typically grows with number of active users,
- TCP Segment Retransmits: TCP segments being retransmitted due to network issues.
Those metrics will greatly help to understand if load generators or the tested infrastructure have reached a bottleneck.
Automated Aggregation
Setting up many JMeter instances in different locations with proper monitoring is cumbersome. It's even more time-consuming and tiresome to collect and consolidate all JTL files.
We take care of setting up and aggregating all the metrics on our cloud platform. Our strength is to provide a live consolidated report for everything. We believe that load testing at scale should be as simple as pressing a single button.
CPU Usage
This monitoring metric shows combined CPU cores usage in percent. For example, 100% cpu usage with a quad core cpu indicates that all cpu core are fully loaded.
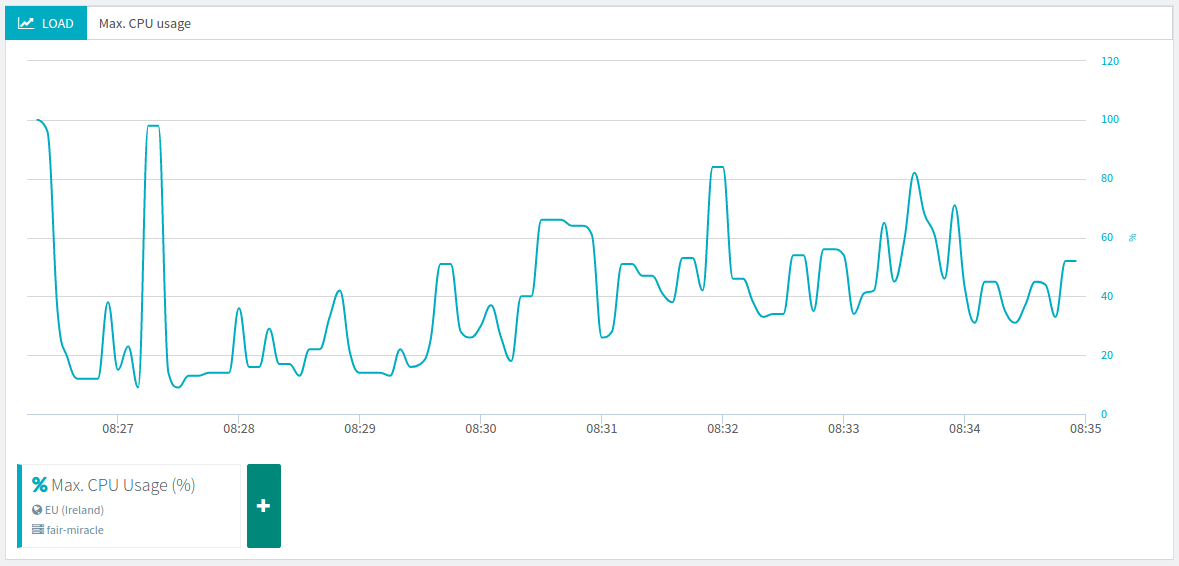
The graph above shows a decent maximum cpu usage, mostly between 50 and 60%. A CPU topping at 100% usage is not wanted.
Main Memory Usage
This monitoring metric shows how much RAM is used during the test, in percent. For example, 50% memory usage of a 16Gb RAM machine indicates that 8Gb of RAM is being used.
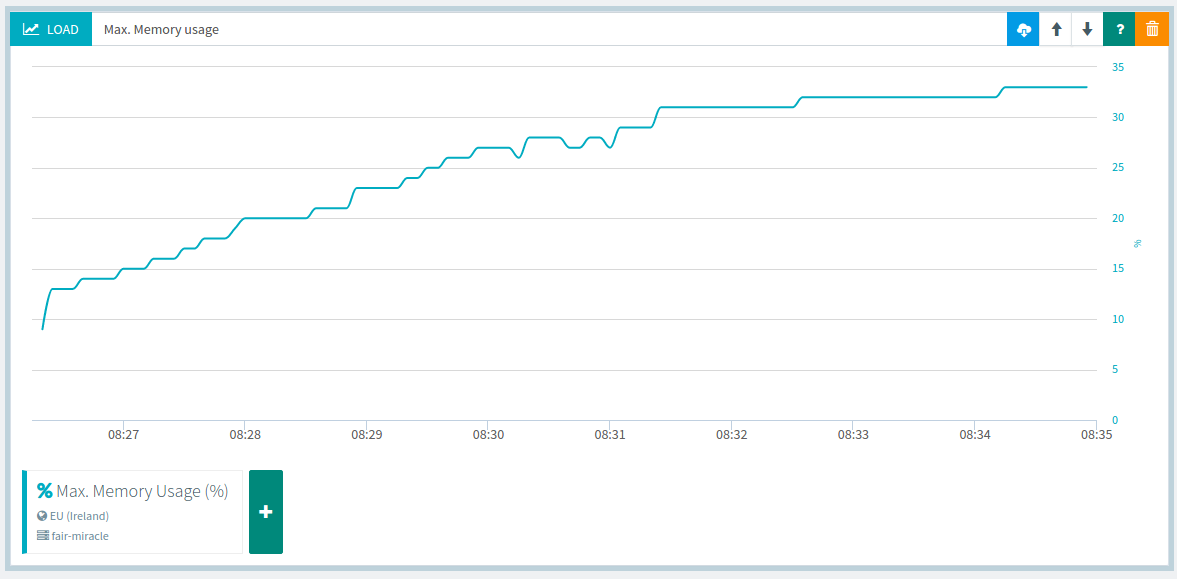
The graph above shows that no more than 30% of the load generator's main memory has been used during the test. Excessive main memory usage (above 80%) may show that the scenario being run must be tuned to fit on a larger number of machines.
Network sent and received
Network received is equivalent of inbound network traffic, also known as download bandwidth usage. Network sent is equivalent of outbound network traffic, also known as upload bandwidth usage. Being able to differentiate inbound and outbound traffic is interesting because end-users usually have high download bandwidth but poor upload bandwith.
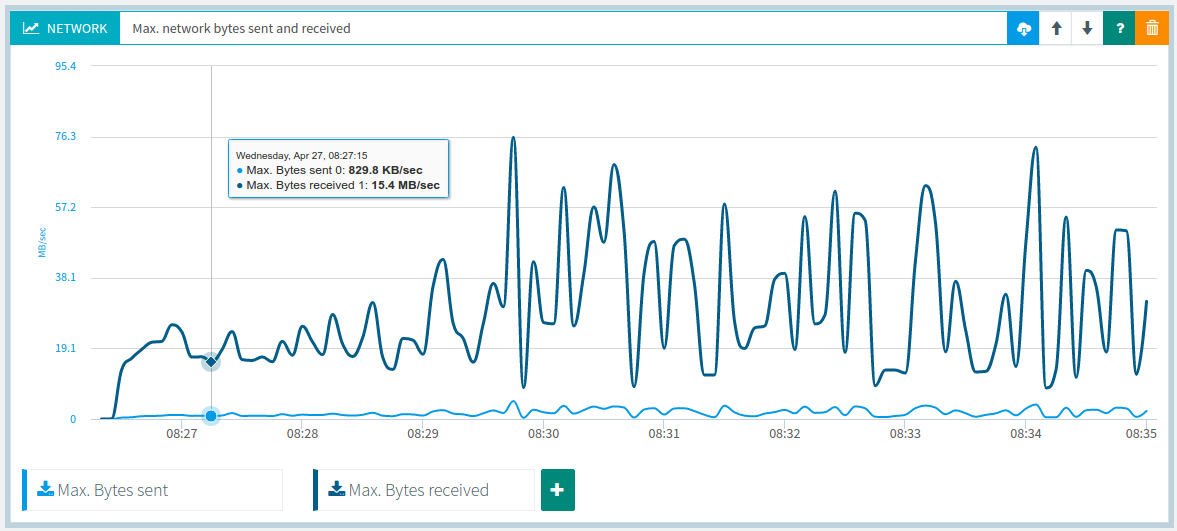
Network received is usually an order of magnitude higher than network received. Topping curves may indicates that the load generator bandwidth is fully used. Our load generators have mostly 1Gbps network connections.
TCP Connections and segments retransmits
TCP monitoring metrics are probably the most interesting ones. TCP Established connections shows the number of active TCP connections. This metric typically grows with the number of concurrent users being run. TCP Segments retransmitted shows when TCP packets had to be retransmitted due to a network issue.
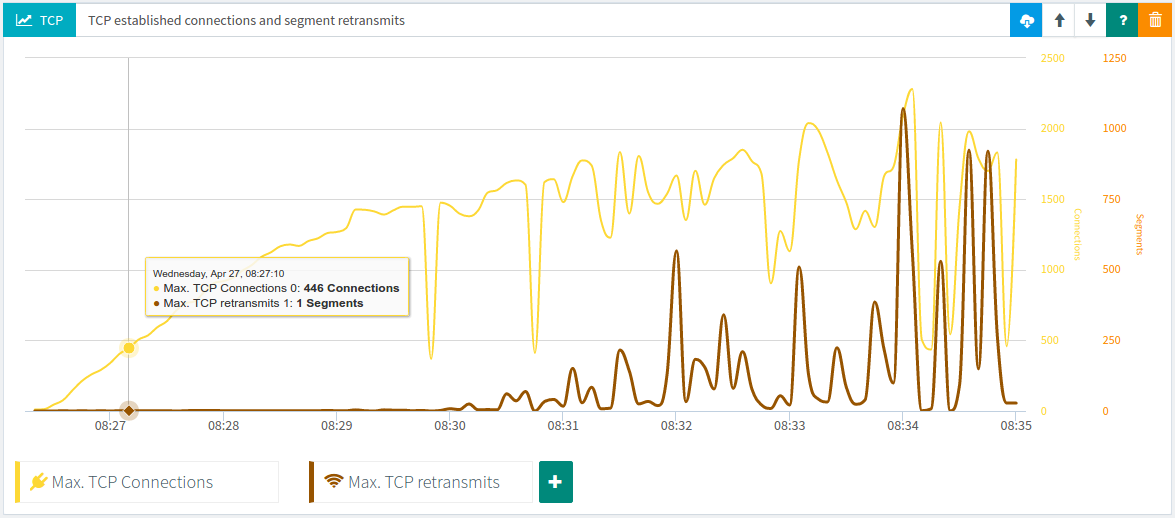
The graph above shows that TCP segments retransmitted dramatically increase in the second part of the test. This typically happens when the tested remote server cannot handle the load or has not enough bandwidth. TCP segments retransmitted should stay as low as possible.
Load Generator Filter
Every single load generator monitoring metric can be filtered to get a view of a specific instance. The default graph shows an aggregated view of all load generators.
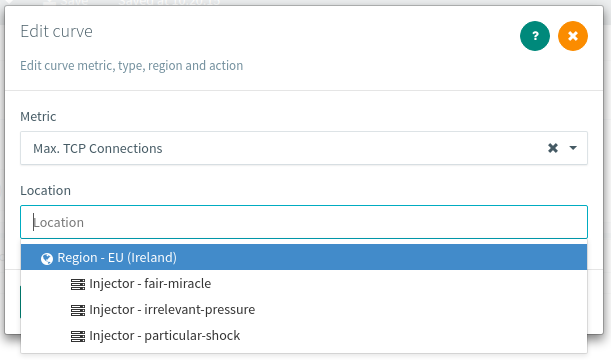
By filtering results for a specific machine, you can focus on an isolated machine monitoring metrics.
Conclusion
By understanding how the load generator behave when load testing your own infrastructure, you get a better view of the big picture. Although we take care of properly sizing the infrastructure depending on your test, those metrics can help use to improve cluster sizing in corner cases.
Performance testers are used to have those metrics available in their tests. We believe that it's worth to show anything that can help you to quickly pinpoint performance bottlenecks in your web application.
