
JMeter Properties: Configurable Test Plans
Your company probably runs JMeter test plans on a regular basis. Tests constantly need to be adjusted to change settings like concurrent users or test duration. Editing the JMX is time consuming and error prone.
It's painful, especially if you run test using Continuous Integration as part of a Shift-Left strategy. Thankfully, there is a way!
Let me guide you through all the options to design flexible JMeter test plans using configurable properties.
Why Configurable Tests
JMeter performance test plans are now commonly being executed throughout the development lifecycle as part of:
- pipelines to focus on a particular service or user journey,
- Isolated component testing as part of development activities,
- And agile Shift-Left performance testing: testing earlier during the development cycle.
But, there is added value in designing configurable tests even with traditional performance testing (like Soak Testing, Scalability Testing, Resilience Testing etc.). The key settings you usually would like to configure are:
- Threads: number of concurrent users swarming your servers,
- Ramp Up: duration between test start and peak load,
- Loop Count: number of user iterations to run,
- Duration: test duration in hours, minutes or seconds,
- Throughput: requests per second sent to the web application under test.
Being able to configure them without editing the JMX (independently from your JMeter script) will increase the flexibility of your Test Assets. One of the most powerful ways to do this is to abstract these values from your Test Plans. But, How?
Abstracting: the act of taking away or separating; withdrawal.
There are several ways to do so:
- reference variables on the command line explicitely,
- or usng properties files during JMeter test execution.
This is by no means an exhaustive list of what can be accomplished with properties but does demonstrate that their use improves the flexibility of JMeter scripts significantly.
This guide shows you how properties can do more than just control threads and duration. They can be used to control most aspects of your tests. Properties are an extremely powerful addition to your performance testing skills.
For instance, you can keep the Test Plans (Asset) separate from the Throughput (Load Profile). That means: all we need to do to manage multiple test profiles is have multiple properties files.
Let get started!
Basic Test Plan
Let's create a simple script called OctoPerf.jmx that browses the OctoPerf website:
- First, goes to the Home Page,
- then browses the Blog,
- after a while, switches to the Design page,
- and finally, hits the Pricing Page.

Let's add a BeanShell Post Processor to output the execution flow in the jmeter.log to help demonstrate how the script execution can be affected through the use of the examples in this guide.

The BeanShell will write various information like the Sampler Name, Thread Number, Start Time, Status Code, Total Threads and Iteration Number.
Let's run the test from the command line:
jmeter -n -t OctoPerf.jmx
Our output in jmeter.log shows a single user will perform 1 iteration of the test.

Command Line Properties
If we replace our basic Thread Properties values with a Simplified Property Function we now have the flexibility to change the load profile from outside of the script, our properties are:
- noThreads: number of concurrent users to execute,
- rampUp: duration (in
seconds) between test start and peak load, - lCount: total iterations count to run during the test.

Now, We can adjust the test profile from outside the Test Plan! Let's now run our test this time with these values passed from the command line by prefixing the property names with -J switch as per the JMeter User Manual.
jmeter -JnoThreads=2 -JrampUp=1 -JlCount=2 -n -t OctoPerf.jmx
Now, let's check the jmeter.log output: it shows 2 users will perform 2 iterations each, and both will start within 1 second of each other.

Great! But, can't we do better? Of course, by using a configuration file.
Simple External Properties File
Properties can also be included in a flat file which provides a further degree of flexibility, you could simply include the values in the user.properties file which is loaded when JMeter starts, here’s how:

Let's now run our test this time with these values passed into the test from the user.properties file.
jmeter -n -t OctoPerf.jmx
Our output in jmeter.log shows 3 users will perform 3 iterations each, and both will start within 2 second of each other.

The most effective and versatile way to include properties is to create your custom properties file and reference it on the command line, let's create a properties file called octoPerf.properties.

Let's run our same test with this custom properties file passed into the test from the command line using either the -p or -q command line switches, the difference being that you use -p for the first properties file and -q for any subsequent ones as stated in the JMeter User Manual, as we only have a single properties file we will use the -p switch.
jmeter -p octoPerf.properties -n -t OctoPerf.jmx
Our output in jmeter.log shows 1 user will perform 4 iterations.

Imagine, you can now have:
- a single JMX Test Plan: important settings are imported using the
${__P(propName, defaultValue)}function, - multiple properties files: depending on the type of test to run, you provide a different configuration file.
For example, you can have a single git repository containing your JMX and the configuration files. Depending on the Jenkins job running the test (with Continuous Integration), it picks a different properties file.
Additional Properties
Let us look at other ways we can benefit from abstracting data from the Test Plans to an external properties file. We are now going to use a HTTP Request Defaults Config Element to manage the URL for the site or server we are testing.

We are going to using the ${__P(propName, defaultValue)} syntax (Simplified Property Function) in the following settings:
- Protocol [http]: can be either
httporhttps, - Server Name or IP: target server to load test,
- Port Number: target server port.
Now, we can adjust the server being tested from outside the JMX.

Then, we move those settings to our custom properties file.

We now have the ability to:
- change the load profile from our properties file,
- AND change the environment against which we test.
Most big companies usually have web applications deployed in multiple environments like development, pre-production, qa. By externalizing the tested server, a single JMX can be used to test multiple environments. That's a great way to save time!
Advanced Test Plan
Let’s try to take this further and use our custom properties file to manage the execution flow of the Test Plan.
First, let's add an If Controller to the Design Page HTTP Request Sampler.

Then, we're going to use Groovy to interpret the expression:
${__groovy("${__P(executeDesignPage)}" == "true")}
And include the property executeDesignPage=false in our custom properties file.

Let's now run our test and as we have set executeDesignPage=false we see that the Design Page HTTP Request Sampler has been ignored and only the Home, Blog and Pricing HTTP Request Samplerss have been included.
jmeter -p octoPerf.properties -n -t OctoPerf.jmx

By moving these values to an external properties file we can easily control many aspects of our Test Plans without adjusting the .jmx file.
To complete this section, we are going to change the Loop Count to Forever and add a Simplified Property Function to the Duration field.
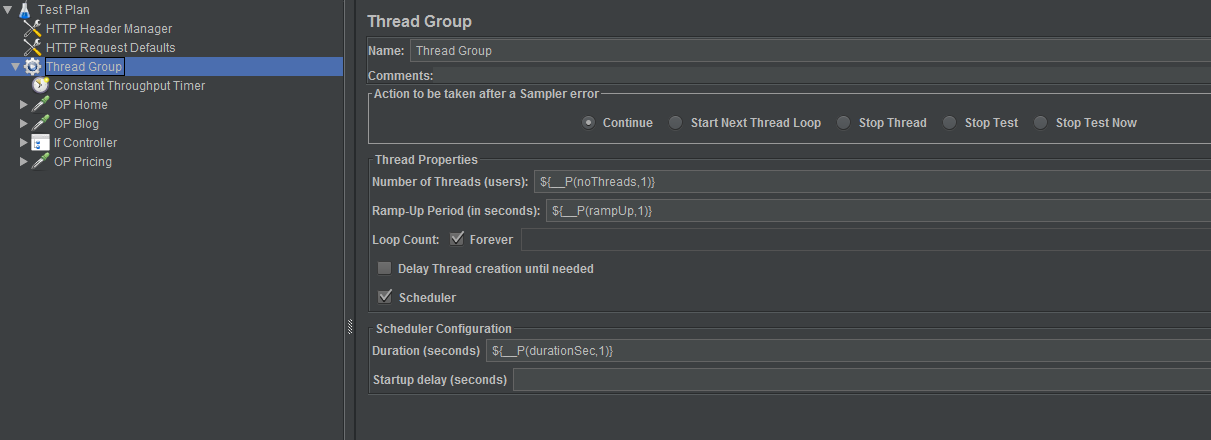
Let's also add a Constant Throughput Timer which again uses a Simplified Property Function to manage the throughput.

Let’s add these properties to our custom file

Let's now run our test
jmeter -p octoPerf.properties -n -t OctoPerf.jmx
The lCount property will be ignored and the test will run for 60 seconds and perform 8 transactions balanced across this time period.
Now we have set executeDesignPage=true we will see a single user run each of the 4 HTTP Request Samplers twice.

Now we can demonstrate that we can control duration and load in addition to our other properties.
Run Time Property Changes
Let’s consider a scalability test where we want to systematically increase load over a period of time to see how our application reacts; we can easily manage these load profiles from our external properties file which allows us to change our testing load profile during run time.
We need a BeanShell Sampler that needs to exist in its own Thread Group so it is executed independently to the Thread Group that controls the server requests.
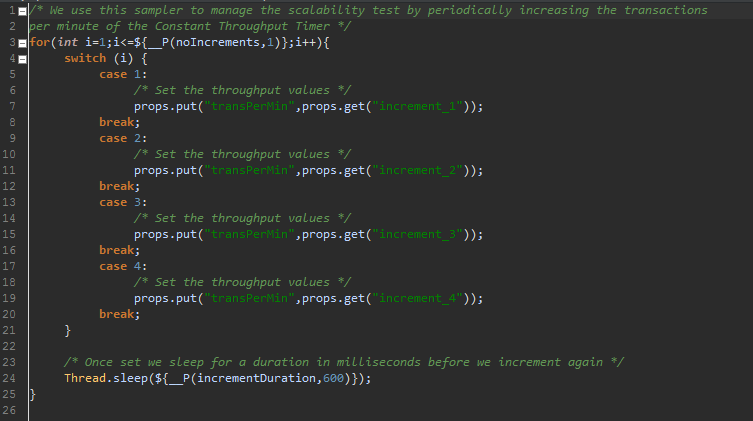
Let’s break this sampler down: we are performing a loop that is managed by a property ${__P(noIncrements,1)}, this is effectively the number of increments we wish to simulate during the test.
A switch statement is used to set the value of our transPerMin property in the Constant Throughput Timer where increment_1, increment_2, increment_3 and increment_4 overwrite the transPerMin value in the properties file.
You will need an increment_ property for each iteration so if your ${__P(noIncrements,1)} property is set to 10 you will need to include increment_1......increment_10 in your properties file.
Finally we set a time between increments Thread.sleep(${__P(incrementDuration,600)});
Let’s set these values in our properties file:
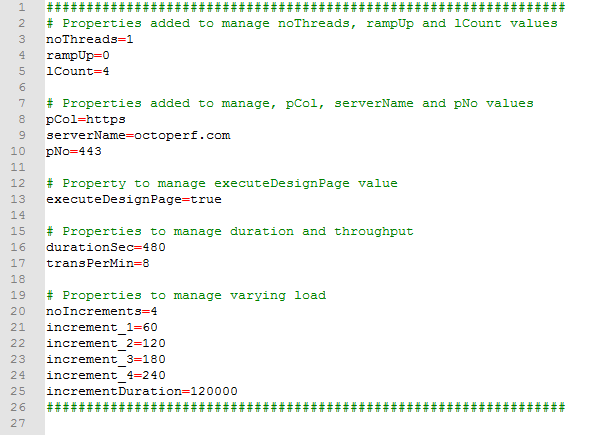
We have 4 increments, increment_1 will perform 60 requests a minute, increment_2 will perform 120 requests a minute with the third and fourth increment running at 180 and 240 requests per minute respectively.
The duration between increments will be 2 minutes which needs to be defined as milliseconds and the test duration durationSec needs to last for the full duration of the test which is 4 x 2 minutes = 480 seconds.
The Thread Group that the BeanShell Sampler is contained in uses the same parameter for Duration as the Thread Group that contains the server requests to ensure they finish at the same time.

Let's run our test; we will output the results to a flat file so we can graph the output which will make it easier to display:
jmeter -p octoPerf.properties -n -t OctoPerf.jmx -l OctoPerf.jtl
Our output shown in the Hits Per Second Graph shows us a clear increase of transaction rates every 2 minutes.

Let’s wrap the BeanShell Sampler in an If Controller as we did to the Design Page HTTP Request Sampler
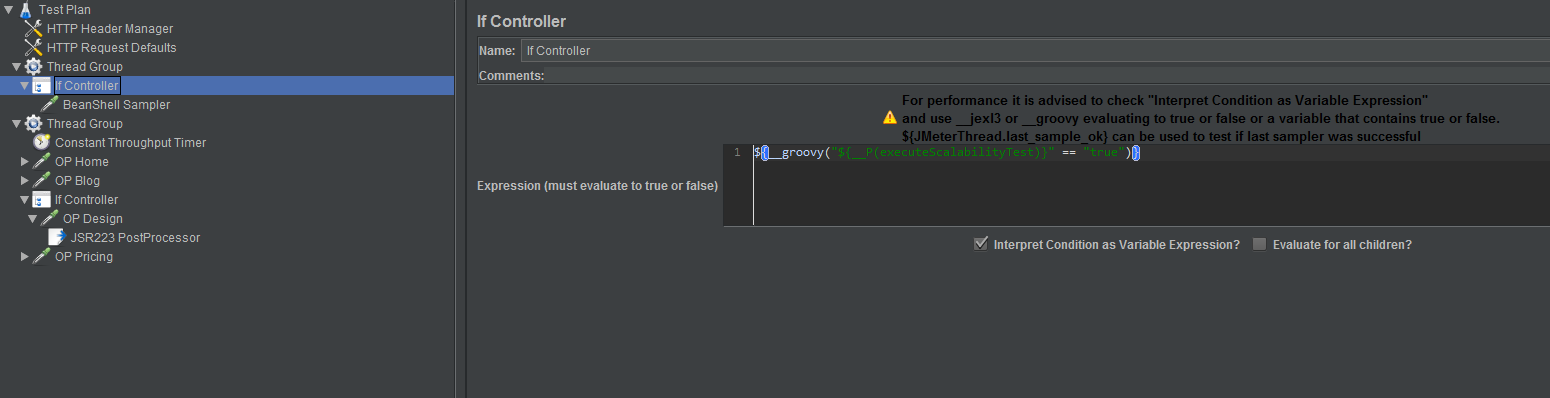
Use Groovy to interpret the expression:
${__groovy("${__P(executeScalabilityTest)}" == "true")}
Include this property in our properties file.

We now have the ability to control many aspects of our Test Plan.
Real World Benefits
Whilst data abstraction is a powerful way to ensure that your Test Plan can support multiple load profiles, against multiple environments and support multiple use journeys for any given duration it is important to define how this can be of benefit in real world examples.
Let’s take 2 custom properties files, we’ll call them:
PeakHourLoad.properties,- and
SoakTest.properties.
The PeakHourLoad.properties file:
- Runs for 3600 seconds,
- Ramps up to 100 users over 60 seconds,
- Tests the OctoPerf web site,
- Includes the Design Page HTTP Request Sampler,
- and Runs at 100 transactions per minute.

The SoakTest.properties file:
- Runs for 24 Hours,
- Ramps up to 100 users over 60 seconds,
- Tests the OctoPerf web site,
- Does not include the Design Page HTTP Request Sampler,
- Runs at 100 transactions per minute for 12 hours and then scales up to 200 transactions per minute for 12 hours.

This gives us a profile for 2 alternative tests so in order to run a Peak Hour Load Test followed by a 24 Hour Soak Test all we need to do is run our OctoPerf.jmx test with each of these properties file.
We could do this as part of a Jenkins Pipeline:
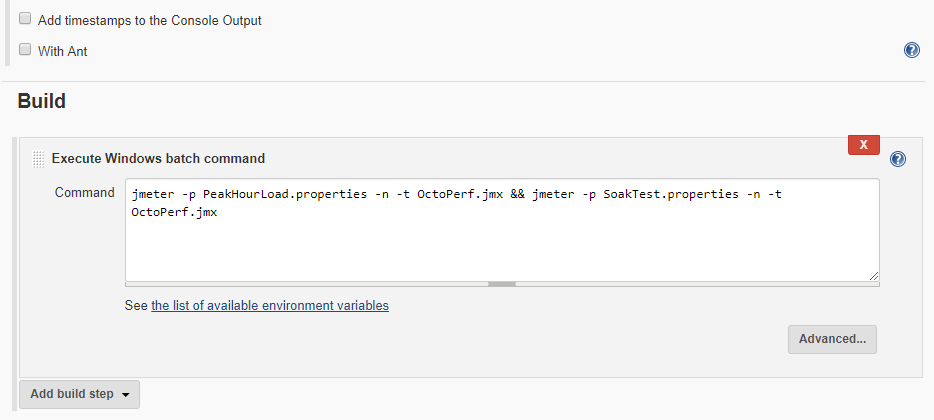
We could do this on the command line:
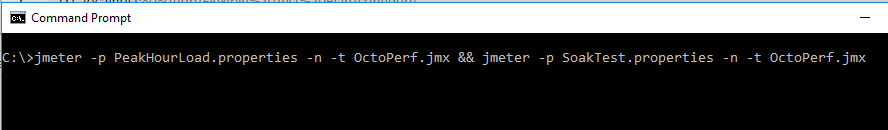

Whatever your approach you can see how easy it is to run multiple tests in succession using the same script asset but using alternative property data values.
Hopefully, this post has given you the keys to make your JMeter Test Plans much more flexible. These tips improve the productivity on JMeter and allow for a greater reuse of existing scripts.