Load testing in 5 minutes
If you know OctoPerf, you've probably figured by now that we can manage complete test scenarios from end to end along with server monitoring and configurable results. But when you put it this way it is not clear how fast OctoPerf is able to run a test. Let's take a couple of minutes today to discover how quick it can be to record and replay a script with OctoPerf.
Record from your browser
First we are going to use our public demo application: https://petstore.octoperf.com/.
The fastest way to record is to use your browser. I strongly recommend FireFox since he will save the content of responses and that might be useful later on. But if you are using chrome, note it works the same way. The best way to capture all the traffic from your application is to open a new private window (CTRL+SHIFT+P on firefox). That way you have no cache or cookies, then just press F12 and move to the network tab:
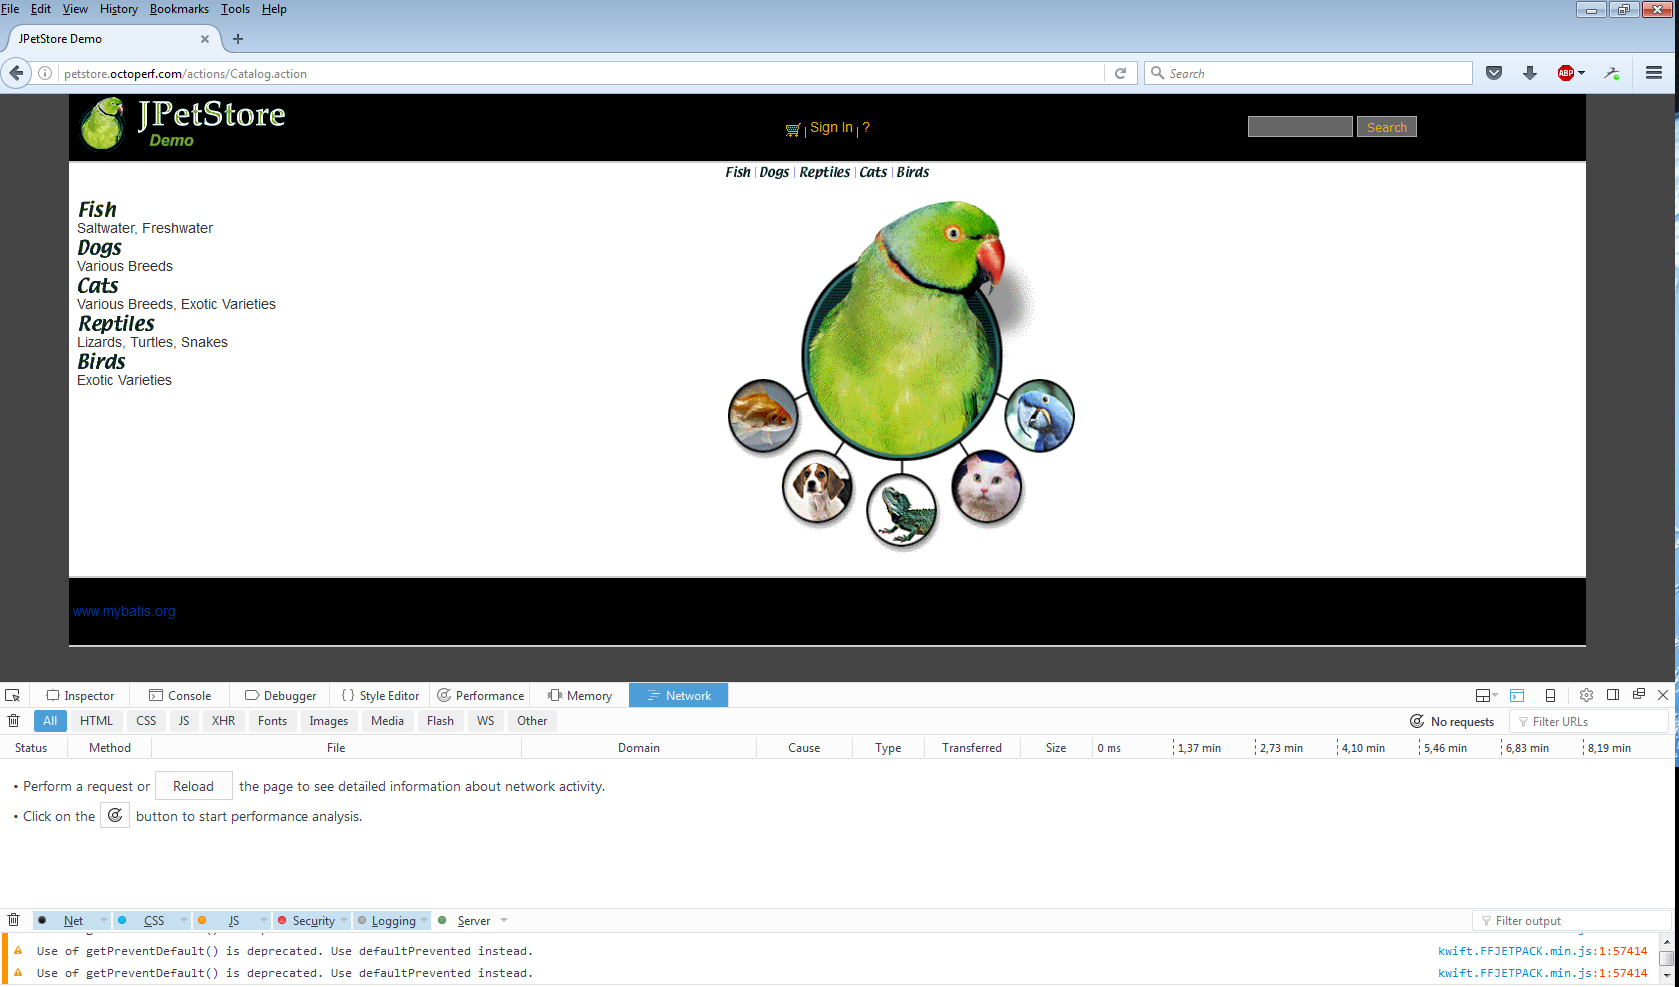
Before starting, you want to open the options (click the cog) and check "Enable persistent logs" if you want to record several URLs/Pages in a row.
Once you recorded some traffic, it should look like this:

To send this to OctoPerf, just right click anywhere in the list and select "Save all as HAR".
Import in OctoPerf
Now in OctoPerf create a new Project/user profile and on this screen:
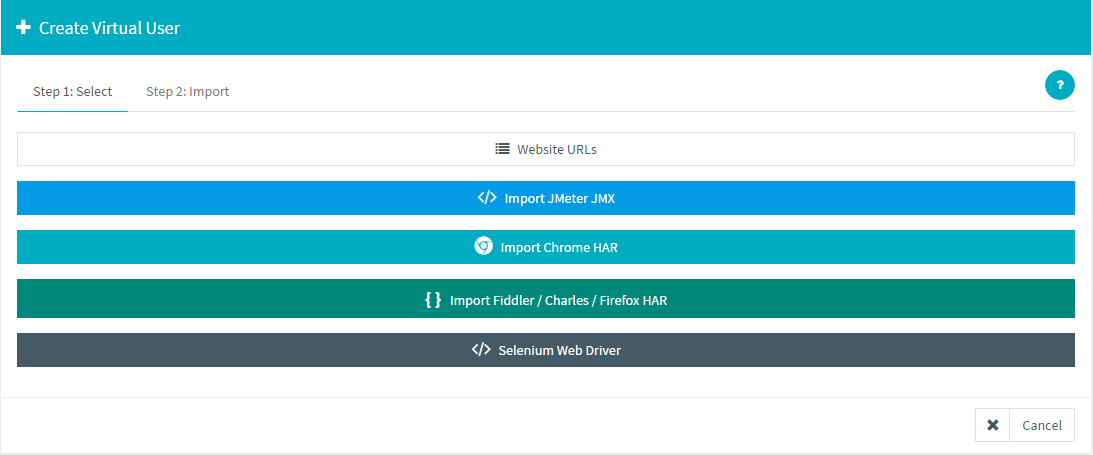
Select "Import Fiddler/Charles/Firefox HAR" and upload the HAR file you created in the previous step. Note that there is a dedicated option for chrome.
By using the appropriate option, you ensure that the transactions will be created automatically for you.
Launch a test
You can review the created user in the Design section and even rename the containers (transactions) to make the report simpler to read.
When ready, the "Create scenario" button will take you to the next step:

There, just enter the amount of users you want to run concurrently and click the launch button to run a simple 10 minutes test.
Otherwise you can take some time to configure the duration and region of the test:

Analyse the results
After about a minute, your test should be running and you will see the report screen. During the live test, you can access every information, feel free to play with the graphs and display the most relevant information for you.
I strongly recommend to look at the default "Hits and response times" graph:
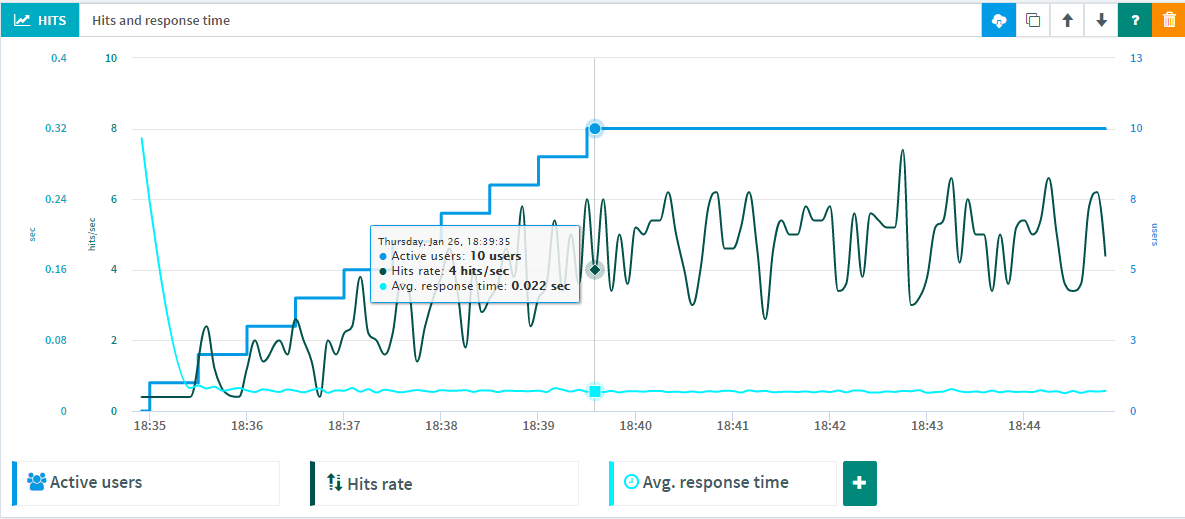
Make sure the number of hits follows the increase of the number of users, otherwise it means that the application can't handle the load anymore.
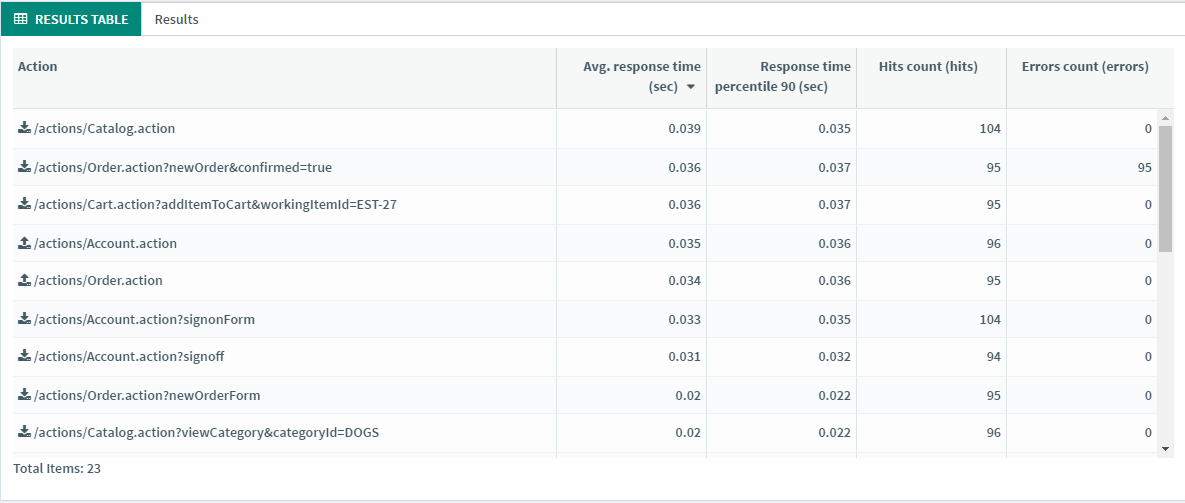
Also the "Result table" can be helpful to understand what's the response time/percentile/Error rate of every request:
Going further
Of course to get more relevant results you will need to better prepare your tests. And OctoPerf allows you to do this in a lot of different ways.
First you can import datasets, which are lists of values to be used by all your users.
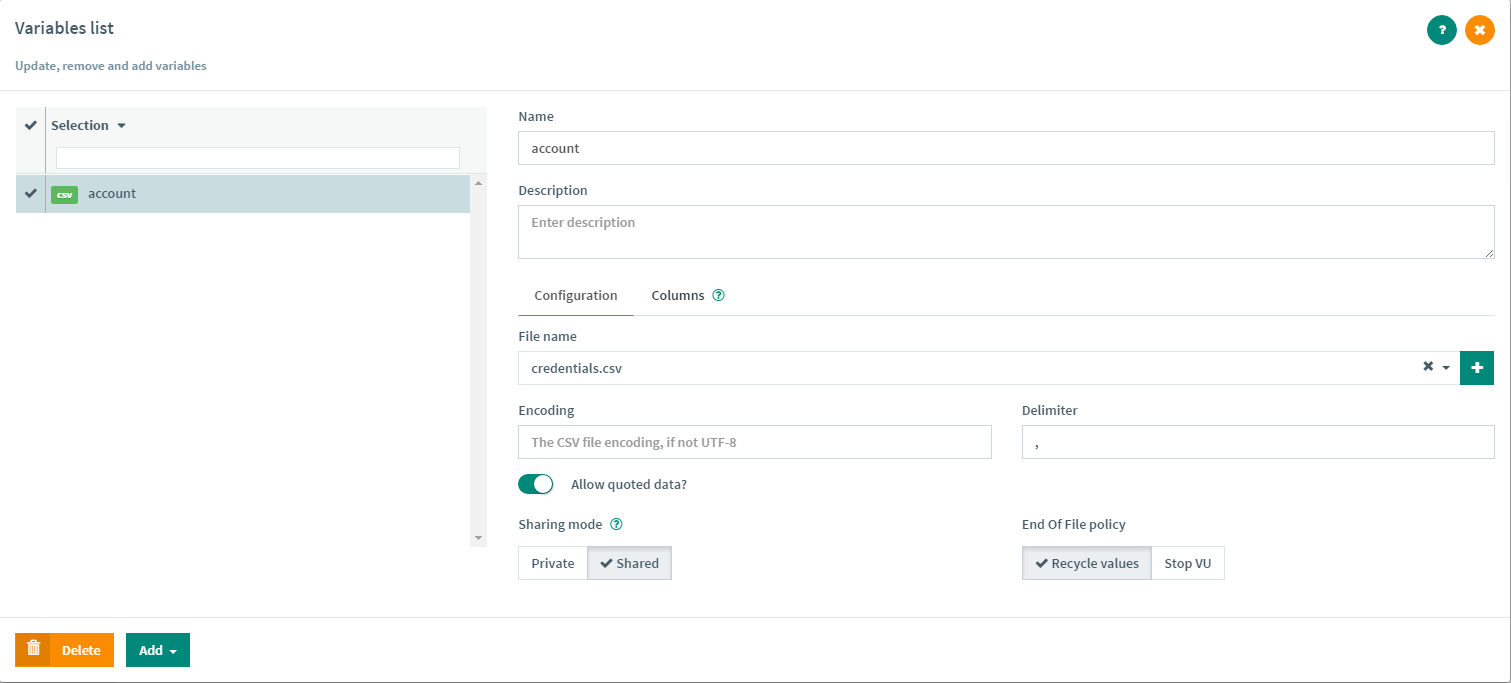
Just create a new CSV variable in the design section:
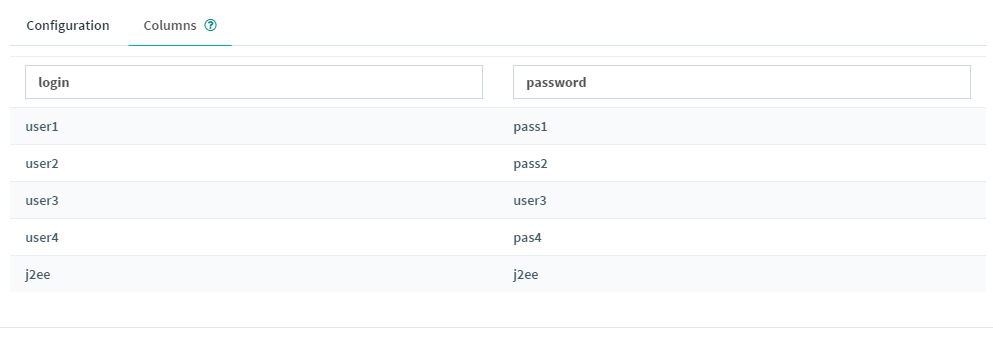
Fill in the column names in the column section:
And now you are ready to use this list of values anywhere inside your script by entering a $ sign:

Please keep in mind we barely scratched the surface of what is possible in OctoPerf through this post, but feel free to check out our video tutorials to find out more.
And keep in mind we are always happy to personally assist you, so message us on contact@octoperf.com anytime!
