Monitoring in action: Apache Httpd
This blog post is a step-by-step guide for monitoring Apache Httpd using OctoPerf. We use WordPress as a sample application.
Prerequisites
Before monitoring an infrastructure we need:
- to install WordPress using Docker,
- to configure an on-premise Host,
- and to create a virtual user that browse the different pages.
You can skip to the monitoring chapter if you are familiar with these steps or directly to the analysis to get the results.
WordPress
First we need a WordPress installed and running. As we also need Docker to install our monitoring agent, the quickest way is probably to use docker-compose.
Simply create the following docker-compose.yml file and run docker-compose up -d:
version: '2'
 services:
   db:
     image: mysql:5.7
     volumes:
       - "./.data/db:/var/lib/mysql"
     restart: always
     environment:
       MYSQL_ROOT_PASSWORD: wordpress
       MYSQL_DATABASE: wordpress
       MYSQL_USER: wordpress
       MYSQL_PASSWORD: wordpress

   wordpress:
     depends_on:
       - db
     image: wordpress:latest
     links:
       - db
     ports:
       - "8000:80"
     restart: always
     environment:
       WORDPRESS_DB_HOST: db:3306
       WORDPRESS_DB_PASSWORD: wordpress
WordPress is then available at http://localhost:8000. Open this page and configure it.
Once you reach the administration page simply create random posts which will be read by our virtual users.
On Premise Host
If you installed WordPress using Docker then creating an OctoPerf Host is pretty simple:
Create a new provider with the default region, and simply install a Host there. You basically only need to copy/paste a shell command.
The documentation is available here.
Visitor HAR
Then we also need to create a virtual user that browses the different posts we created. The easiest way is to use chrome to generate an HAR (HTTP Archive) which we will import into OctoPerf.
- Open Chrome,
- Open the console (press F12),
- Select the Network tab,
- Check "Preserve log",
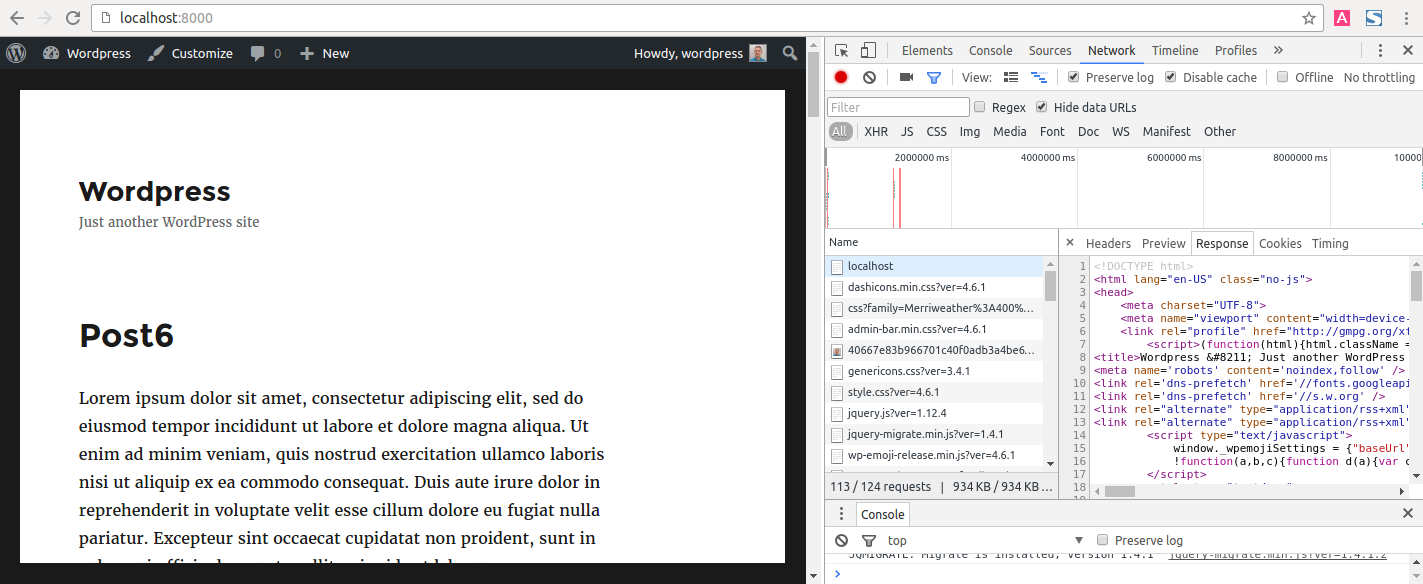
- Open http://localhost:8000,
- In the console, select this particular request (named localhost) and view its response,
- The server response must be displayed in the console (if you skip this step the recorded response won't be available in OctoPerf!),
- Open the first post by clicking on its title,
- Once again open the server HTML response in the console,
- Right click on the response and select Save as HAR with content.
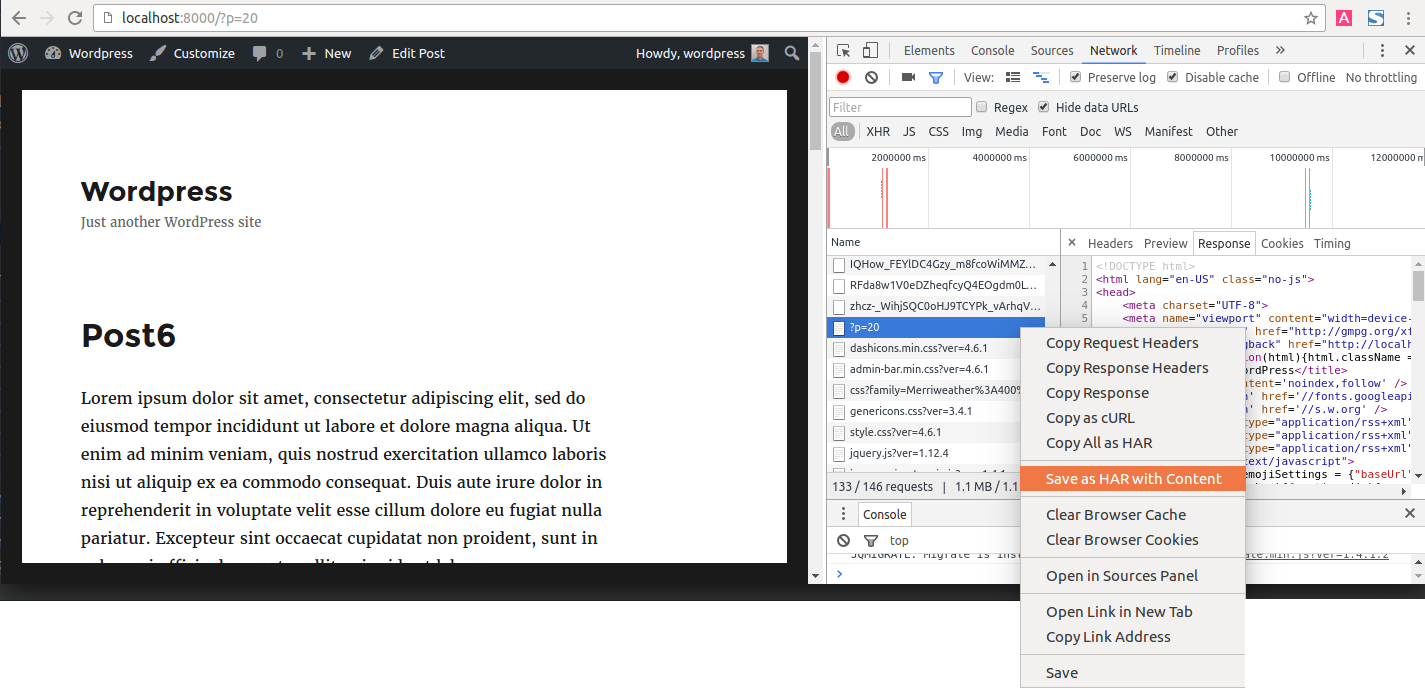
Save your HAR file, we will import it into OctoPerf.
Virtual User
Import HAR
We can now create the virtual user:
- Create a project named "WordPress",
- In the Design page, select Import Chrome / FireFox HAR,
- Drop the previously created HAR, the download starts automatically.
Then we need to do a little cleanup:
- Open the server panel,
- Remove all servers but localhost,
- Close the panel.
You now have a simple virtual user that goes to the home page and reads the first post:

Notes:
The screenshot above displays a virtual user without resources requests, but you may have more HTTP Actions.
Servers are shared among virtual users of a project, that's why we created a new project.
Assiduous Reader
Now let's create something more dynamic: an assiduous reader. We want a virtual user that visits the home page and reads each post.
The first step is to extract the links to the different posts from the home page.
- Select the home page HTTP action (the first action of the first container),
- In the left menu go to Processors and click on Regexp,
- Open the newly inserted Regexp action,
- Rename it "posts",
- Click on the Configuration tab and give focus to the panel that contains the HTML code,
- Press CTRL + F and input the title of the first blog post,
- Select the Id next to it (the 20 in
?⁼20for example).
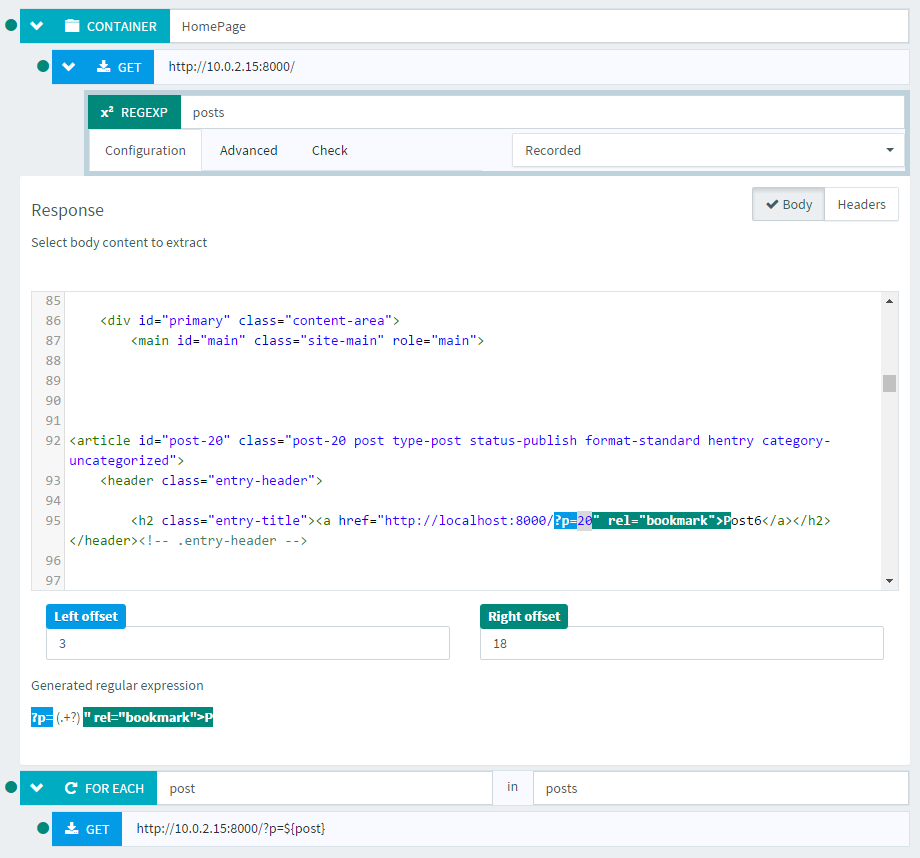
You can open the Check tab to preview the extracted value. Adjust the left and right offsets in the Configuration tab to make it only match the Ids of the blog posts. You can also extract all Ids instead of only the first one in the Advanced tab > Match Number > Select All.
Then we need to replace the second container by a For Each. Insert it from the Logic Actions menu on the left and configure it to loop over posts value and to output the current value in the "post" variable.
Finally select the blog post HTTP action (the first action of the second container), and in the URL Parameters tab replace the "p" parameter value with ${post}.
You can check that your virtual user runs fine by launching a validation. You may use your on-premise region if your WordPress is not public.
Notes:
The screenshot above display a virtual user without resources requests, but you may have more HTTP Actions.
I had to switch from localhost to my machine private IP to let my on-premise injector access WordPress.
Monitoring
Agent installation
Assuming you already have an on-premise Provider configured and a Host installed, the configuration of a monitoring agent is done in 3 simple steps:
- Open the On-Premise page (accessed using the upper right drop-down menu of the OctoPerf application),
- Click on the Create Agent button,
- A dialog appears, select the "default" zone.
And you're done! Just have to wait for the agent to start. More information in the documentation.
Apache connection
Head to the Monitoring page and click on the big Plus button to create a new monitoring connection. Your monitoring agent should be automatically selected if it's up and running.
Select Apache Httpd and during the next step fill in the IP address of your local WordPress. I.e http://10.0.2.15:8000/server-status (Don't forget the server-status path!).
Click on Check ... Surprise! It fails displaying you an error stacktrace:
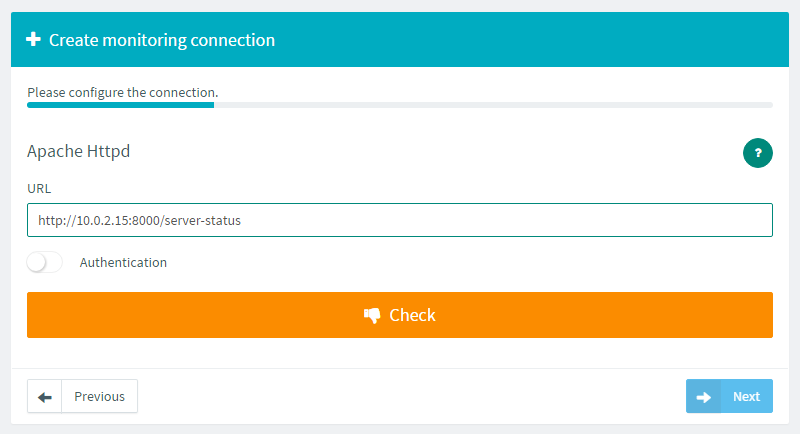
That's no big deal in fact. We simply cannot reach the Apache status page.
Apache configuration
We need to update the Apache configuration. Let's go back to our dockerized WordPress.
In a terminal type the command docker ps. It displays a result like this one:
CONTAINER ID        IMAGE                             COMMAND                  CREATED             STATUS              PORTS                              NAMES
78dec015984d        octoperf/monitoring-agent:4.3.3   "/entrypoint.sh java"    4 minutes ago       Up 4 minutes                                           r-supplementary_hat
24110c3a08f4        wordpress:latest                  "/entrypoint.sh apach"   4 hours ago         Up 4 hours          0.0.0.0:8000->80/tcp               wordpress_wordpress_1
952c0154ef4d        mysql:5.7                         "docker-entrypoint.sh"   4 hours ago         Up 4 hours          3306/tcp                           wordpress_db_1
dbacf7e31378        rancher/agent:v1.0.2              "/run.sh run"            46 hours ago        Up 5 hours                                             rancher-agent
Note:
The octoperf/monitoring-agent container is our monitoring agent. You can view its logs by typing the command
docker logs <containerId>.
The container we are looking for is the wordpress:latest.
To edit its Apache configuration, start a shell session into the container: docker exec -it <containerId> bash
The Apache configuration is located in /etc/apache2/ and we are looking for the mod status located in the mods-enabled folder.
The status module is obviously enabled but not accessible to remote hosts:
<IfModule mod_status.c>
    # Allow server status reports generated by mod_status,
    # with the URL of http://servername/server-status
    # Uncomment and change the "192.0.2.0/24" to allow access from other hosts.

    <Location /server-status>
        SetHandler server-status
        Require local
        #Require ip 192.0.2.0/24
    </Location>

    # Keep track of extended status information for each request
    ExtendedStatus On

    # Determine if mod_status displays the first 63 characters of a request or
    # the last 63, assuming the request itself is greater than 63 chars.
    # Default: Off
    #SeeRequestTail On

    <IfModule mod_proxy.c>
                # Show Proxy LoadBalancer status in mod_status
                ProxyStatus On
        </IfModule>
</IfModule>
To keep it simple, using your preferred text editor, comment the line Require local and replace it by:
    Order deny,allow
    Allow from all
Finally restart Apache: /etc/init.d/apache2 restart
Notes:
Vim was not installed by default so I had to type the commands
apt-get updateandapt-get install vim.You may use more restrictive access to the server-status page.
You might also need to edit the mod_rewrite configuration in the
/var/www/html/.htaccessfile:Completely deactivating it# BEGIN WordPress <IfModule mod_rewrite.c> RewriteEngine On RewriteBase / RewriteRule ^index\.php$ - [L] RewriteCond %{REQUEST_FILENAME} !-f RewriteCond %{REQUEST_FILENAME} !-d # rewrite rule for server-status to prevent 404 error RewriteCond %{REQUEST_URI} !=/server-status RewriteRule . /index.php [L] </IfModule> # END WordPressRewriteEngine Offalso works fine for our simple test.
Status page
If you open the server status page on http://localhost:8000/server-status/ you should see the monitoring metrics exposed by Apache Httpd:
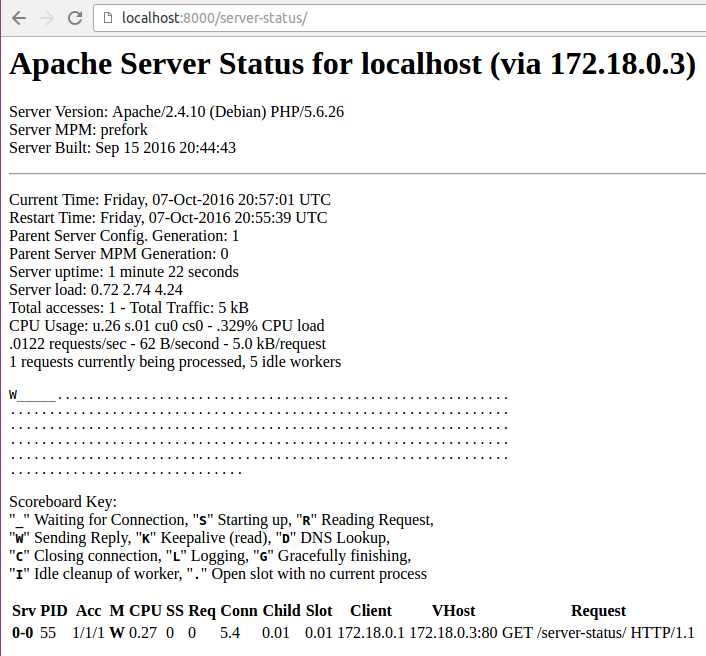
The bottom of the page displays the list of the current request workers. Basically each request worker is a thread used to serve clients. That's what we are going to monitor while load testing WordPress.
Successful check
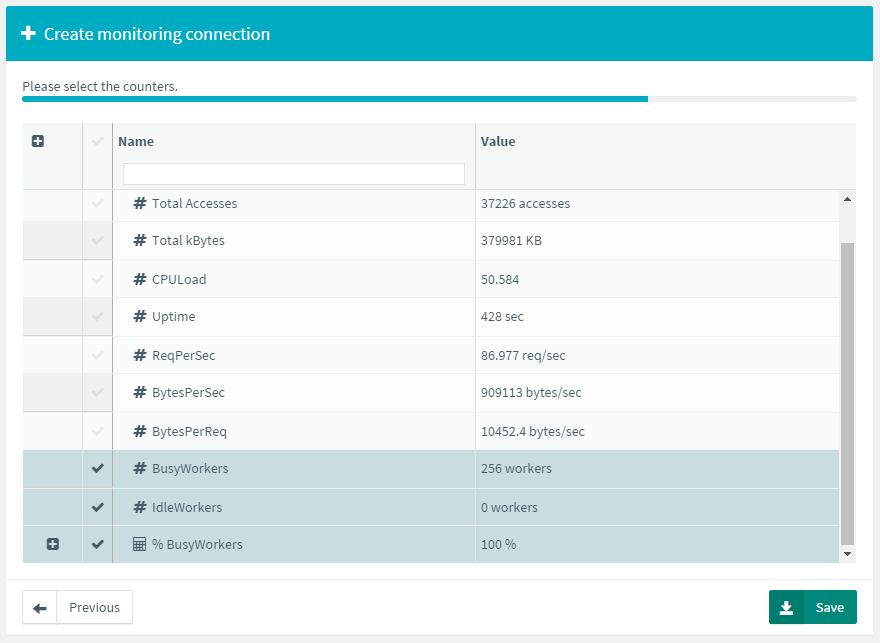
Now if you go back to the OctoPerf application and click on Check again, it should run fine. Click on Next and use the pre-selected counters.
Connection configuration
Once the monitoring connection is configured, your are automatically redirected to the edition page. Let's add a new threshold alarm to the Busy Workers percentage:
- Select the % BusyWorkers counter (the last one),
- In the left menu, click on Connection Items > Threshold,
- A threshold alarm is added to the last monitoring counter,
- Rename it to Critical Busy Workers and configure it as shown below:
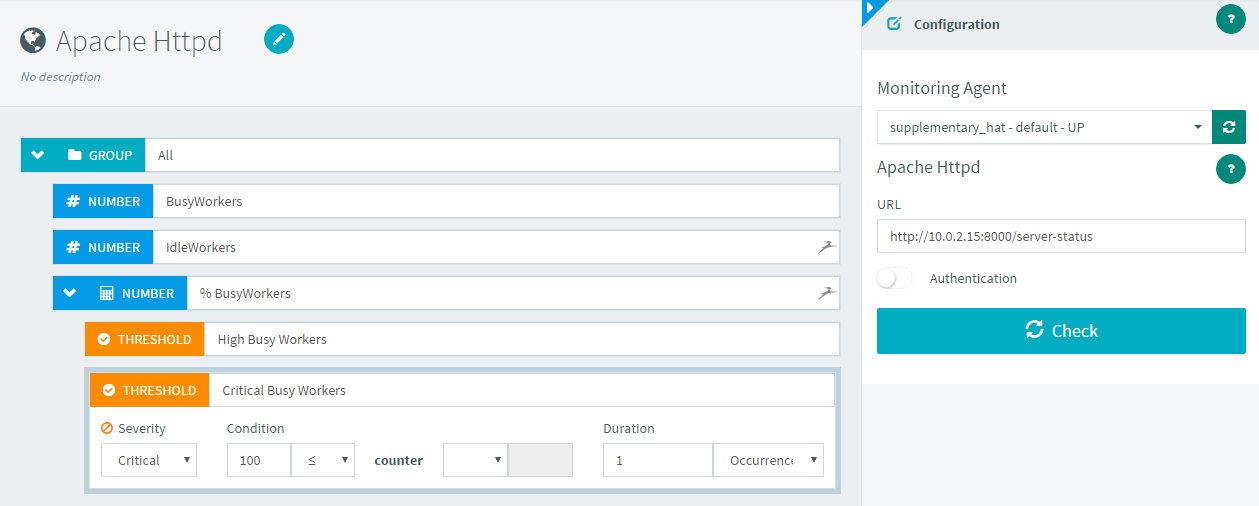
You also need to edit the configuration of the High Busy Workers threshold: Add an upper bound < 100 to avoid triggering both alarms at the same time.
Launching a load test
Open the "Assiduous Reader" virtual user and click on the Create Scenario button. A load test scenario is created an you are redirected to the runtime page:
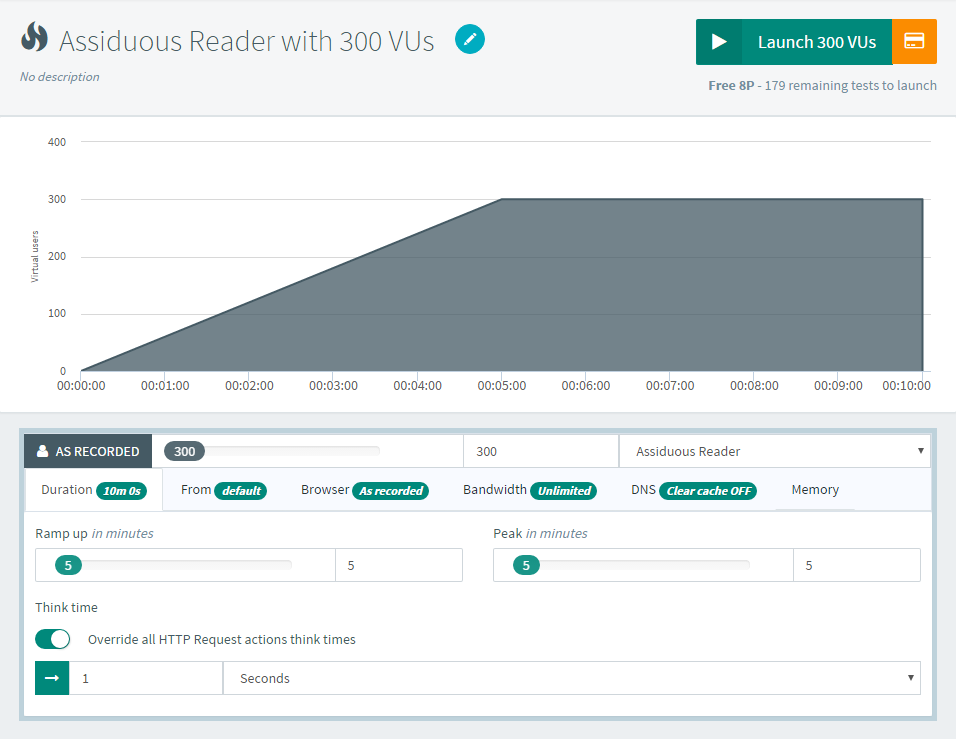
Configure the default user profile to 300 concurrent users during 10 minutes (5minutes ramp up, 5 minutes peak).
Our visitor is not only assiduous but also very fast! So lets override the think times to 1 seconds:
- Select the user profile,
- Open the Duration tab,
- Select Override all HTTP Request actions think times,
- Type in 1 and select Seconds (it should be the default value).
If you are using a private WordPress and an on-premise load generator, don't forget to select the default region in the From tab.
Click on the Launch 300 VUs button to release a regiment of assiduous readers onto our WordPress blog!
Analysis
Now it's time to see if our Apache Httpd can handle 300 concurrent users (almost 300 requests/second because we overrode think times to 1 second). We are also going to tune it to improve its performances under load.
Note:
The Apache Httpd installed via Docker/WordPress is pre-configured to use the mpm_prefork module. The settings described here are only valid for this module and won't work with Worker or Event ones.
First test: Workers Overload
When the load test is started, drop a new monitoring chart: In the left menu select Monitoring > Apache Httpd.
Edit its configuration to display:
- the Monitoring metric Busy Workers counter,
- the Apache Httpd connection % Busy Workers counter (this one comes with thresholds that are displayed in the graph),
- the Hit metric Active Users,
- and the Hit metric Avg. Response Time.
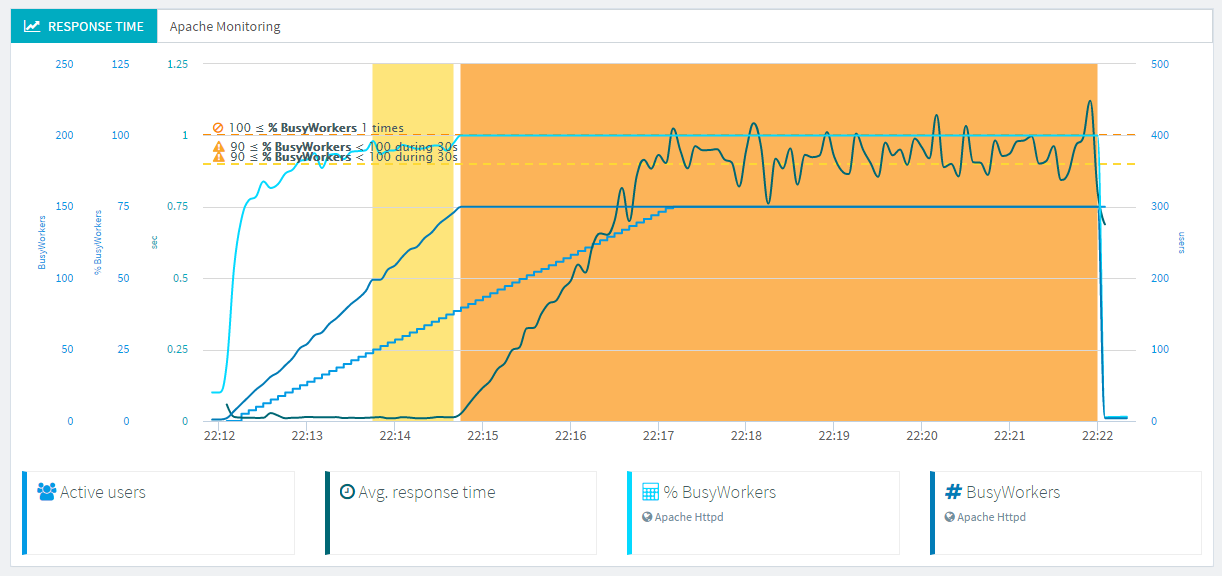
We can see that the busy workers do not go above 150. The busy workers percentage also quickly raises the High Busy Workers threshold alarm, displaying a yellow area on the chart. When the busy workers reach their max value (150), the Critical Busy Workers alarm is raised, displaying the orange area.
At this point the average response time progressively increases to reach 1 second. So our Apache workers configuration might be the cause of our slow response times.
Let's check it out!
Second test, second bottleneck!
Restart a shell session into your WordPress container: docker exec -it <containerId> bash
The Apache Httpd modules configuration folder is /etc/apache2/mods-enabled. Let's check out the PreFork configuration: more mpm_prefork.conf
# prefork MPM
# StartServers: number of server processes to start
# MinSpareServers: minimum number of server processes which are kept spare
# MaxSpareServers: maximum number of server processes which are kept spare
# MaxRequestWorkers: maximum number of server processes allowed to start
# MaxConnectionsPerChild: maximum number of requests a server process serves

<IfModule mpm_prefork_module>
    StartServers             5
    MinSpareServers          5
    MaxSpareServers          10
    MaxRequestWorkers        150
    MaxConnectionsPerChild   0
</IfModule>
Indeed, our MaxRequestWorkers is configured to 150! Set it to 350 and restart Apache.
Launch a new load test using the previous scenario (300 concurrent users during 10 minutes), and create the same chart with busy workers, active users and average response time:
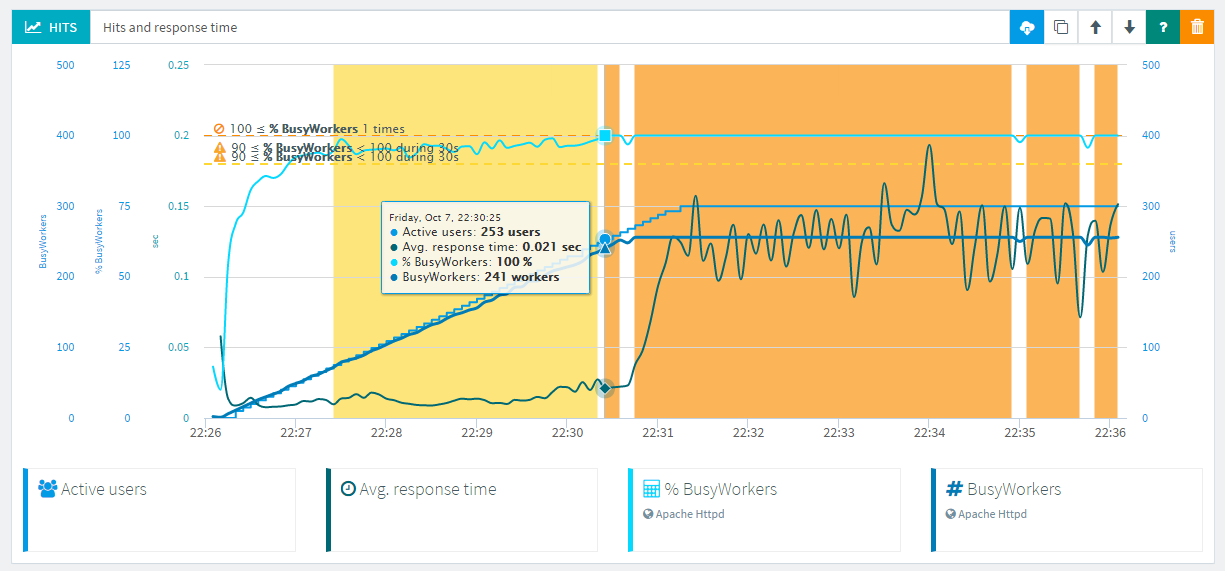
We can now simulate about 250 virtual users before the response times begin to increase. We should be able to reach 300 concurrent users so there is another performance issue.
Third test: server limit
If we take a look at the documentation we can see that:
- to increase MaxRequestWorkers to a value that requires more than 16 processes, you must also raise ServerLimit,
- the default ServerLimit value is 256.
So the Server Limit is a good suspect for our performance bottleneck.
Edit the file /etc/apache2/mods-enabled/mpm_prefork.conf and set the following configuration:
<IfModule mpm_prefork_module>
        StartServers              5
        MinSpareServers           5
        MaxSpareServers           10
        MaxRequestWorkers         350
        ServerLimit               350
        MaxConnectionsPerChild    0
</IfModule>
Restart the load test and create the Apache Httpd monitoring chart:
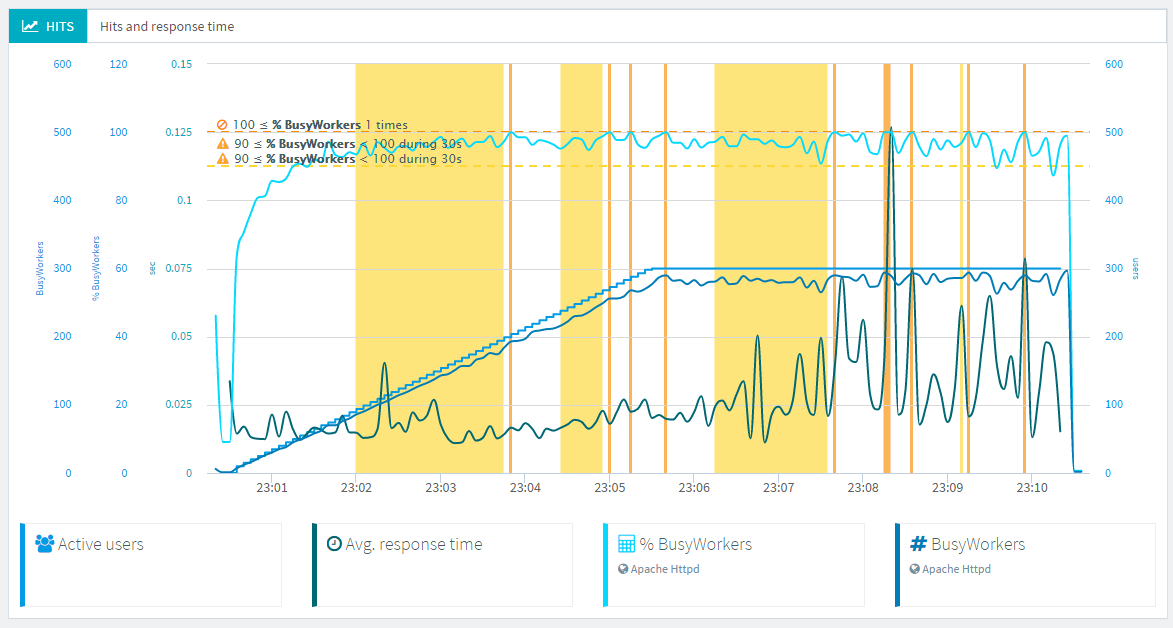
We can now reach 300 concurrent users and keep a response time of 50ms. But we often raise the 100% busy workers alarm. Let's try to fix that.
Fourth test: spare servers
Edit the PreFork configuration file to adjust the start, min and max spare servers values (don't forget to restart Apache when it's done):
<IfModule mpm_prefork_module>
        StartServers              50
        MinSpareServers           50
        MaxSpareServers           100
        MaxRequestWorkers         350
        ServerLimit               350
        MaxConnectionsPerChild    0
</IfModule>
This way we can have more idle threads, waiting for an eventual rush of virtual users. Open the server status page http://localhost:8000/server-status/:
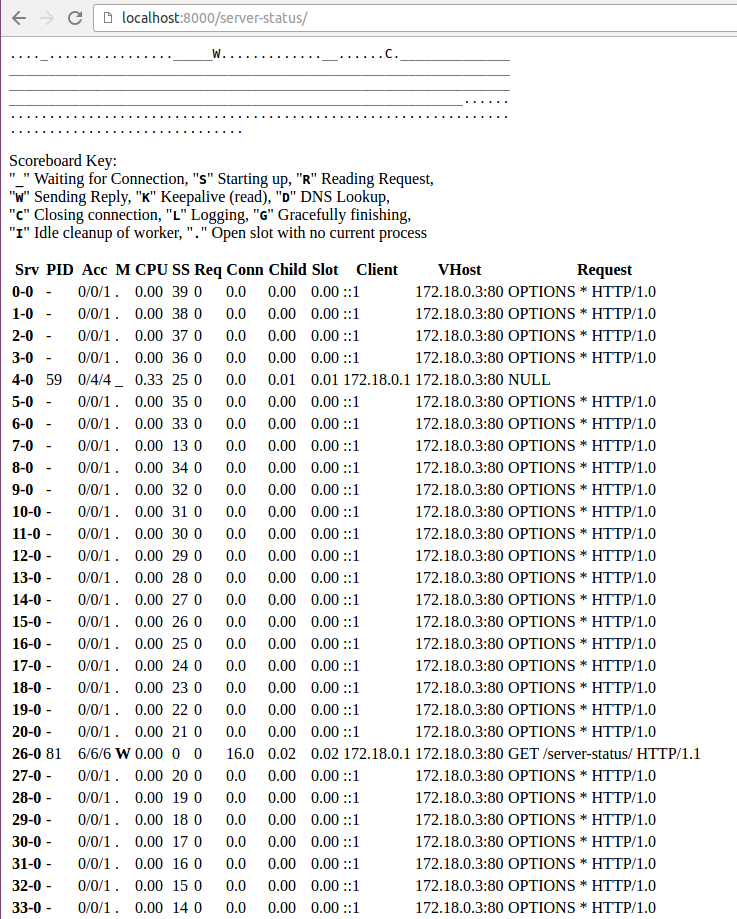
As you can see at the bottom of the screen, multiple servers are started even though there is not any user on the WordPress blog.
Restart the load test and check our Apache behavior under load:
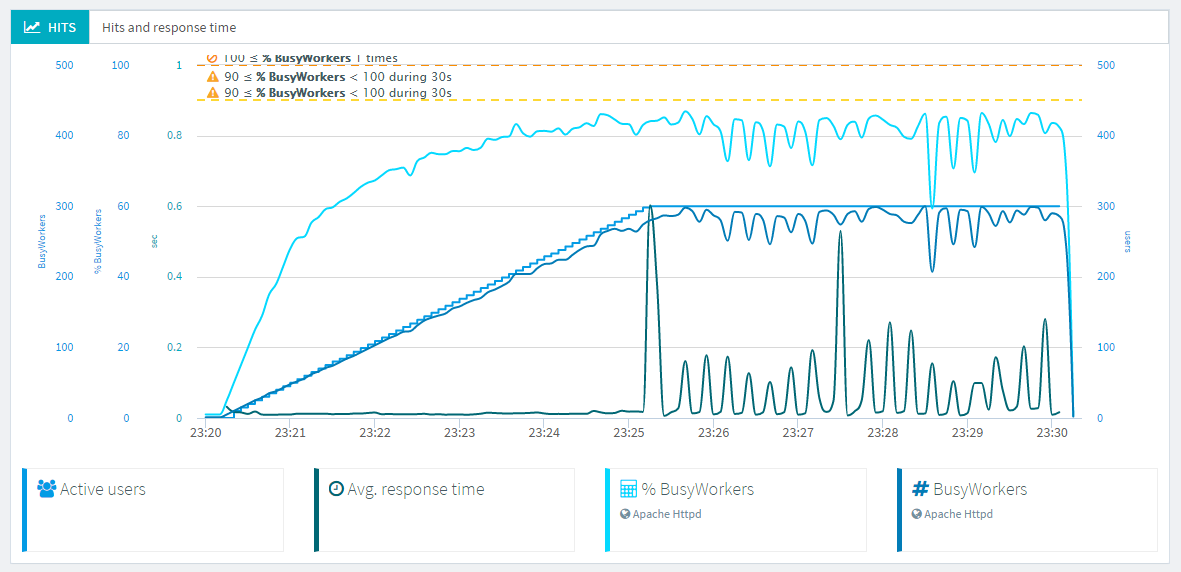
No more alarm raised! But the response times are a bit inconsistent: they go up to 200ms each time the busy workers go down. Apache might be slower to answer when it frees some of its workers. So our latest changes to the PreFork configuration may be the cause of this performance issue.
Last performance test
Once again, edit the PreFork configuration file, using just the right amount of spare servers we need:
<IfModule mpm_prefork_module>
        StartServers              5
        MinSpareServers           30
        MaxSpareServers           40
        MaxRequestWorkers         350
        ServerLimit               350
        MaxConnectionsPerChild    0
</IfModule>
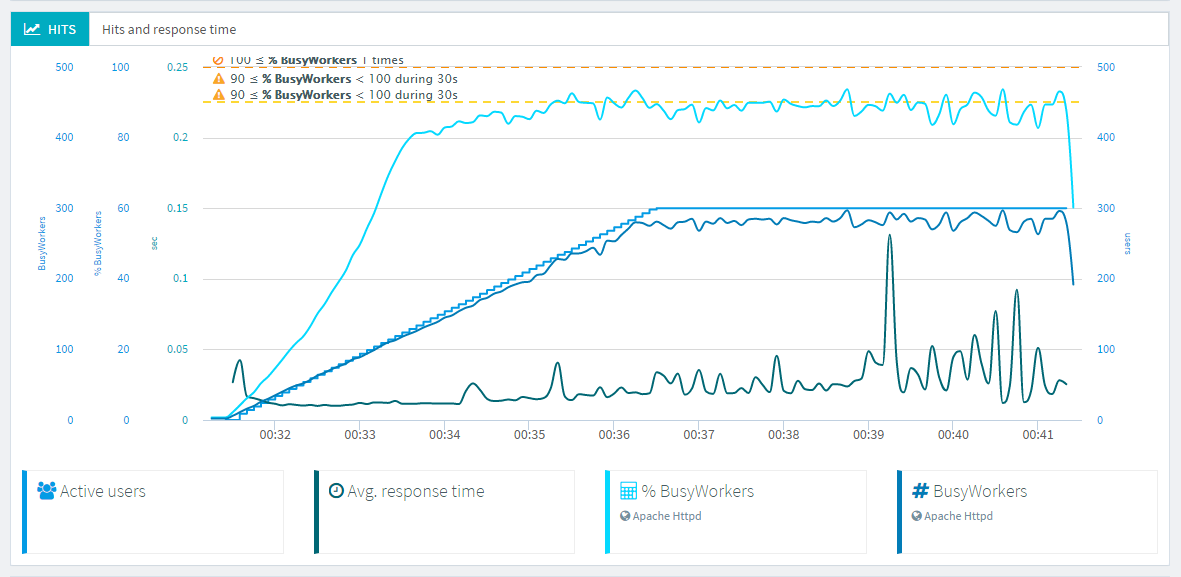
Nice! Our responses times are about 50ms and the busy workers stay bellow 90%. Setting configuration limits to much higher values than necessary might have counter productive effects.
And monitoring your infrastructure is the only way to define proper performance settings.
Conclusion
OctoPerf's monitoring let us quickly identify the cause of a performance issue. But it's also a good way to see the effects, in details, of configuration tuning.
