OctoPerf 10.4.0 - Better Insights on Errors
We've received a lot of feedback around the way we report errors during the tests. First we only stored the first 100 errors per load generator to avoid having too many. And because of this, many of you were not able to analyse issue happening after a while. This can be frustrating if you want to understand what's going on at that stage. That's the reason behind the two main features of this release:
Improvements
Area chart
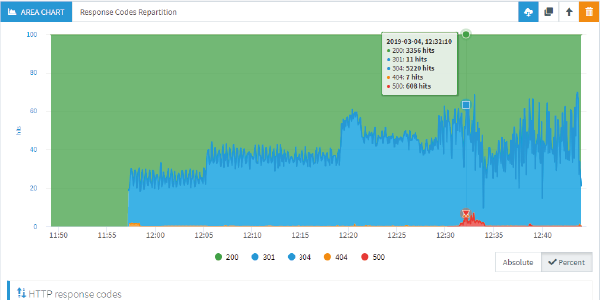
It does not only work for errors but it's probably going to be the main use case. This new addition to the report items family will show the percentage/count of the various HTTP/S codes over time:
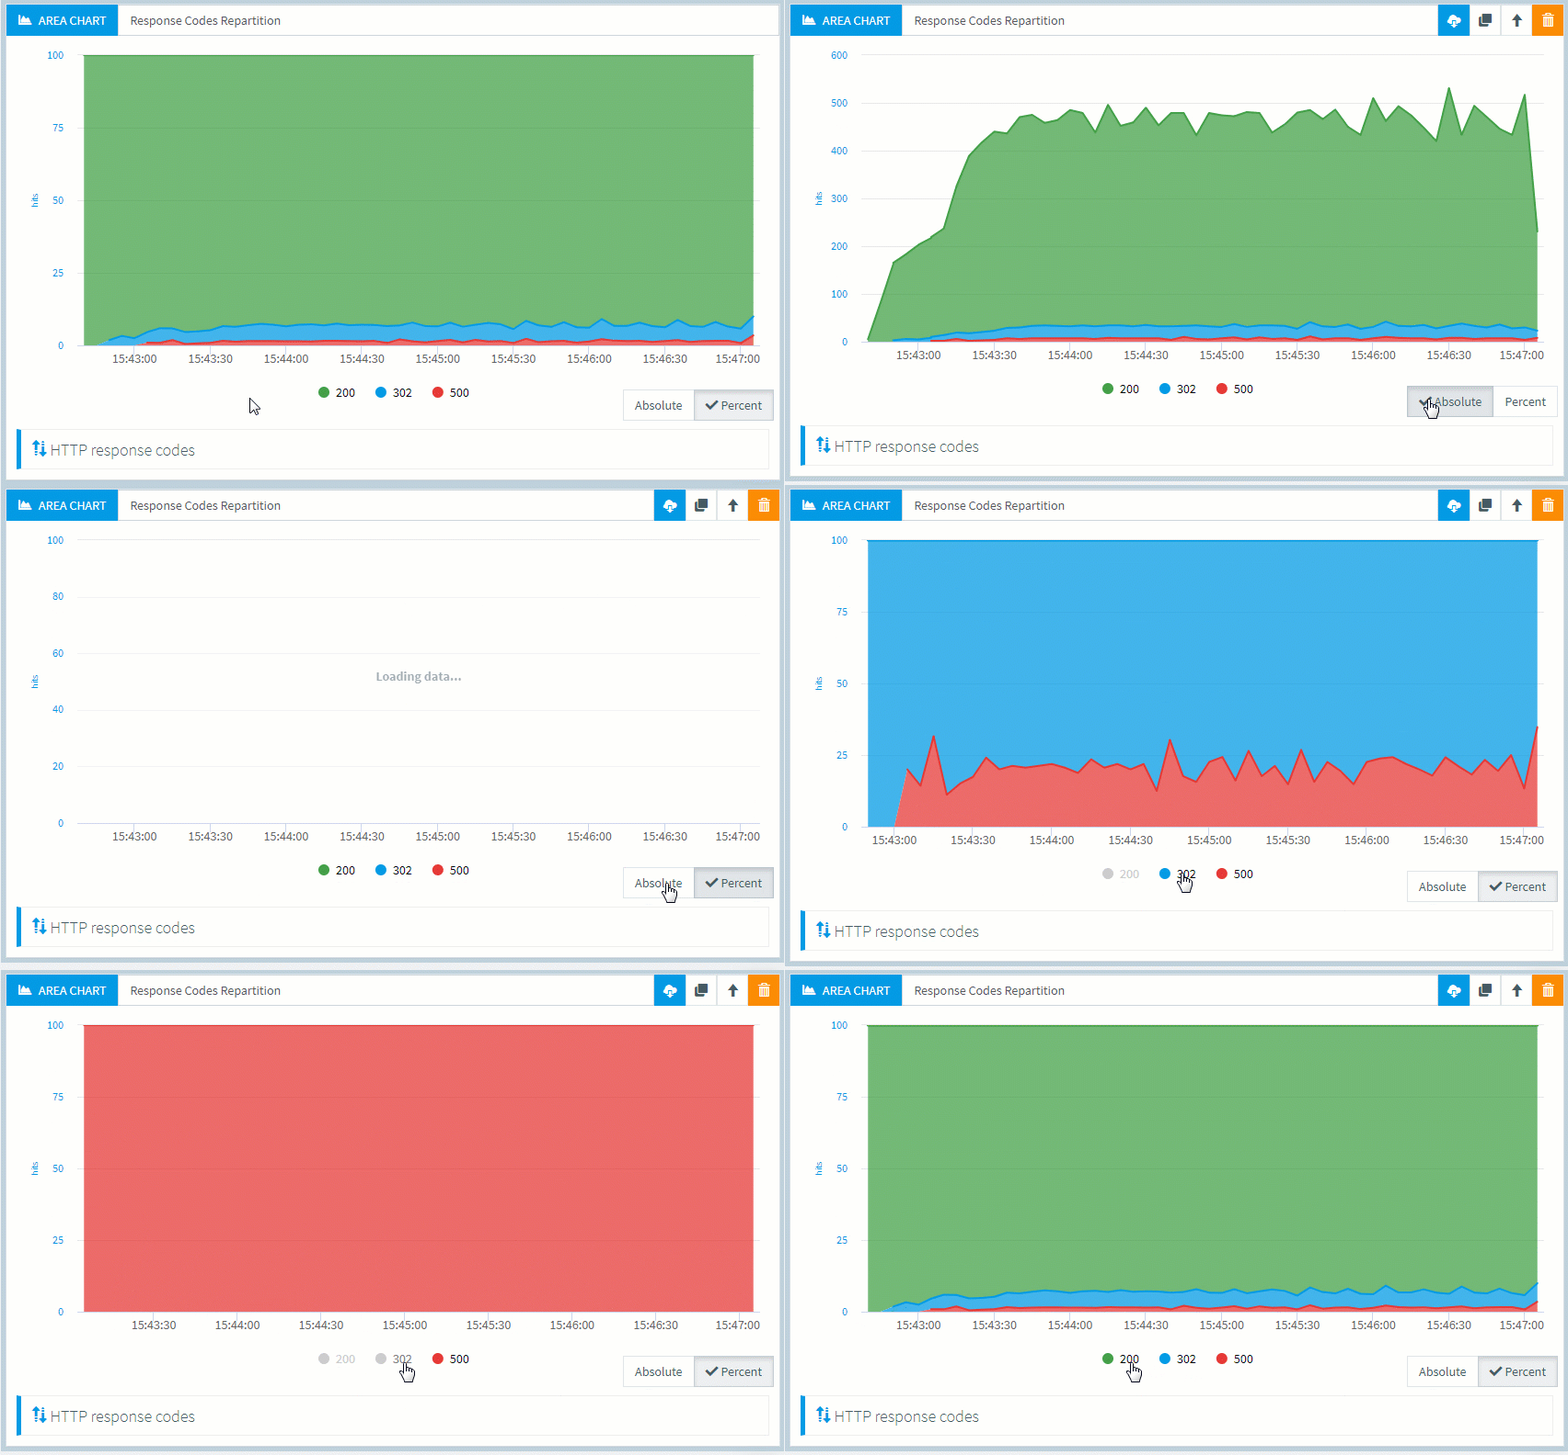
It makes it easier to understand what's going on when the error rate changes during the test. Or if you suddenly have more or less 304, there might be something related to the cache. And you can use it for content-types as well. The names on top of the legend are clickable so that you can easily remove one metric from display.
Error details storage
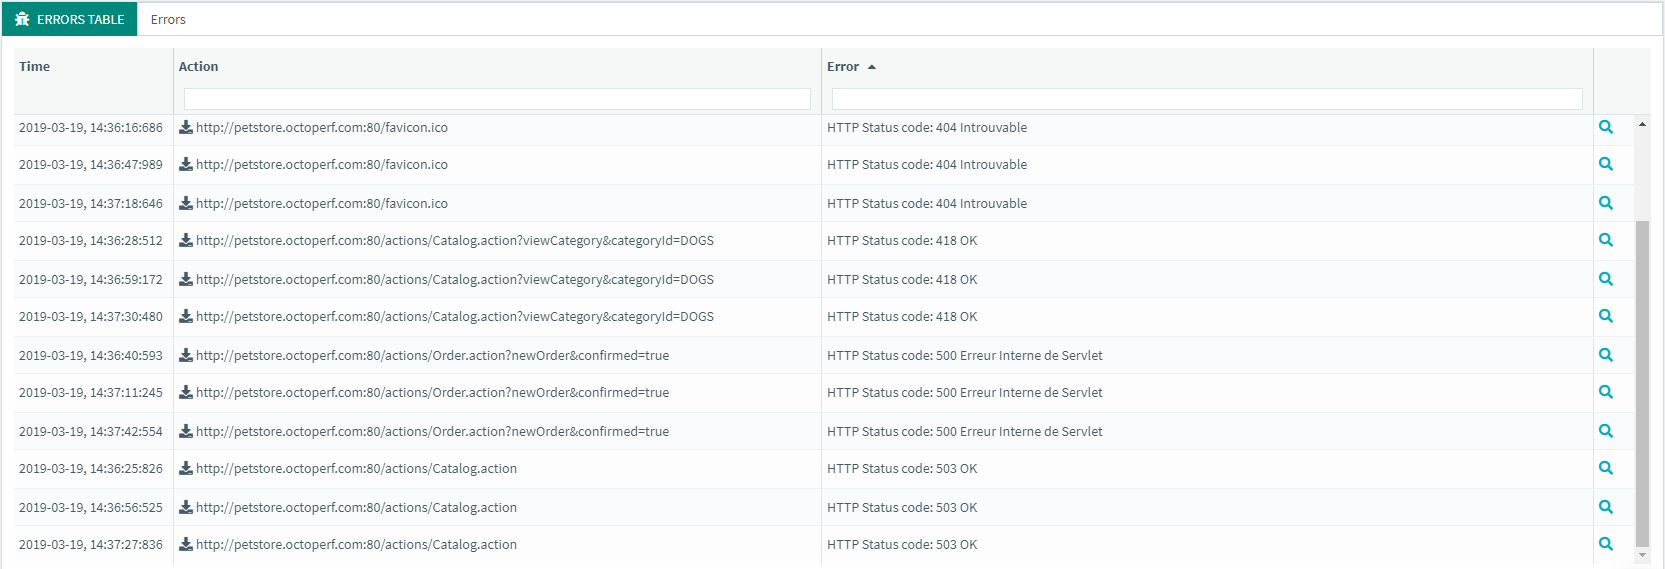
As I said earlier, we used to store error details only for the first 100 errors per load generator. That's perfectly enough for most situations but when a new error code appears later on it might not be stored if the limit was reached earlier. Instead we now store the first 3 error details per couple of (request + error code).
There's still a maximum which has been increased to 1000 per load generator. But now you should be able to see at least a few of each of the errors occuring during your test.
JMeter 5.1.1

We also updated our agents to JMeter 5.1.1 after the upgrade to Jmeter 5.1 a few weeks ago. That way you can benefit from the latest features and fixes automatically.
Improve Post Processors Import
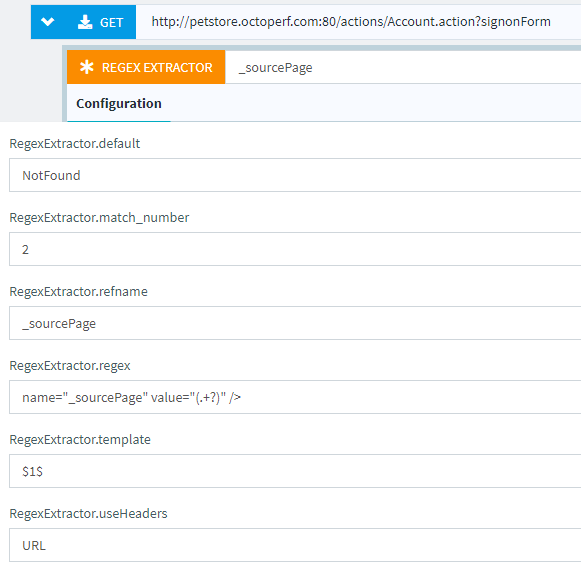
Since we have our own way to deal with some post processors a few configurations were discarded when importing. This is now fixed since we treat these use cases as a generic action, for example with a regexp that extract from the URLs:
But we've also implemented a few others situations. This brings OctoPerf ever closer to 100% JMeter coverage, while our UI still adds our cool features on top of it.
Ignore Specific Response Code
As an effort to make the error list even easier to exploit, we also allow to add a global pre or post processor. This was possible when importing from Jmeter but restricted from our UI, now it is not anymore. A script like this one will ignore all the error response codes based on a runtime property:
final String prop = props.get("filterErrors");
final boolean isFilterErrors = prop == null ? true : Boolean.valueOf(prop);

if (isFilterErrors) {
  int responseCode = 200;

  try {
    responseCode = Integer.parseInt(prev.getResponseCode());
  } catch (final NumberFormatException e) {
    // Ignore
  }

  if (responseCode >= 400 && responseCode < 500) {
    prev.setResponseOK();
  }
}
This script can be enabled / disabled live during the test via JMeter property filterErrors.
Its possible values are:
falseto disable ignoring errors,trueto ignore certain errors again.
Api Testing Improvement
When running API tests, it was difficult to work with the simple text editor we propose for raw POST requests. That's why we improved it with new formats supported. This will not only color the syntax of you payload:
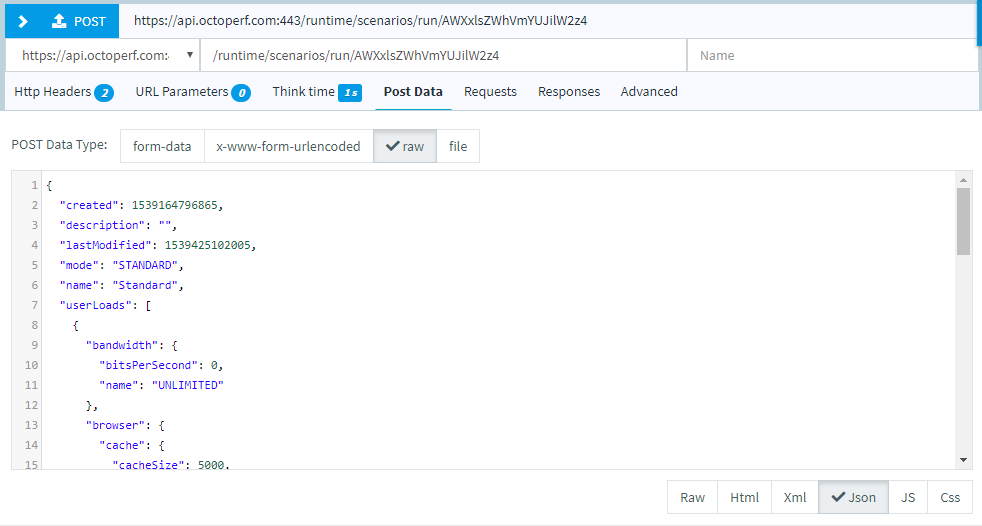
But also make sure it is a valid payload and has the proper content-type header.
Bug Fixes
For the complete list of fixed bugs, please refer to 10.4.0 Release Notes.
Conclusion
Most of these features are based on feedbacks from our new or returning users. That's why it is important to contact us through the chat or email if you have any issue/idea to make your life easier. And as a final note, a big thank you to everyone that contributed their feedback!
