
Ultimate Guide: 23 Free Load Testing Tools Reviewed
There are many performance testing tools available on the market. That's great!
But, i'm sure you agree it's difficult which tool best suits your needs:
- What features has JMeter?
- What's the pros of using Gatling?
- I have heard of Tsung, how do the results look like?
What if you could get a complete picture of all free load testing tools in one single guide?
Today, I have something that will make you feel like you have Load Testing Superpowers: 20+ Reviews of the Best Open-Source Load Testing Tools.
What Is Load Testing
Load Testing Tools are used to simulate production-like workload on web servers and measure the response time under load.
The best example would be an ecommerce website during Black Friday sales. Website Stress Test tools can simulate thousands of users purchasing goods at ease.
How we Reviewed The Tools
Each tool has been analyzed with the following methodology:
- Description: describes where to find the tool, the source code, how many people contributed and a brief text description,
- Setup: explains how to install the tool,
- Trends: describes if the tool is currently trending or not, and why,
- Scripting: describes how the scripting works, the format in which the projects are saved,
- Results: after executing a simple test, this section shows how results look like.
If you don't find some sections for all the tools, then it might be that it's simply not relevant.
I know, it's boring, but now we are ready for some action!
Graphical Tools
I call UI Oriented load testing tools the ones which rely on an UI for scripting. The point is most QA Engineers don't write code, but sometimes they do. Anyway, you may or not agree, but I see Development and QA as separate activities.
JMeter
JMeter Description
- Official Website: Apache JMeter
- Source Code: Apache JMeter on Github
- Contributors: 10+
- Lines of Code: 370K+
- License:

- Apache JMeter on Wikipedia
- Inception Year: 2001
- Type: GUI Based
- Language: Java
- Scripting: Point-And-Click
Apache JMeter is open source performance and functionality testing tool designed to test Java applications. Best testing tool to test performance and functionality of web applications with complete detailed report generating. Jmeter provides feature to perform distributed load test, parameterization of application for multiple users, continuous load etc. With help of JMeter you can record and run script using browser by changing the proxy settings.
Apache JMeter is truly a master piece. You may ask Why is JMeter so popular? Simply because its UI is easy to use. Sure, the UI looks a little bit aged and ugly, but don't get fooled by this argument.
JMeter Features
JMeter has the following features:
-
Ability to load and performance test many different applications/server/protocol types:
-
Web: HTTP, HTTPS (Java, NodeJS, PHP, ASP.NET, …),
- SOAP / REST Webservices,
- FTP,
- Database via JDBC,
- LDAP,
- Message-oriented middleware (MOM) via JMS,
- Mail - SMTP(S), POP3(S) and IMAP(S),
- Native commands or shell scripts
- TCP,
- Full featured Test IDE that allows fast Test Plan recording (from Browsers or native applications), building and debugging.
- Command-line mode (Non GUI / headless mode) to load test from any Java compatible OS (Linux, Windows, Mac OSX, …)
- Dynamic HTML report,
- Easy correlation through ability to extract data from most popular response formats, HTML, JSON , XML or any textual format,
- Complete portability and 100% Java purity,
- Full multi-threading framework allows concurrent sampling by many threads and simultaneous sampling of different functions by separate thread groups,
- Caching and offline analysis/replaying of test results.
JMeter can be further extended by adding JMeter plugins.
JMeter Setup
To install JMeter:
- Download JMeter from JMeter Download Page,
- unzip the archive on your local disk,
- Then run from
JMETER_HOMEin a terminal:./bin/jmeter,JMETER_HOMEis the folder where JMeter is installed.
JMeter UI should start within seconds. JMeter requires Java to run.
JMeter Trends

JMeter's popularity is steady and even growing for the last five years! Many folks from China, India and generally speaking eastern countries are using JMeter.
Let's be honest, JMeter has great success in developing countries. That's obvious since JMeter is free. But, JMeter is also the foundation of numerous Cloud Companies like OctoPerf or Flood IO. These companies are putting great efforts to market JMeter.
JMeter Scripting
Scripting entirely done via JMeter's UI. The saved project are in XML format.
<?xml version="1.0" encoding="UTF-8"?>
<jmeterTestPlan version="1.2" properties="3.2" jmeter="3.3 r1808647">
  <hashTree>
    <TestPlan guiclass="TestPlanGui" testclass="TestPlan" testname="JMeter Demo" enabled="true">
      <stringProp name="TestPlan.comments"></stringProp>
      <boolProp name="TestPlan.functional_mode">false</boolProp>
      <boolProp name="TestPlan.serialize_threadgroups">false</boolProp>
      <elementProp name="TestPlan.user_defined_variables" elementType="Arguments" guiclass="ArgumentsPanel" testclass="Arguments" testname="User Defined Variables" enabled="true">
        <collectionProp name="Arguments.arguments"/>
      </elementProp>
      <stringProp name="TestPlan.user_define_classpath"></stringProp>
    </TestPlan>
    <hashTree>
    ....
The XML format is pretty readable although it's not recommended to modify it directly.
JMeter Results


As it turns out, the HTML report is beautiful and provides in-depth performance metrics. JMeter is the most used free load testing tool on the market. You may be curious about Who is using JMeter?
But, no pressure yet! Don't go with JMeter unless you've seen the other tools as well.
SoapUI
SoapUI Description
- Official Website: SoapUI
- Source Code: SoapUI on Github
- Contributors: 40+
- Lines of Code: NA
- License: European Union Public License 1.1
- Inception Year: 2008
- Type: GUI Based
- Language: Java
- Scripting: Point-And-Click
As explained in their documentation:
SoapUI is the world's most widely-used open source API testing tool for SOAP and REST APIs. SoapUI offers SOAP Web Services functional testing, REST API functional testing, WSDL coverage, message assertion testing and test refactoring. With over 10 years of experience backed by a vast open source community, SoapUI is the de facto method for ensuring quality when developing APIs and Web Services.
Written by Ole Lensmar, SoapUI is a Rest Api oriented load testing tool. According to Google Trends, the demand for SoapUI is slowly declining.
SoapUI Features
SoapUI has the following features:
- Create tests directly from Swagger and other popular API description formats,
- Analyze your functional test coverage to know what you're missing,
- Run ad-hoc tests without having to maintain temporary API client code,
- Use the command-line to hook your tests to your build system,
- Quickly flip between multiple environments: development, testing, staging, etc,
- Test REST, SOAP, and other protocols in a single, unified framework.
For more information, see the complete SoapUI Feature List.
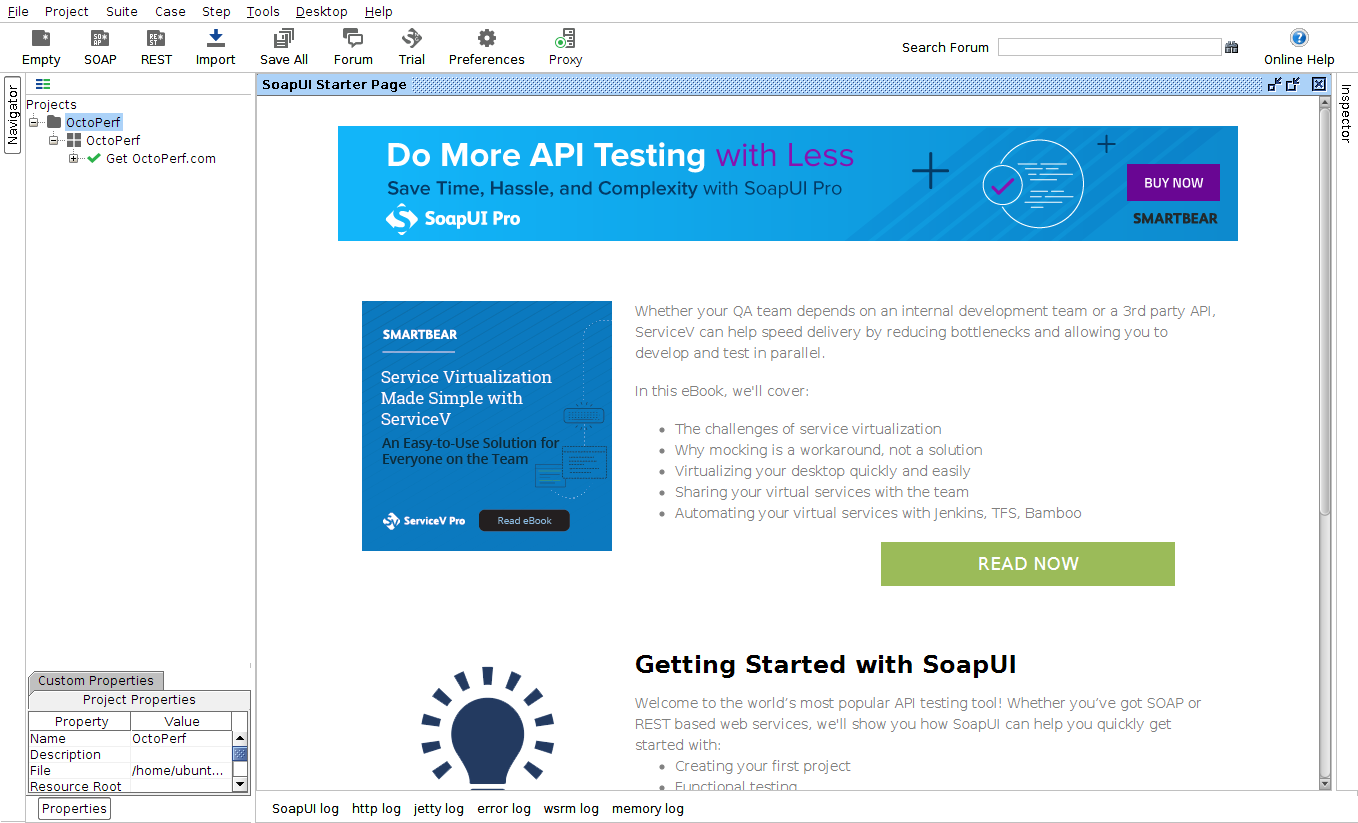
SoapUI Setup
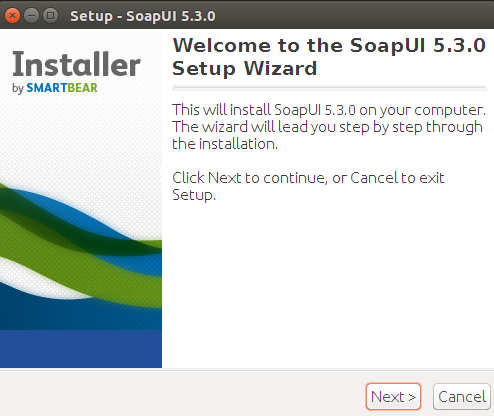
Here is how to install SoapUI:
- Download SoapUI, Select the appropriate installer according to your OS,
- Execute installation script,
- Follow instructions.
SoapUI should be runnable from an icon on the desktop. SoapUI requires Java to run but is already bundled with a Java JVM.
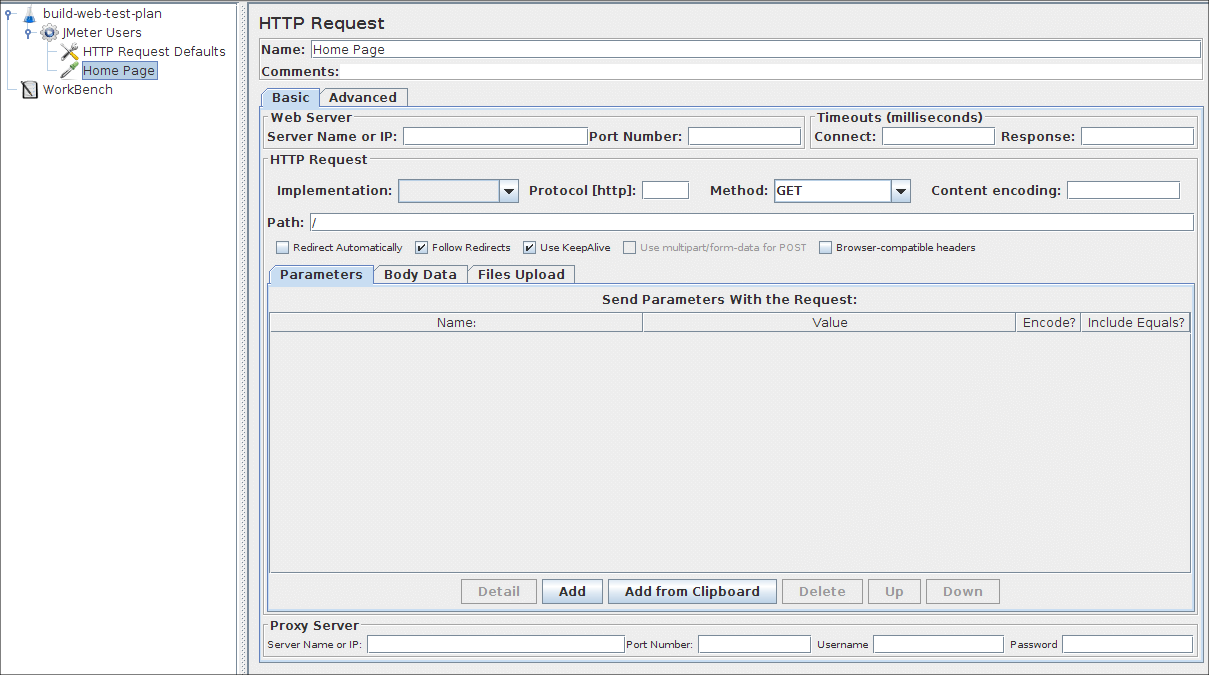
SoapUI Scripting
SoapUI projects are saved in XML format.
<?xml version="1.0" encoding="UTF-8"?>
<con:soapui-project id="796a7cae-1292-48a7-ad41-c5ae7ceae59c" activeEnvironment="Default" name="Project 1" resourceRoot="" soapui-version="5.3.0" xmlns:con="http://eviware.com/soapui/config"><con:settings/><con:testSuite id="01171b43-9aa1-4e73-a95d-76b6889ab2ec" name="OctoPerf"><con:settings/><con:runType>SEQUENTIAL</con:runType><con:testCase id="592d6e24-68c6-40cf-bdfe-47bd12a7632a" failOnError="true" failTestCaseOnErrors="true" keepSession="false" maxResults="0" name="Get OctoPerf.com" searchProperties="true"><con:settings/><con:testStep type="httprequest" name="HTTP Request" id="973400d8-8ba4-46a1-a1d8-ae5d32e8e529"><con:settings/><con:config method="GET" xsi:type="con:HttpRequest" id="6f578570-3695-4b35-bce3-541d16083973" name="HTTP Request" xmlns:xsi="http://www.w3.org/2001/XMLSchema-instance">
...
The format is pretty hard to read due lack of indentation. They must have done this in order to save some disk space (sigh!).
SoapUI Trends

Look, since 2016, JMeter is taking over SoapUI. The small growth seen on JMeter seems directly related to SoapUI descent. Late 2017, JMeter is almost 2x more popular than SoapUI.
That shouldn't stop you from using SoapUI. Even if some user think SoapUI UX is terrible (See Jeremy Stafford comment), the tool is great for testing SOAP Rest Services.
SoapUI Results
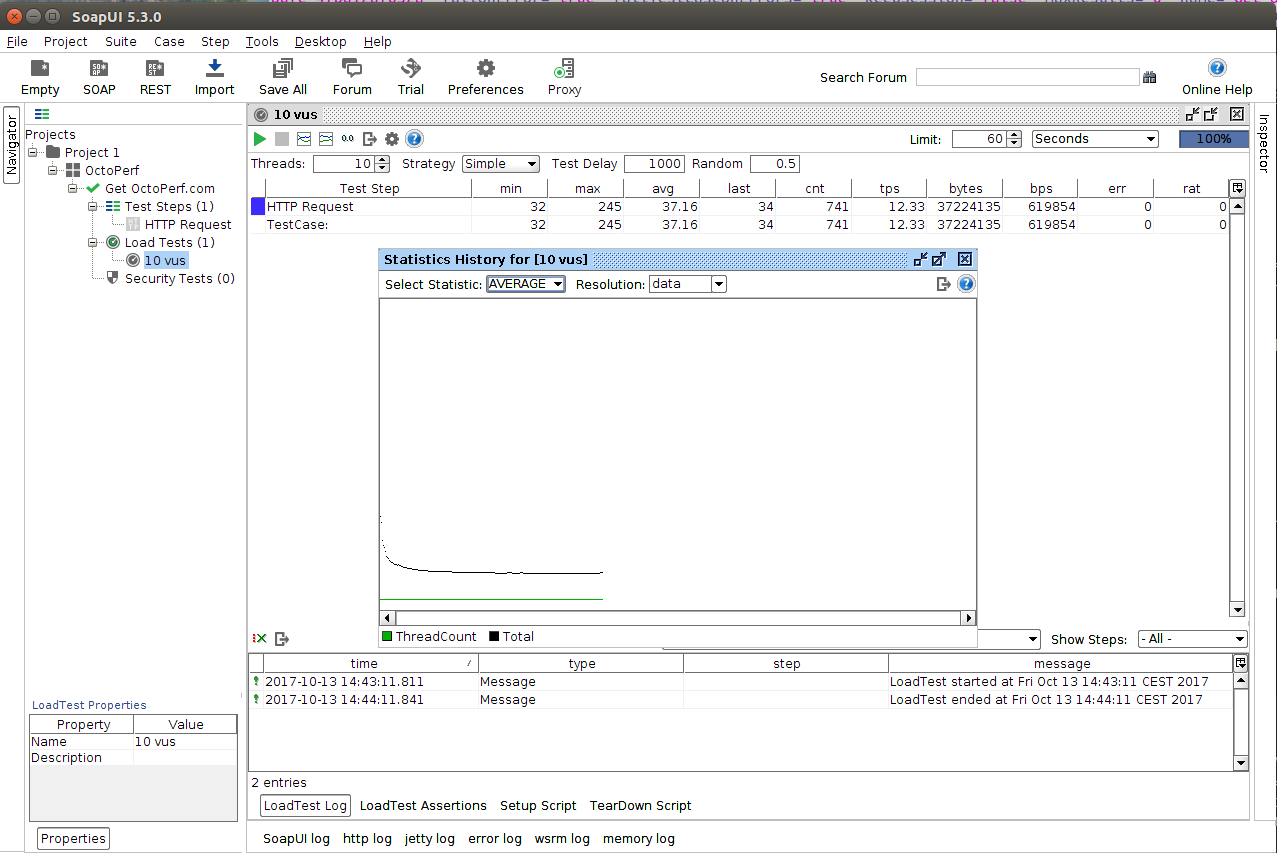
As SoapUI is more oriented toward functional and regression testing, the reporting is not comparable to JMeter's reporting. The results are pretty simple and very informative. The tool seems not really well suited for load testing. SoapUI is best suited for functional and regression testing.

Tired of UI Tools? You feel more comfortable with command-line tools and code? Developer Minds, I hear you. There are tools specially taylor for you!
SoapUI Alternatives
If you are looking for alternative tools to SoapUI, you may have been suggested with the following tools:
- Postman: A powerful GUI platform to make your API development faster & easier, from building API requests through testing, documentation and sharing,
- Wizdler: Chrome extension for testing WSDL Services,
- WebInject: WebInject is a free tool for automated testing of web applications and web services,
- HTTP Master: http-master is a front end http service with with easy setup of reverse proxy/redirecting/other-actions logic,
- or Hurl: Create functional tests to validate the structure and content of your most critical API workflows.
But, don't be fooled, the tools above an not as feature-rich as SoapUI.
The Grinder
- Official Website: The Grinder
- Source Code: The Grinder on Github
- Contributors: NA
- Lines of Code: NA
- License: Custom License
- Inception Year: 2000
- Type: GUI Based
- Language: Java
- Scripting: Point-And-Click
The Grinder is a Java load testing framework that makes it easy to run a distributed test using many load injector machines. Load test anything that has a Java API. This includes common cases such as HTTP web servers, SOAP and REST web services, and application servers (CORBA, RMI, JMS, EJBs), as well as custom protocols.
How It Works
The Grinder consists of:
- Console: UI Interface to manage Grinder agents, monitor results. The console can be used to edit test suites,
- Agents: headless load generator which must be launched from command-line. It connects to the console via TCP.
Grinder Features
The most interesting features are:
- TCP proxy to record network activity into the Grinder test script,
- Distributed testing that scales with an the increasing number of agent instances,
- Power of Python or Closure, combined with any Java API, for test script creation or modification
- Flexible parameterization, which includes creating test data on the fly and the ability to use external data sources like files and databases
- Post-processing and assertion with full access to test results for correlation and content verification
- Support of multiple protocols.
For a more extensive list, please see The Grinder Features.
The Grinder Scripting
The Grinder is an UI Scripting tool.
# A simple example using the HTTP plugin that shows the retrieval of a
# single page via HTTP.

from net.grinder.script import Test
from net.grinder.script.Grinder import grinder
from net.grinder.plugin.http import HTTPRequest

test1 = Test(1, "Request resource")
request1 = HTTPRequest()
test1.record(request1)

class TestRunner:
    def __call__(self):
        result = request1.GET("http://localhost:7001/")
The Grinder Scripts are written in Jython language. Scripts can also be written in Closure.
Grinder Results
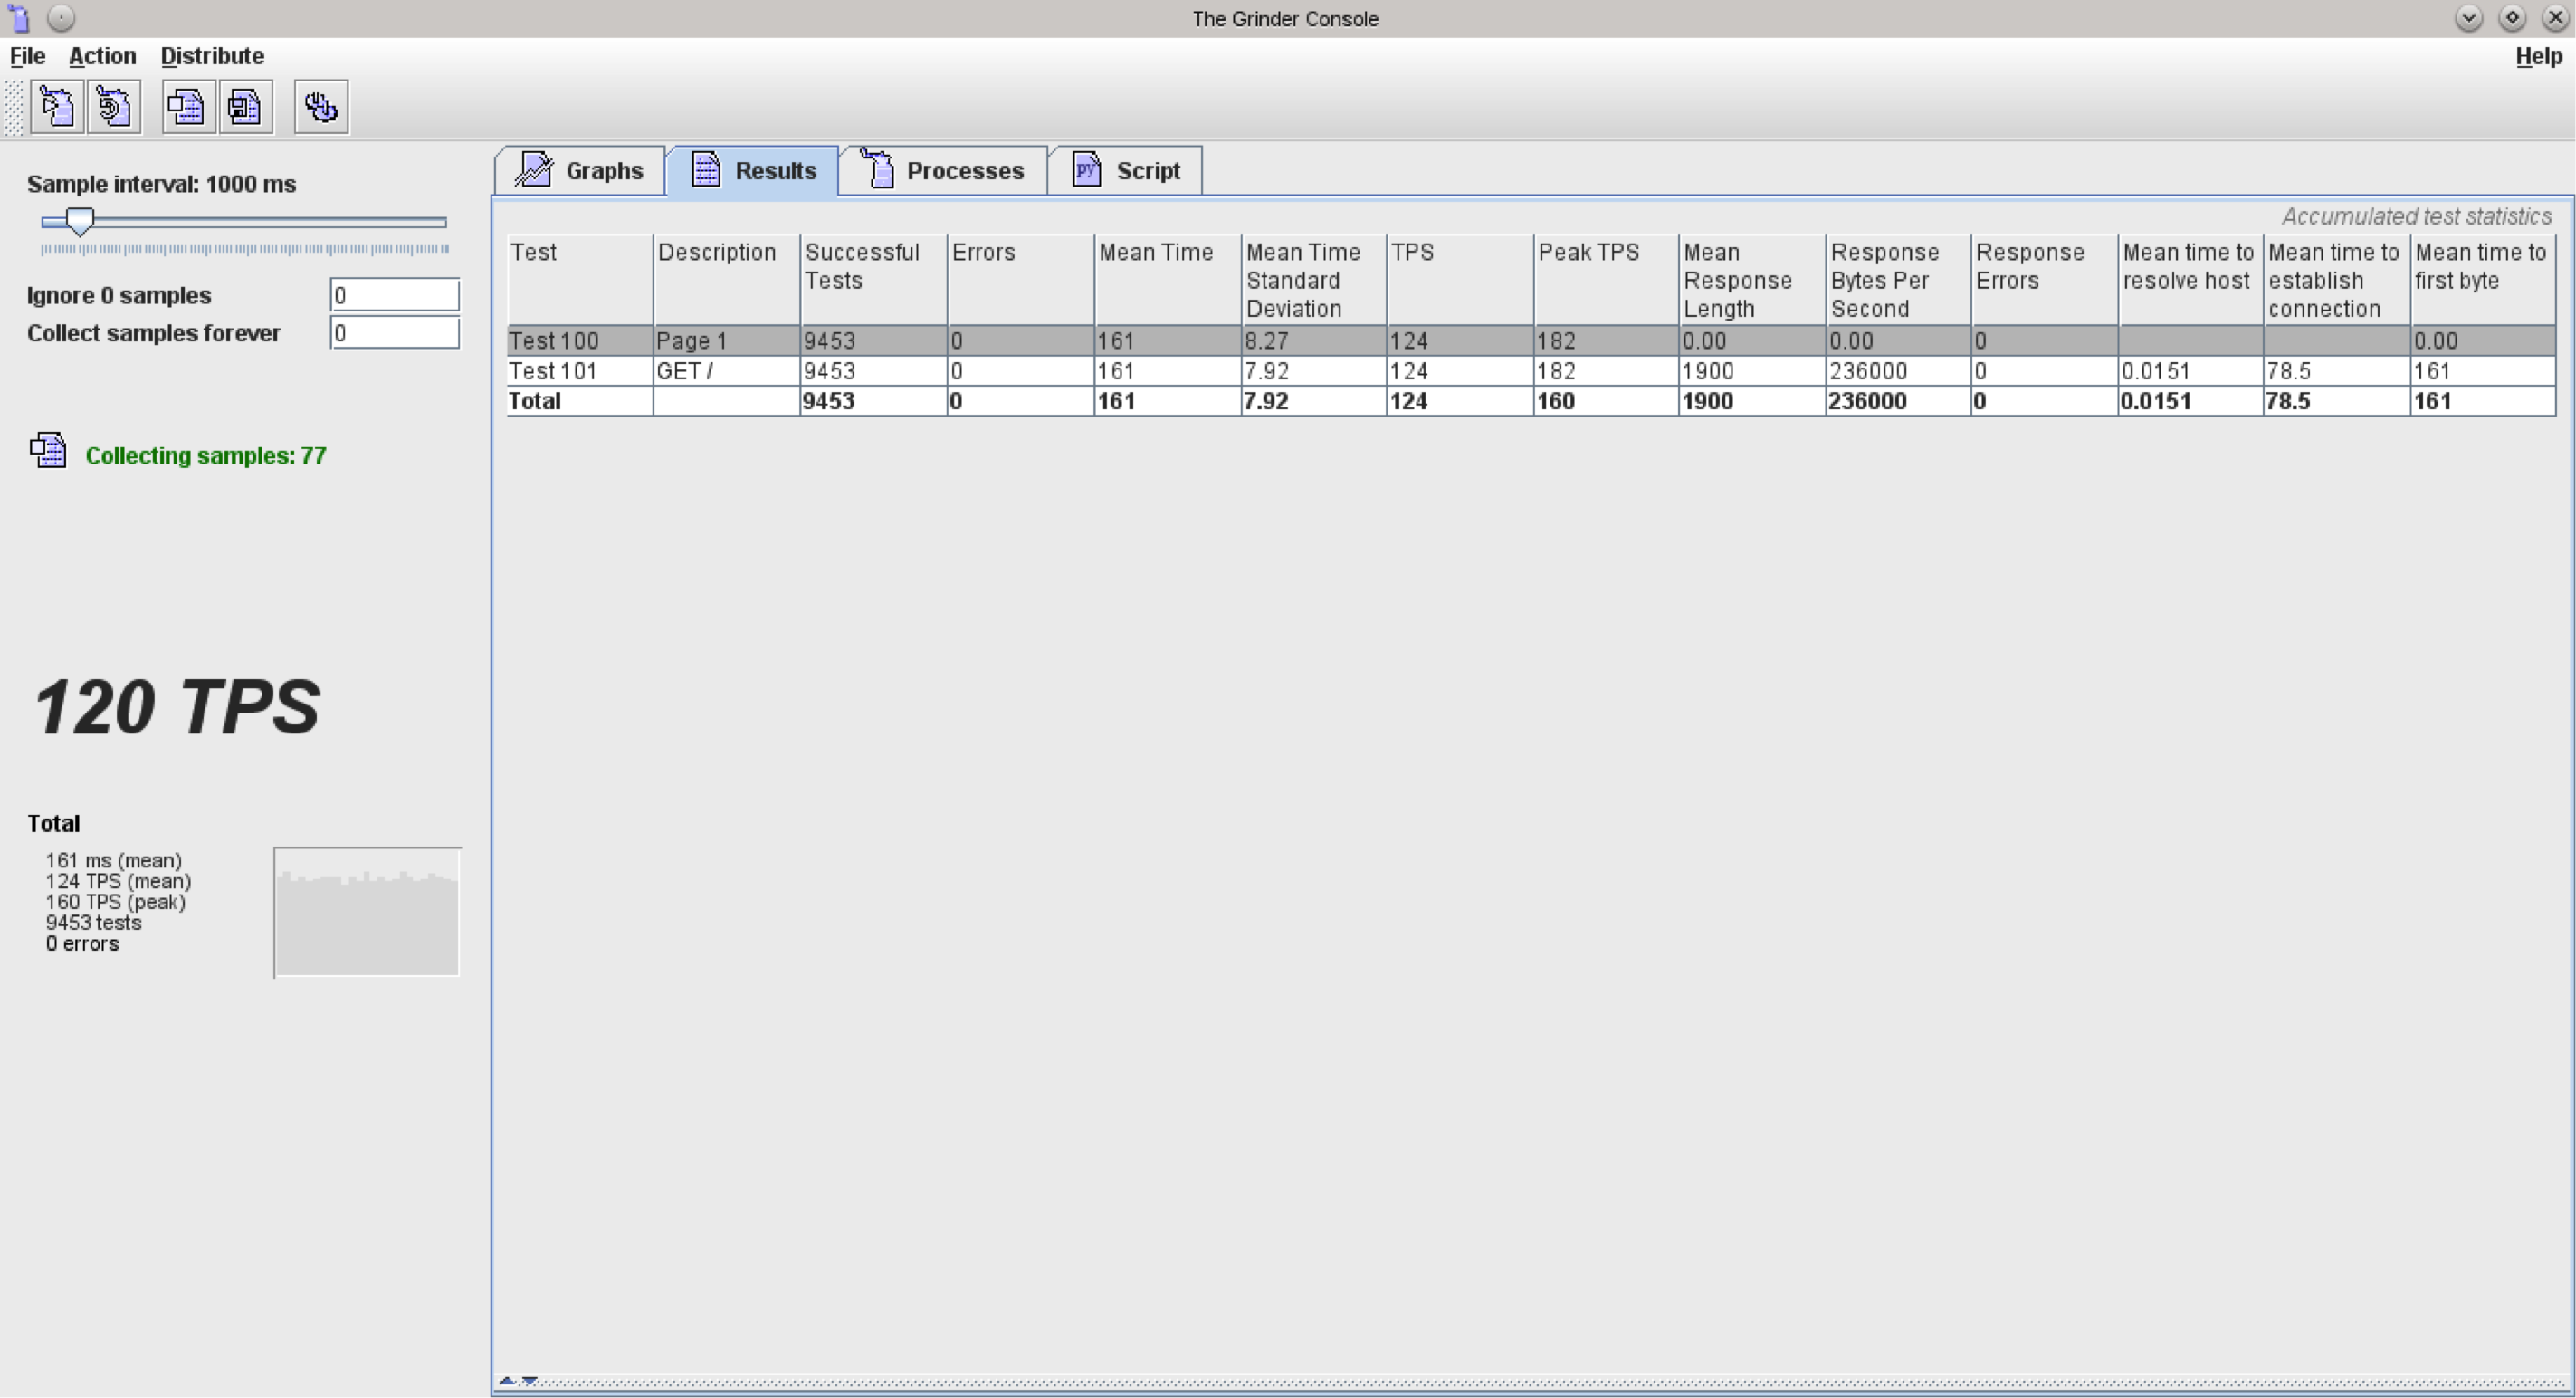
The Grinder outputs a log file containing all the results. The best way to analyze those logs is to use Grinder Analyzer:
Grinder Analyzer is a tool that parses grinder log data and generates client-side performance graphs. These graphs include response time, transactions per second, and network bandwidth used. Like The Grinder itself, Grinder Analyzer uses Jython, and the excellent JFreechart graphing library.
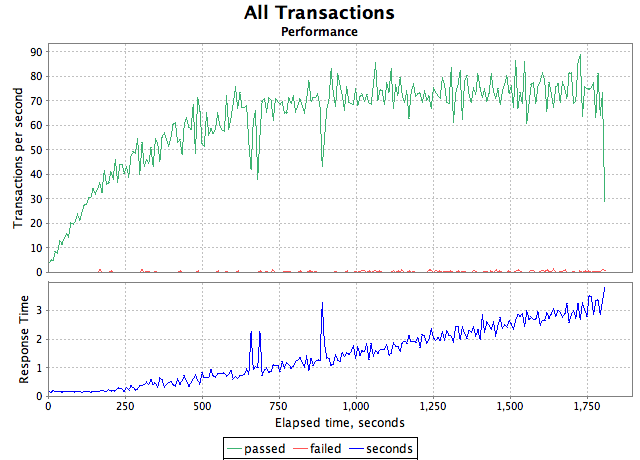
The Sample Reporting is pretty simple:
- Hits and Response Times graphs,
- and a table with min, average, max, standard deviation and more statistics per transaction.
The Grinder is surprisingly easy to use! I would be surprised to see people still using it yet even for heavy load tests. The tool can run distributed tests after all!
To be honest, I would surely recommend it if you need to run tests with thousands of concurrent users on a very simple application.
Devops Tools
Devops is trending for 5 years now. Look at the Google Trends reporting below.
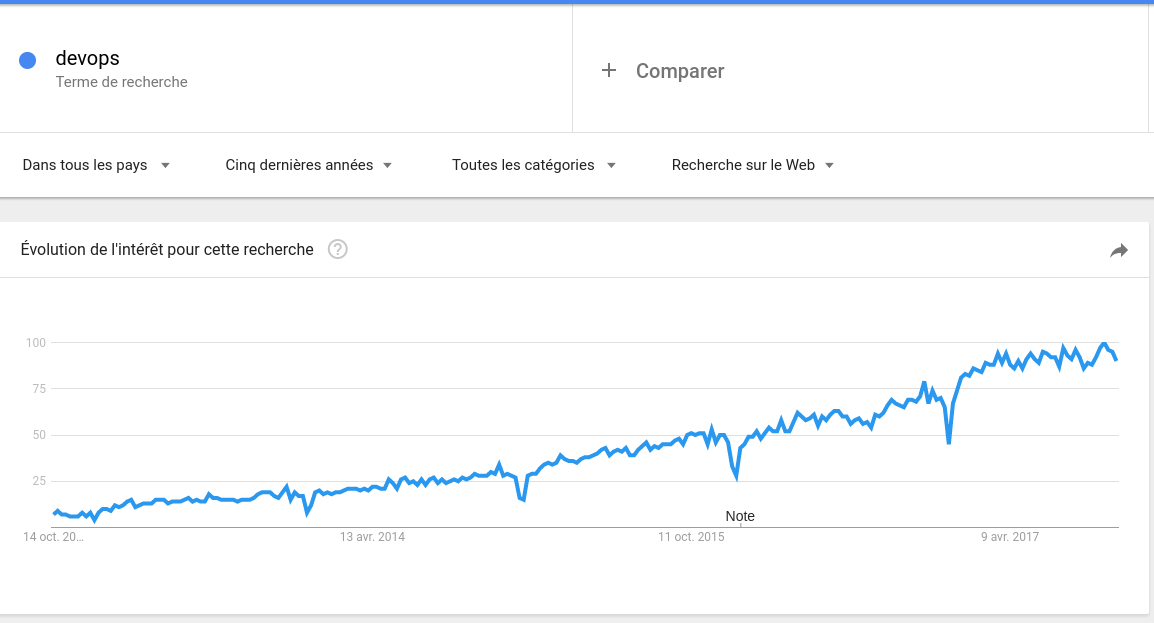
Devops is taking off since 2012! This is why many load testing companies are targeting devops engineers. But are devops really interested in doing performance testing? Answers on Quora aren't frank.
Like Explained on Wikipedia:
DevOps (a clipped compound of "development" and "operations") is a software engineering practice that aims at unifying software development (Dev) and software operation (Ops).
Doesn't it sound more like the following statement? Devops seem engineers capable of replacing several specialised engineers. Devops seems like the MultiTasking Engineer. My scepticism around Devops may be related to the fact multitasking is bad for the brain.

You want to know something interesting? As shown on the graph above, Devops is growing and QA is pretty stable. Nothing fancy yet. But, even better, the Devops growth doesn't affect the QA steadiness!
I hear you now asking What at those downspikes? They seem related! Sure they are. It's Christmas and New Year during the downspikes. You got it!
Gatling Tool
Gatling Description

- Official Website: Gatling Tool
- Source Code: Gatling on Github
- Contributors: 90+
- Lines of Code: 100K+
- License:

- Gatling Tool on Wikipedia
- Inception Year: 2011
- Type: Command-Line
- Language: Scala
- Scripting: As Code (Scala)
Gatling is a highly capable load testing tool. It is designed for ease of use, maintainability and high performance. Out of the box, Gatling comes with excellent support of the HTTP protocol that makes it a tool of choice for load testing any HTTP server. As the core engine is actually protocol agnostic, it is perfectly possible to implement support for other protocols. For example, Gatling currently also ships JMS support.
Gatling Tool, huh? I guess you've already heard about it. Gatling is downloaded more than 50K times per month as of now. You may ask me now: That's cool, but how does it work?
Gatling Features
Gatling has the following interesting features:
- Standalone HTTP Proxy Recorder,
- Scala-based scripting,
- An expressive self-explanatory DSL for test development,
- asynchronous non-blocking engine for maximum performance,
- Excellent support of HTTP(S) protocols and can also be used for JDBC and JMS load testing,
- Validations and assertions,
- and a Comprehensive HTML Report.
For more information, see Gatling Documentation.
Gatling Scripting
Gatling is based on Scala scripts. Never heard of Scala before? That's completely fair, Scala is a confidential programming langage. Gatling mainly targets Devops (multi-tasking developers), that's why you have to write code.

You can find a great number of Gatling Example inside the gatling directory. This is the basic simulation: (truncated for readability)
package computerdatabase

import io.gatling.core.Predef._
import io.gatling.http.Predef._
import scala.concurrent.duration._

class BasicSimulation extends Simulation {

  val httpConf = http
    .baseURL("http://computer-database.gatling.io") // Here is the root for all relative URLs
    .acceptHeader("text/html,application/xhtml+xml,application/xml;q=0.9,*/*;q=0.8") // Here are the common headers
    .doNotTrackHeader("1")
    .acceptLanguageHeader("en-US,en;q=0.5")
    .acceptEncodingHeader("gzip, deflate")
    .userAgentHeader("Mozilla/5.0 (Macintosh; Intel Mac OS X 10.8; rv:16.0) Gecko/20100101 Firefox/16.0")

  val headers_10 = Map("Content-Type" -> "application/x-www-form-urlencoded") // Note the headers specific to a given request

  val scn = scenario("Scenario Name") // A scenario is a chain of requests and pauses
    .exec(http("request_1")
      .get("/"))
...
  setUp(scn.inject(atOnceUsers(1)).protocols(httpConf))
}
I can see on your face what's going on in your head: How come will I be able to write code? I'm not a developer! No Worries, Gatling Documentation is rock-solid. You need some help? Check out Gatling on Stackoverflow, there are many questions being answered by Gatling experts.
Gatling Trends

Gatling is already more than 5 years old, a mature project. Although, it's popularity is nowhere close to JMeter's popularity. People mostly from the United-States are using it according to Google Trends.
The right question to ask yourself is: Am I a Software Engineer or a QA Engineer? If you fall into the first group, definitely give Gatling a try.
Gatling Results
You've sweated blood to write your Scala script, and now it's time to analyze the test results. What does a Gatling HTML report look like? Let's run the built-in basic simulation:
Simulation computerdatabase.BasicSimulation completed in 22 seconds
Parsing log file(s)...
Parsing log file(s) done
Generating reports...

================================================================================
---- Global Information --------------------------------------------------------
> request count                                         13 (OK=13     KO=0     )
> min response time                                     32 (OK=32     KO=-     )
> max response time                                     88 (OK=88     KO=-     )
> mean response time                                    46 (OK=46     KO=-     )
> std deviation                                         16 (OK=16     KO=-     )
> response time 50th percentile                         40 (OK=40     KO=-     )
> response time 75th percentile                         42 (OK=42     KO=-     )
> response time 95th percentile                         77 (OK=77     KO=-     )
> response time 99th percentile                         86 (OK=86     KO=-     )
> mean requests/sec                                  0.565 (OK=0.565  KO=-     )
---- Response Time Distribution ------------------------------------------------
> t < 800 ms                                            13 (100%)
> 800 ms < t < 1200 ms                                   0 (  0%)
> t > 1200 ms                                            0 (  0%)
> failed                                                 0 (  0%)
================================================================================

Reports generated in 0s.
Please open the following file: /home/ubuntu/load-testing-tools/gatling-charts-highcharts-bundle-2.3.0/results/basicsimulation-1507793678022/index.html


I have to admit, Gatling's report is simple but powerful. It offers the most important metrics and graphs. And you know what's the best part? The report is automatically generated at the end of the test.
Gatling Tool is not the single load testing tool targeting Devops users.
LoadImpact K6
K6 Description
- Official Website: Apache Siege
- Source Code: K6 on Github
- Contributors: 1
- Lines of Code: 50K+
- License:

- Inception Year: 2017
- Type: Command-Line
- Language: Google Go
- Scripting: As Code (Javascript)
K6 is a modern load testing tool, building on Load Impact's years of experience. It provides a clean, approachable scripting API, distributed and cloud execution, and orchestration via a REST API.
I don't know why, but the name of this tool strangely remembers me the golden age of the AMD K6 processor. Maybe you make the cognitive bias as me, then obviously it means we're from the same generation!
This tool claims this is how load testing should look in the 21st century on his GitHub page.

Besides the tool's funny name, it's actually an interesting piece of software. You may understand that i'm a bit sceptic about its possibilities on the load testing market, but that's just my opinion.
K6 Features
K6 has the following features:
- Javascript scripting and comprehensive DSL,
- High Performance engine written in Go Lang,
- Advanced assertions and validations,
- Supports for HTTP, HTTPS and WebSocket protocols.
For more information, see K6 documentation.
K6 Setup
To install K6:
- Download K6 according to your OS,
- Decompress the archive in the target installation location,
- Run directly from command-line.
From my opinion, Linux is better suited to development than Windows. Why do some programmers like Linux instead of Windows? It's more of a Fan or Hate mantra than anything else. I spent 7 years developing Java applications on Windows, before finally making the switch to Ubuntu.
I already hear you saying Nice but how do I run it on Windows then? There are K6 pre-built binaries for several operating systems including Windows.

Code Vs UI Scripting, Command-Line vs Point-And-Click, the choice seems deeply emotional. Why is this so? I guess there is no simple answer when it comes to emotions. K6 made the choice to appeal to terminal fans.
K6 Scripting

import http from "k6/http";

export default function() {
  http.get("http://test.loadimpact.com");
};
See the difference with Gatling? Come one, it's Javascript here! Remember Gatling, scripts were written in Scala. K6 Developers claim Javascript is easier to learn than Scala.
One nice thing about this tool is that is runs as a Docker Container. The loadimpact/k6 docker image has been made for that purpose. Of course, i'm a developer, and you maybe not. But, isn't K6 developer centric?
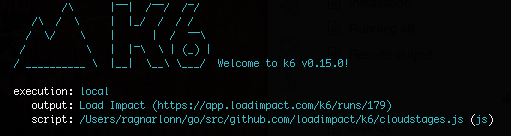
K6 Results
K6 Results are directly printed within the console. Results can also be output in json format. For more information, see K6 Results Output.

To tell you the truth, the results are pretty deceiving. But, that's not a surprise! The open-source tool has been designed to provide the minimum metrics to push people to subscribe to the paid LoadImpact Saas.
Clearly, their strategy is to leverage Open-Source popularity to make their online tool known and used as well. That's a pretty risky Business Model. You have to find the right balance between open-source and paid software.

Still not enough of Devops Load testing Tools ? The following one is written in Python.
Locust
Locust Description
- Official Website: Locust
- Source Code: SourceForge
- Contributors: 60+
- Lines of Code: 100K+
- License:

- Inception Year: 2004
- Type: Command-Line
- Language: Python
- Scripting: As code (Python)
Define user behaviour with Python code, and swarm your system with millions of simultaneous users. Python is popular among
Locust is a command-line and Script as Code Load testing tool. There are a few Locust Samples that you can run by your own. I'm going to take the basic one.
Locust Key Features
Locust has the following features:
- Write user test scenarios in plain-old Python,
- Distributed & Scalable - supports hundreds of thousands of users,
- Web-based UI,
- Excellent support for HTTP / HTTPS protocols,
- Extensible.
For more information, see What is Locust.
Locust Setup
To install Locust, run the following command-line: sudo pip install locustio (assuming you already have pip)
Locust then runs from the command-line:
ubuntu@desktop:~$ locust --help
Usage: locust [options] [LocustClass [LocustClass2 ... ]]

Options:
  -h, --help            show this help message and exit
  -H HOST, --host=HOST  Host to load test in the following format:
                        http://10.21.32.33
  --web-host=WEB_HOST   Host to bind the web interface to. Defaults to '' (all
                        interfaces)
  -P PORT, --port=PORT, --web-port=PORT
                        Port on which to run web host
  -f LOCUSTFILE, --locustfile=LOCUSTFILE
                        Python module file to import, e.g. '../other.py'.
                        Default: locustfile
...
Execute locust --help for more information about the possible command-line options.
Locust Scripting
Here is the basic sample script locustfile.py:
from locust import HttpLocust, TaskSet, task


def index(l):
    l.client.get("/")

def stats(l):
    l.client.get("/stats/requests")

class UserTasks(TaskSet):
    # one can specify tasks like this
    tasks = [index, stats]

    # but it might be convenient to use the @task decorator
    @task
    def page404(self):
        self.client.get("/does_not_exist")

class WebsiteUser(HttpLocust):
    """
    Locust user class that does requests to the locust web server running on localhost
    """
    host = "http://127.0.0.1:8089"
    min_wait = 2000
    max_wait = 5000
    task_set = UserTasks
And to run it, we have to launch the following command-line: locust --host=http://octoperf.com
Locust Results
ubuntu@desktop:~/load-testing-tools/locust$ locust --host=https://octoperf.com
[2017-10-12 15:31:48,216] desktop/INFO/locust.main: Starting web monitor at *:8089
[2017-10-12 15:31:48,216] desktop/INFO/locust.main: Starting Locust 0.8.1
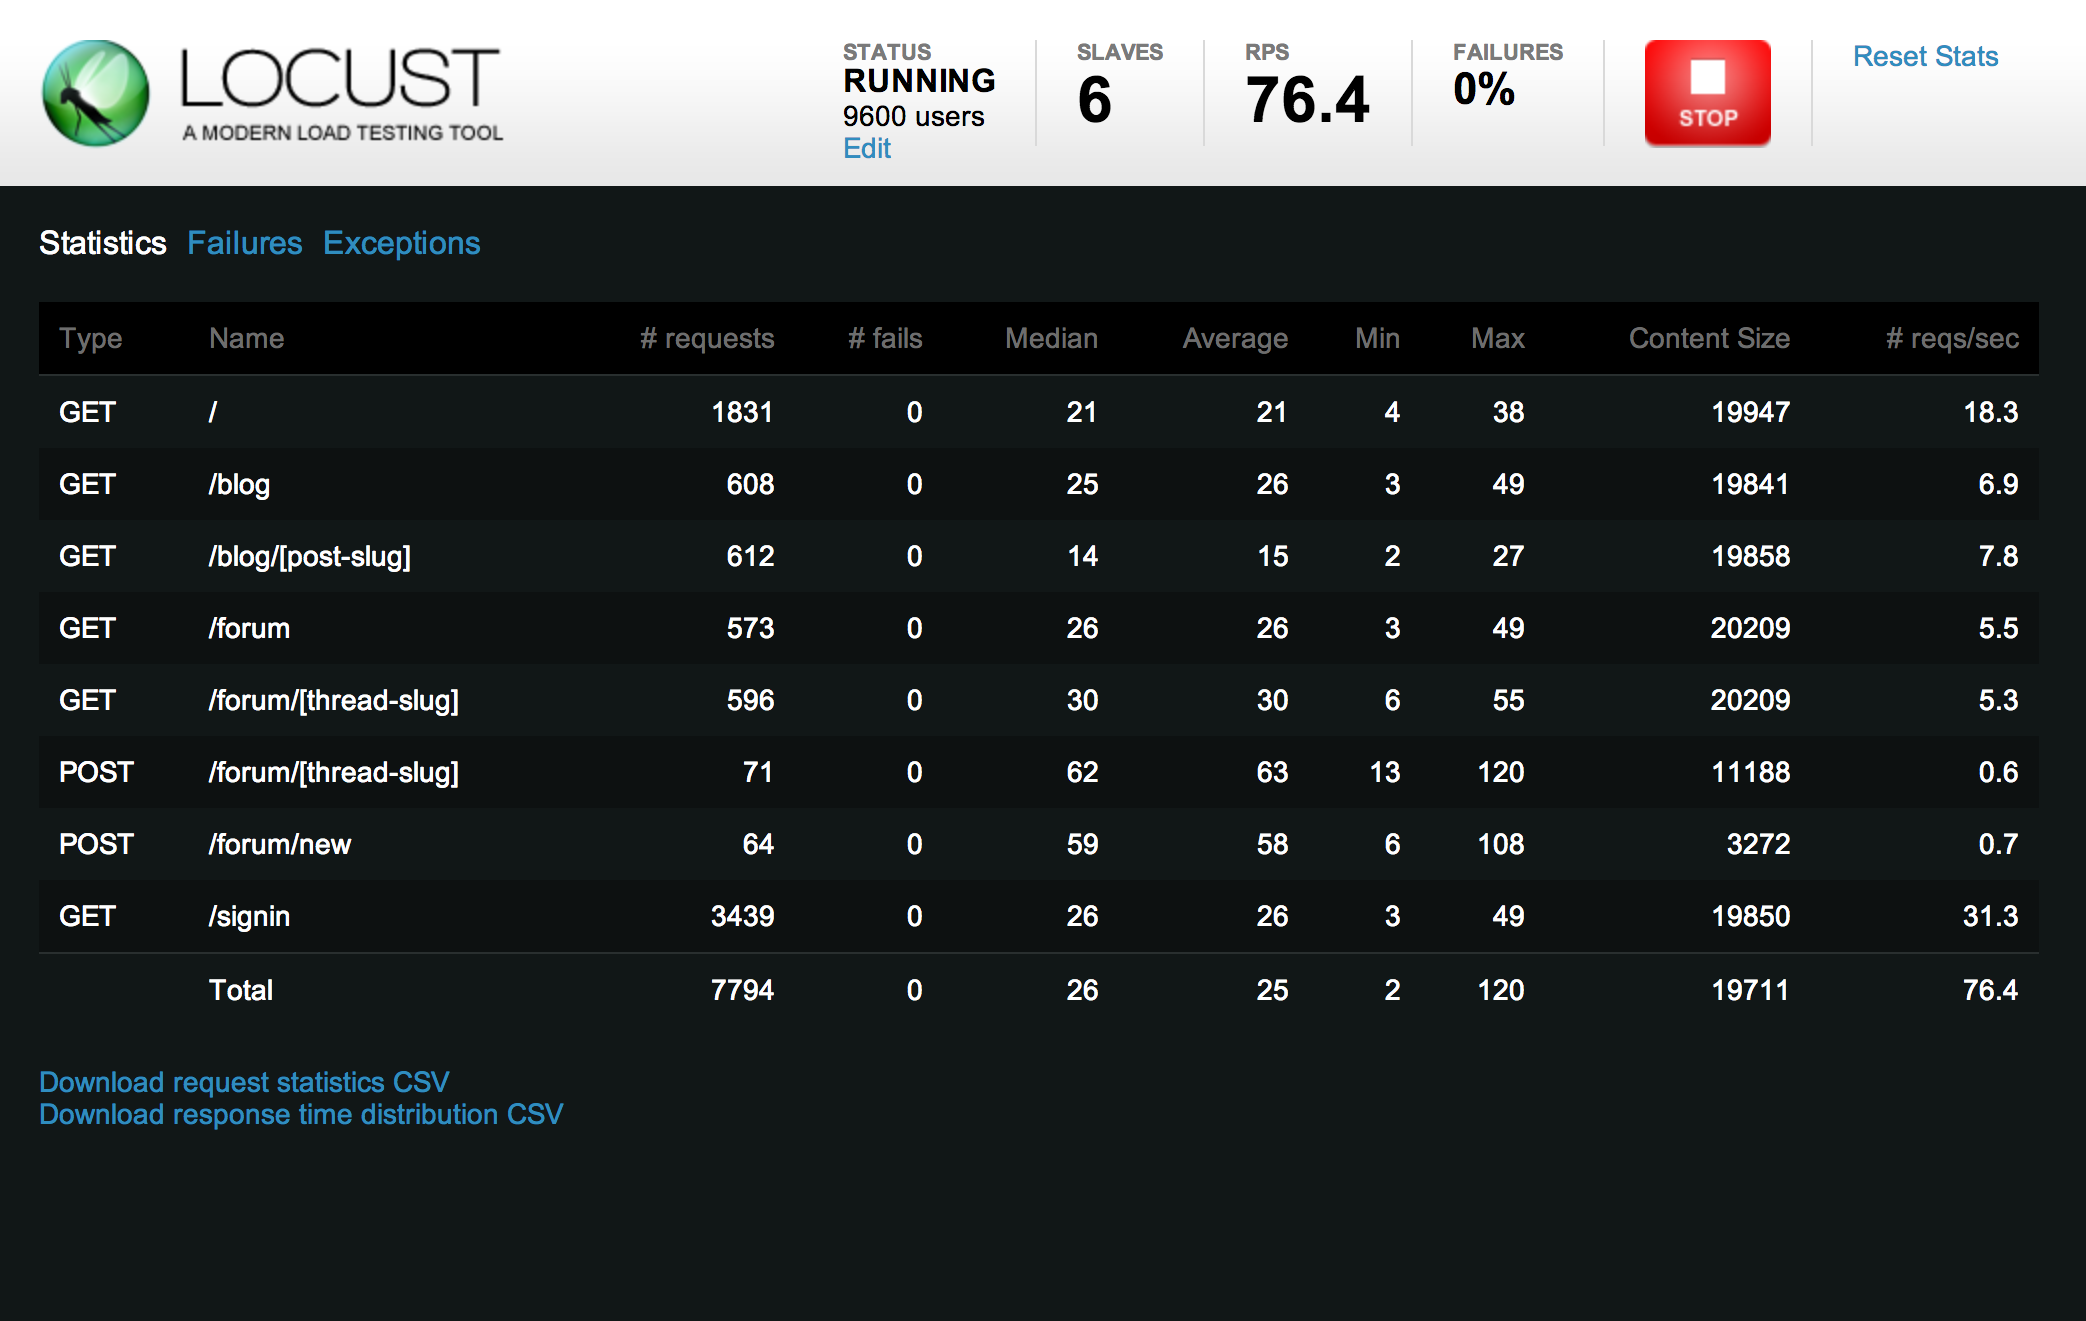
The Web UI http://localhost:8089 is now up and running. Let's start swarming our system with users!

Great, you are surely impatient to see the results. Me too!

The reporting system is very very simple. Don't expect any fancy graphs or reporting here. You can still download the results as CSV, but that's about anything you can interact with here. From my opinion, this tool is great for hammering on a bunch of urls, but that's it.
Taurus
Taurus Description

- Official Website: Locust
- Source Code: Taurus on Github
- Contributors: 15+
- Lines of Code: 30K+
- License:
- Inception Year: 2015
- Type: Command-Line
- Language: Python
- Scripting: As code (YML)
Taurus is not a load testing tool by itself but aims to provide automation over existing open-source load testing tools.
Hides the complexity of performance and functional tests with an automation-friendly convenience wrapper. Taurus relies on JMeter, Gatling, Locust.io, Grinder and Selenium WebDriver as its underlying tools. Free and open source under Apache 2.0 License.
In fact, Taurus is an abstraction layer on top of load testing tools, not a load testing tool itself. Under the hood, it can run pretty much anything as the underlying engine. It currently supports the mainstream tools: JMeter, Gatling and Selenium.
Taurus is purely a Command-line tool, associated with Code scripting.
Taurus Features
Taurus has the following features:
- Automation system for multiple engines including JMeter, Gatling, Selenium, Locust and more,
- Command-line interface,
- Easy to install,
- Highly configurable.
Taurus Setup
The installation can be done with a single command-line: sudo pip install bzt (assuming you already have pip)
For a more complete installation guide, please See Taurus Installation.
Taurus Scripting
Taurus scripts are in Yaml format. Here is a simple script:
execution:
- concurrency: 10
  ramp-up: 1m
  hold-for: 5m
  scenario: quick-test

scenarios:
  quick-test:
    requests:
    - https://octoperf.com
This sample script runs a quick rampup load testing up to 10 concurrents users for 5 minutes. The default engine is JMeter.
Let's see now how to run a test and how the results look like.
Taurus Results
To launch the test, we simply have to run the following command: bzt quick_test.yml, where quick_test.yml is the name of our script.
During the test run, Taurus displays a nice terminal console with some interesting information like cpu, disk or network usage.

Spoiler: Maybe it's because the main developer, Andrey Pokhilko, is a Russian guy who like Soviet style applications.
Anyway, even if the UI is criticable, the software does a decent job at abstracting the load testing tools underneath. From converting the YML to the target engine scripting format, to collecting the metrics, nothing is missing!
Once the test is finished, results are archived in a folder whose location is given in the console output:
15:30:46 WARNING: Please wait for graceful shutdown...
15:30:46 INFO: Shutting down...
15:30:46 INFO: Post-processing...
15:30:46 INFO: Test duration: 0:06:08
15:30:46 INFO: Samples count: 480, 0.00% failures
15:30:46 INFO: Average times: total 7.008, latency 0.578, connect 0.000
15:30:46 INFO: Percentile 0.0%: 1.150
15:30:46 INFO: Percentile 50.0%: 7.192
15:30:46 INFO: Percentile 90.0%: 8.821
15:30:46 INFO: Percentile 95.0%: 9.333
15:30:46 INFO: Percentile 99.0%: 10.379
15:30:46 INFO: Percentile 99.9%: 11.380
15:30:46 INFO: Percentile 100.0%: 11.380
15:30:46 INFO: Artifacts dir: /home/ubuntu/2017-10-13_15-24-37.225834
15:30:46 INFO: Done performing with code: 0
And the collected results artifacts:

The folder contains all the relevant results artifacts, including:
- JMeter logs,
- JMeter JMX project,
- YMLs converted back and forth to Json,
- Taurus logs,
- and more.
The artifacts being collected depend on the engine used to run the performance test.
In a nutshell, Taurus isn't a standalone load testing tool. It's an upper layer to drive the load testing tool underneath.
Tsung

- Source Code: Tsung on Github
- Contributors: 40+
- Lines of Code: 50K+
- License:

- Inception Year: 2001
- Type: Command-Line
- Language: Perl Erlang
- Scripting: As code (XML)
Tsung is multi-protocol distributed load testing tool. It can be used to test the scalability and performances of IP based client/server applications (supported protocols: HTTP, WebDAV, SOAP, PostgreSQL, MySQL, LDAP, MQTT, AMQP and Jabber/XMPP).
Tsung is written in Erlang: a high performance langage for multi-threaded applications.
Tsung Features
Tsung has the following features:
- Standalong Proxy Recorder: record scripts directly from the web browser,
- High Performance: the load can be distributed on a cluster of client machines,
- Multi-protocols using a plugin system: HTTP, WebDAV, SOAP, PostgreSQL, MySQL, LDAP , XMPP/Jabber, BOSH, MQTT and AMQP are currently supported. TCP, UDP, Websocket, TSL/SSL (with or without client certificate); IPv4 and IPv6 are supported,
- Several IP addresses can be used on a single machine using the underlying OS IP Aliasing,
- OS monitoring (CPU, memory and network traffic) using SNMP, Munin or Erlang agents on remote servers,
- XML configuration system
- Builtin Web dashboard to view statistics in real time during a tests (response times measurement, server CPU, etc.),
- Command line interface.
Tsung Setup
On an Ubuntu Xenial (16.04 LTS) OS, you first need to download and install Erlang OTP. You can do this with the command sudo apt-get install erlang.
ubuntu@desktop:~$ ./configure
checking for sed... /bin/sed
checking for erlc... no
checking for erl... no
checking for dialyzer... /usr/bin/dializer
checking for prefix by checking for erl... no
checking for erlc... erlc
checking for erl... erl
checking for Erlang/OTP root directory... configure: error: in `/home/ubuntu/load-testing-tools/tsung-1.7.0':
configure: error: test Erlang program execution failed
See `config.log' for more details
Then, to compile Tsung, just download the latest version from Tsung Download Page and run:
./configure
make
make install
Once install, try to run tsung:
ubuntu@desktop:~$ ./tsung.sh.in
Usage: tsung.sh.in <options> start|stop|debug|status|view
Options:
    -f <file>     set configuration file (default is ~/.tsung/tsung.xml)
                   (use - for standard input)
    -l <logdir>   set log directory where YYYYMMDD-HHMM dirs are created (default is ~/.tsung/log/)
    -i <id>       set controller id (default is empty)
    -r <command>  set remote connector (default is ssh)
    -s            enable erlang smp on client nodes
    -p <max>      set maximum erlang processes per vm (default is 250000)
    -X <dir>      add additional erlang load paths (multiple -X arguments allowed)
    -m <file>     write monitoring output on this file (default is tsung.log)
                   (use - for standard output)
    -F            use long names (FQDN) for erlang nodes
    -I <ip>       use IP (FQDN) for erlang nodes; you can assign local bind available IP (not assigned; default is the host's name)
    -L <lifetime> SSL session lifetime (600sec by default)
    -w <delay>    warmup delay (default is 1 sec)
    -n            disable web GUI (started by default on port 8091)
    -k            keep web GUI (and controller) alive after the test has finished
    -v            print version information and exit
    -6            use IPv6 for Tsung internal communications
    -x <tags>     list of requests tag to be excluded from the run (separated by comma)
    -t <min>      erlang inet listening TCP port min (default: 64000)
    -T <max>      erlang inet listening TCP port max (default: 65500)
    -h            display this help and exit
Great! Tsung is compiled and ready to run. Let's now see how to run a test and collect results.
Tsung Scripting
Tsung scripts are stored in XML format. Here is an example script:
<tsung>
<sessions>
  <session name="http-example" probability="100" type="ts_http">

    <!-- full url with server name, this overrides the "server" config value -->

    <request> <http url="/" method="GET" version="1.1"></http> </request>
    <request> <http url="/images/accueil1.gif" method="GET" version="1.1" if_modified_since="Fri, 14 Nov 2003 02:43:31 GMT"></http> </request>
    <request> <http url="/images/accueil2.gif" method="GET" version="1.1" if_modified_since="Fri, 14 Nov 2003 02:43:31 GMT"></http> </request>
    <request> <http url="/images/accueil3.gif" method="GET" version="1.1" if_modified_since="Fri, 14 Nov 2003 02:43:31 GMT"></http> </request>

    <thinktime value="20" random="true"></thinktime>

    <request> <http url="/index.en.html" method="GET" version="1.1" ></http> </request>

  </session>
 </sessions>
</tsung>
The script really easy to understand and to modify.
Tsung Recorder
Tsung has a built-in proxy recorder to easily capture HTTP requests:
ubuntu@desktop:~$ ./tsung-recorder.sh
Usage: tsung-recorder.sh <options> start|stop|restart
Options:
    -p <plugin>    plugin used for the recorder
                     available: http, pgsql,webdav (default is http)
    -L <port>      listening port for the recorder (default is 8090)
    -I <IP>        for the pgsql recorder (or parent proxy): server IP
                      (default  is 127.0.0.1)
    -P <port>      for  the  pgsql recorder (or parent proxy): server port
                      (default is 5432)
    -u             for the http recorder: use a parent proxy
    -d <level>     set log level from 0 to 7 (default is 5)
    -v             print version information and exit
    -h             display this help and exit
To start the proxy recorder, run ./tsung-recorder.sh -p http start. The proxy is listening on port 8090 by default.
That was pretty boring stuff so let's explore the results now!
Tsung Results
To run a test, you can try one of the sample scripts bundled within the Tsung archive:
ubuntu@desktop:~$ tsung -f basic.xml start
Starting Tsung
Log directory is: /home/ubuntu/.tsung/log/20171013-1706
In the case Tsung fails with a crash dump, it's maybe because Erlang SSL is disabled. Enable Erlang SSL then.
Tsung has a Web UI running on http://localhost:8091/ once the test is running.

Since version 1.6.0, you can use the embedded web server started by the controller on port
8091. So for example if your controller is running onnode0, use the URLhttp://node0:8091/in your browser. It will display the current status of Tsung (see Dashboard ) and generate on the fly the report and graphs.
To Generate the HTML report, cd in the logs directory and run:
ubuntu@desktop:~/.tsung/log/20171013-1706$ /usr/lib/tsung/bin/tsung_stats.pl
warn, last interval (3) not equal to the first, use the first one (10)
No data for Bosh
No data for Match
No data for Event
No data for Async
No data for Errors
...
It should build the HTML report. In the case you see an error like this one:
Can't locate Template.pm in @INC (you may need to install the Template module) (@INC contains: /etc/perl /usr/local/lib/x86_64-linux-gnu/perl/5.22.1 /usr/local/share/perl/5.22.1 /usr/lib/x86_64-linux-gnu/perl5/5.22 /usr/share/perl5 /usr/lib/x86_64-linux-gnu/perl/5.22 /usr/share/perl/5.22 /usr/local/lib/site_perl /usr/lib/x86_64-linux-gnu/perl-base .) at /usr/lib/tsung/bin/tsung_stats.pl line 571.
You must install Perl Template Text:
sudo apt-get install libtemplate-plugin-gd-perl

I really thought Tsung was a crappy load testing tool, but I was completely wrong! The metrics provides (average, mean, count and more) are meaningful. the reporting isn't very sexy, but it's efficient and direct to the point.

Sure, they don't have material design, but who cares? It does the job pretty well. Tsung is definitely a positive surprise!
Other Tools
Those tools fall here either because they are pretty old, not much used or not maintained anymore. Does That mean those tools are not good enough? Absolutely not! In fact, some of them may have pretty solid core users which are happy with them.
I had the feeling it would bring much added value to test them all. Still, it's worth mentioning them.
Apache Siege
- Source Code: Github
- Contributors: 7
- Lines of Code: 50K+
- License:
- Inception Year: 2004
- Type: Command-Line
- Language: C
- Scripting: As code (Custom)
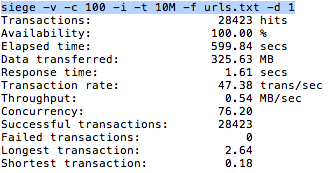
Siege is an http load testing and benchmarking utility. It was designed to let web developers measure their code under duress, to see how it will stand up to load on the internet. Siege supports basic authentication, cookies, HTTP, HTTPS and FTP protocols. It lets its user hit a server with a configurable number of simulated clients. Those clients place the server under siege.
Siege was written on GNU/Linux and has been successfully ported to AIX, BSD, HP-UX and Solaris. It should compile on most System V UNIX variants and on most newer BSD systems. Because Siege relies on POSIX.1b features not supported by Microsoft, it will not run on Windows. Of course you can use Siege to test a Windows server.
JCrawler

- Official Website: JCrawler
- Source Code: SourceForge
- Contributors: 2
- Lines of Code: 30K+
- License:
- Inception Year: 2004
- Type: GUI Based
- Language: Java
- Scripting: Point-And-Click
JCrawler is an open-source (under the CPL) Stress-Testing Tool for web-applications. It comes with the crawling/exploratory feature. You can give JCrawler a set of starting URLs and it will begin crawling from that point onwards, going through any URLs it can find on its way and generating load on the web application. The load parameters (hits/sec) are configurable.
Console mode in JCrawler allows to run test remotely and monitor, using little bandwidth. Configuration in JCrawler is very easy that you can do configuration in a central XML file which helps you to stop jumping from one tab to another of an overloaded GUI configuration.
OpenSTA

- Official Website: OpenSTA
- Inception Year: 2000
- Type: GUI Based
- Language: C
- Scripting: As code (XML)
OpenSTA is a distributed software testing architecture designed around CORBA, it was originally developed to be commercial software by CYRANO. The current toolset has the capability of performing scripted HTTP and HTTPS heavy load tests with performance measurements from Win32 platforms. However, the architectural design means it could be capable of much more.
Bees With Machine Guns
- Official Website: Bees With Machine Guns
- Source Code: BWMG on Github
- Contributors: 20+
- Lines of Code: 20K+
- License:
- Inception Year: 2010
- Type: Command-Line
- Language: Python
- Scripting: As code (Python)
A utility for arming (creating) many bees (micro EC2 instances) to attack (load test) targets (web applications).
Multi Mechanize
- Official Website: Multi-Mechanize
- Source Code: MM on Github
- Contributors: 10+
- Lines of Code: 10K+
- License: GNU LGPLv3
- Inception Year: 2010
- Type: Command-Line
- Language: Python
- Scripting: As code (Python)
This is an open source framework for performance and load testing that runs concurrent Python scripts to generate load.
Apache Bench

- Official Website: AB
- Inception Year: 2000
- Type: Command-Line
- Language: C
- Scripting: Command-line
ab is a tool for benchmarking your Apache Hypertext Transfer Protocol (HTTP) server. It is designed to give you an impression of how your current Apache installation performs. This especially shows you how many requests per second your Apache installation is capable of serving.
HTTPerf
- Official Website: HTTPerf
- Source Code: HTTPerf on Github
- Contributors: 8+
- Lines of Code: 10K+
- License:
- Inception Year: 2006
- Type: Command-Line
- Language: C
- Scripting: Command-Line
httperf is a tool for measuring web server performance. It provides a flexible facility for generating various HTTP workloads and for measuring server performance.
Artillery

- Official Website: Artillery
- Source Code: Artillery on Github
- Contributors: 19+
- Lines of Code: 10K+
- License:
- Inception Year: 2014
- Type: Command-Line
- Language: Javascript
- Scripting: Command-Line
Artillery is a modern, powerful, easy-to-use load-testing toolkit. Artillery has a strong focus on developer happiness & ease of use, and a batteries-included philosophy. Our goal is to help developers build faster, more resilient and more scalable applications.
Goad

- Official Website: Goad
- Source Code: Goad on Github
- Contributors: 17+
- Lines of Code: 30K+
- License:
- Inception Year: 2016
- Type: Command-Line
- Language: Go
- Scripting: Command-line
Goad is an AWS Lambda powered, highly distributed, load testing tool built in Go for the 2016 Gopher Gala. Goad allows you to load test your websites from all over the world whilst costing you the tiniest fractions of a penny by using AWS Lambda in multiple regions simultaneously.
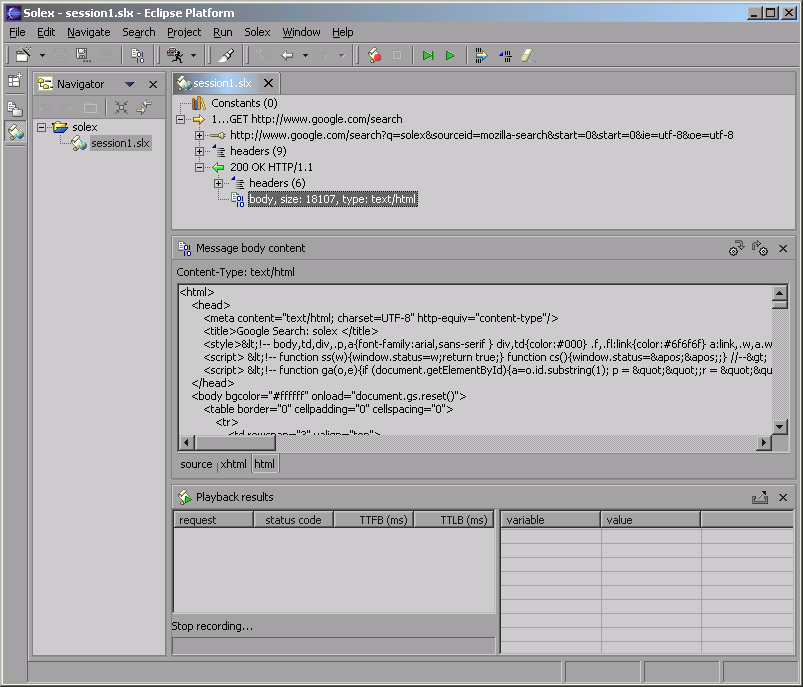
Solex
- Official Website: Solex
- Source Code: Solex on SourceForge
- Contributors: 1+
- Lines of Code: NA
- License:
- Inception Year: 2002
- Type: GUI Based
- Language: Java
- Scripting: Point-And-Click
Solex is a free open source Web application testing tool built as a plug-in for the Eclipse IDE. It provides functions to record a client session, adjust it according to various parameters and replay it later typically in order to ensure non regression of the application's behaviour (with stress testing capabilities being added at a later stage).
NGrinder

- Official Website: NGrinder
- Source Code: NGrinder on Github
- Contributors: 1+
- Lines of Code: 50K
- License:
- Inception Year: 2012
- Type: Web UI Based
- Language: Java
- Scripting: Point-And-Click
nGrinder is a platform for stress tests that enables you to execute script creation, test execution, monitoring, and result report generator simultaneously. The open-source nGrinder offers easy ways to conduct stress tests by eliminating inconveniences and providing integrated environments.
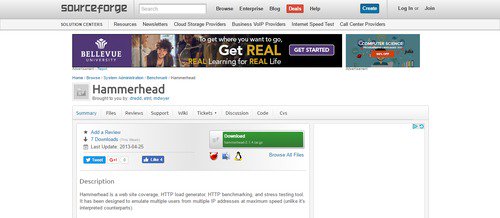
HammerHead
- Official Website: NGrinder
- Source Code: NGrinder on SourceForge
- Inception Year: 2000
- Type: Command-Line
- Language: C++
- Scripting: Point-And-Click
Hammerhead is a web site coverage, HTTP load generator, HTTP benchmarking, and stress testing tool. It has been designed to emulate multiple users from multiple IP addresses at maximum speed (unlike it's interpreted counterparts).
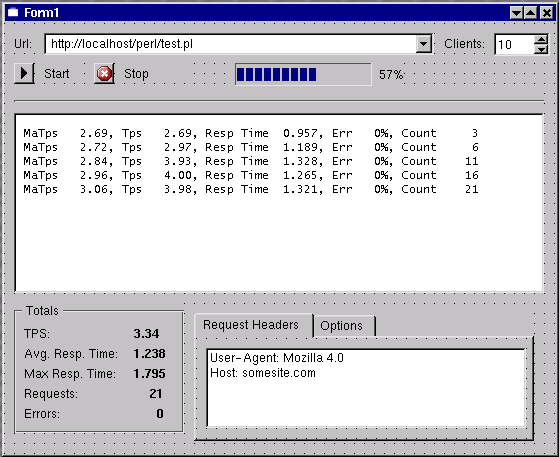
OpenWebLoad
- Official Website: OpenWebLoad
- Source Code: OpenWebLoad on SourceForge
- Inception Year: 2001
- Type: Command-Line
- Language: C++
- Scripting: As Code (Custom)
OpenWebLoad is a tool for load testing web applications. It aims to be easy to use and providing near real-time performance measurements of the application under test. This is particulary useful when you are doing optimization as you can see the impact of your changes almost immediately.
Legion

- Official Website: Legion
- Source Code: Legion on Github
- Contributors: 1+
- Lines of Code: 1K
- License:
- Inception Year: 2016
- Type: Command Line
- Language: Javascript
- Scripting: As Code
Legion is a load testing tool for HTTP servers and other kinds of software. It consists of two major components: legion-metrics, which collects and merges performance metrics from various sources; and legion-io, a Promise-based library that makes it quick and easy to describe a testcase.
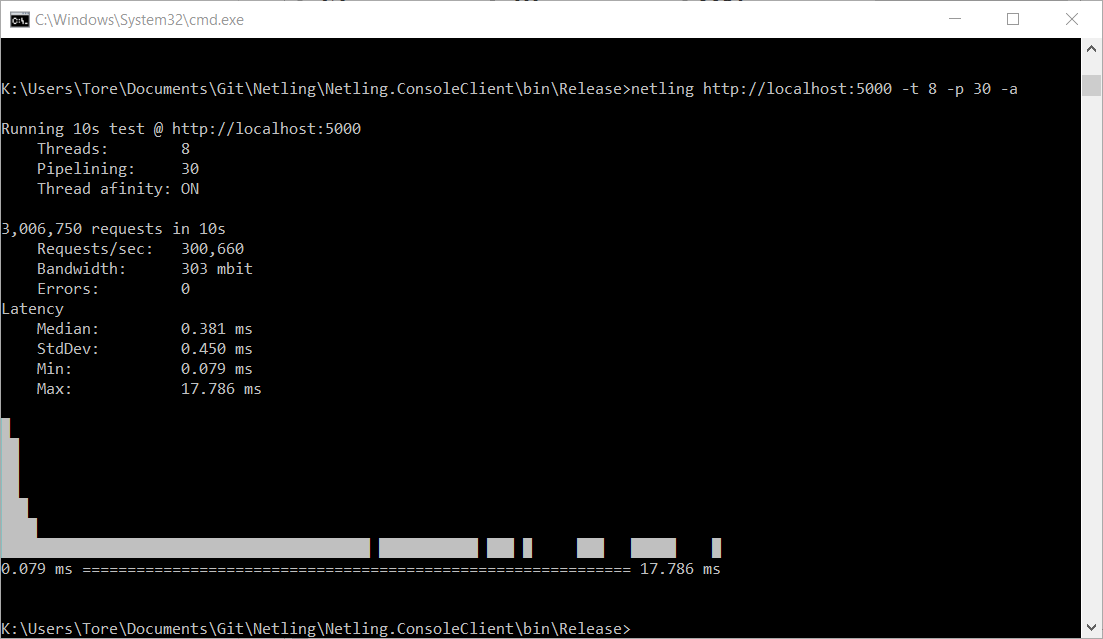
NetLing
- Official Website: NetLink
- Source Code: NetLink on Github
- Contributors: 4+
- Lines of Code: 20K
- License: MIT
- Type: Command-Line
- Language: C Sharp
- Scripting: As Code
Netling is a load tester client for easy web testing. It is extremely fast while using little CPU or memory.