Your monthly dose of new features
Now that we prepare to enter winter, our developers do not need an excuse to stay at home and code new features. Plus since the weather is cool here they will not be distracted by snow. Which is why even though our latest post about new features was just 6 weeks ago, here we are again with a new batch. Oh and don't worry for them, as long as we pay them 1€ at the end of each month; it's technically not slavery!
SLAs
The main feature of this release is SLAs. Which means you can now define SLAs for response times, hits/s, error rate and a lot of other metrics.
To do that, just create an SLA profile in the new SLA menu of the design page:
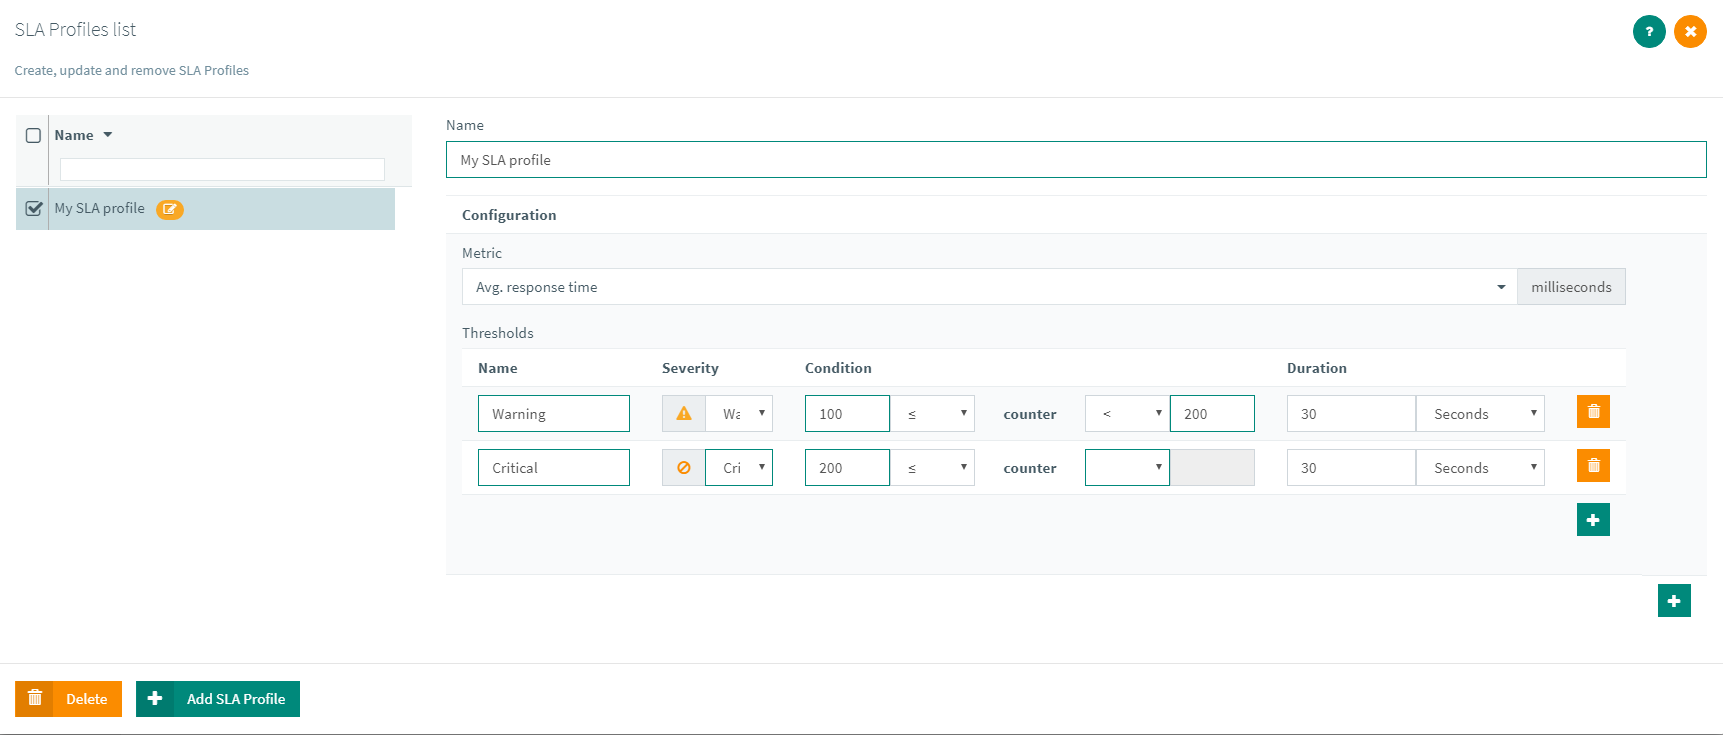
Configure it to your liking, and add as many profiles as you want.
Now on any item of the user tree you can add this SLA profile:
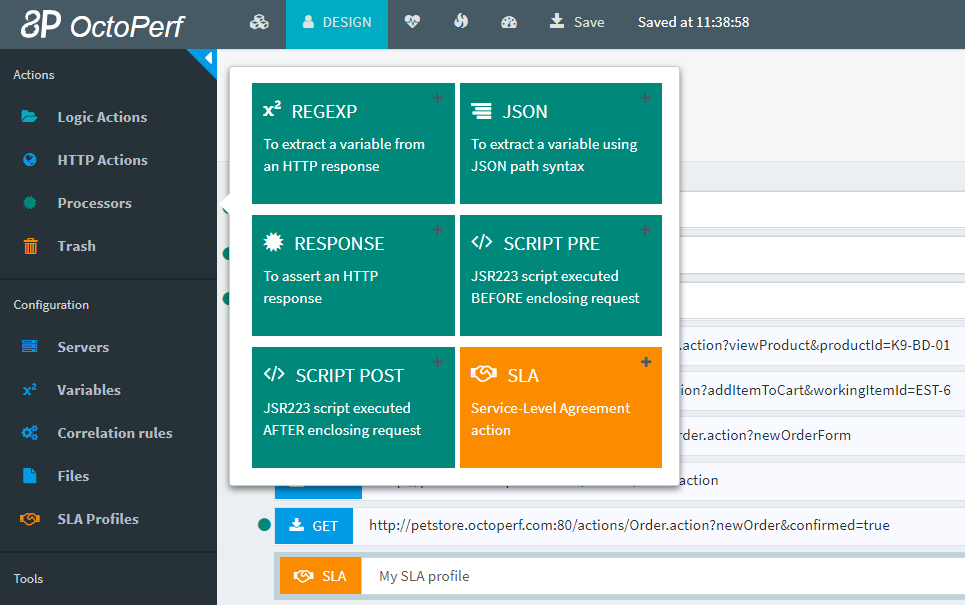
Which means that this SLA will apply to its parent node wether it is a request or a container.
In the report you can see SLA violations in the threshold table along with monitoring:

And of course in any linechart as well:
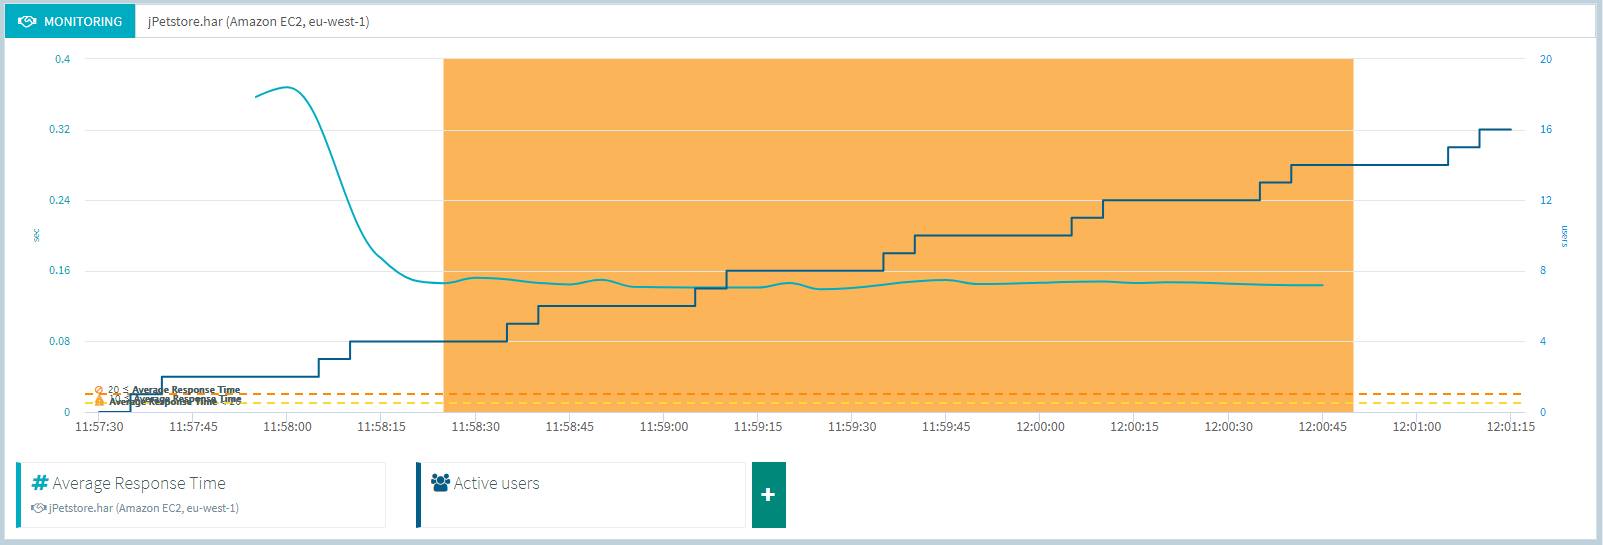
Thanks to this your test results will be much easier to read. And of course spotting a bottleneck will be even faster.
Jenkins plugin update
Thanks to the new possibilities offered by SLAs, we also updated our jenkins plugin. You can now automatically stop a test when an SLA or monitoring alert happens:
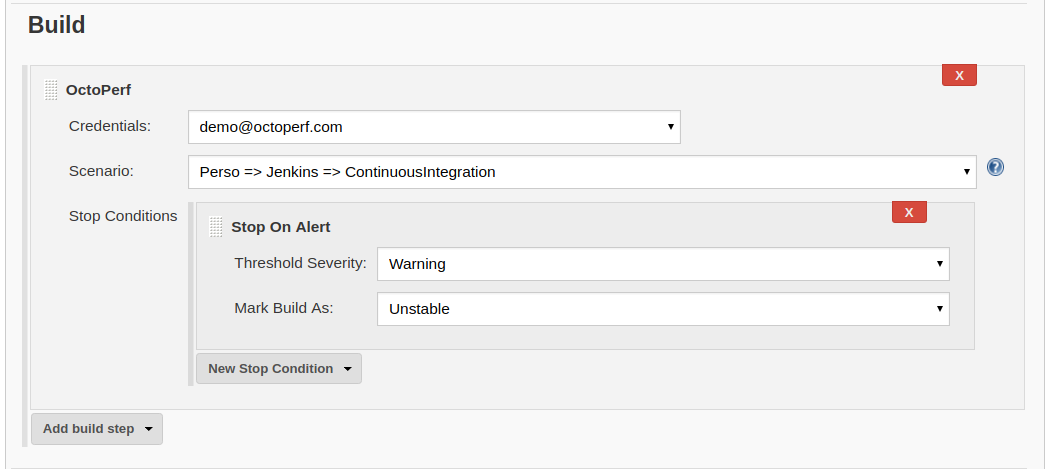
This way, even nightly tests can be conducted without supervision.
OctoPerf Jenkins plugin now also supports the pipeline syntax since version 3.2.0. Let's have a look at a quick Pipeline Script written in Groovy:
node {
    stage ('OctoPerf') {
        octoPerfTest credentialsId: 'XXXXXX-XXX-XXX-XXXX', scenarioId: 'XXXXXXX'
    }

    stage ('JunitReport') {
        junit 'junit-report.xml'
    }

    stage ('PerfReport') {
        perfReport modeThroughput: true, sourceDataFiles: '**/*.jtl'
    }
}
With this, automating your load tests will be much easier.
Report trend
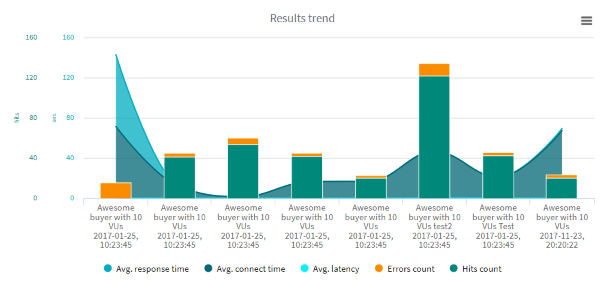
The report trend feature will display a new trend graph on the analysis page. The idea is to show the most relevant metrics for the last tests. We select up to 8 test reports by default but you can add/remove them at your leisure. And this trend graph can be used to open a report as well, just by clicking on it in the graph:

With this feature, you can quickly see if the results of a particular test stand out. It will also make the result selection much easier.
Report summary
Another topic we had to address was navigation through a test report. Since there are many informations in there, it could get confusing. To help with that we've added a summary inside the right panel:
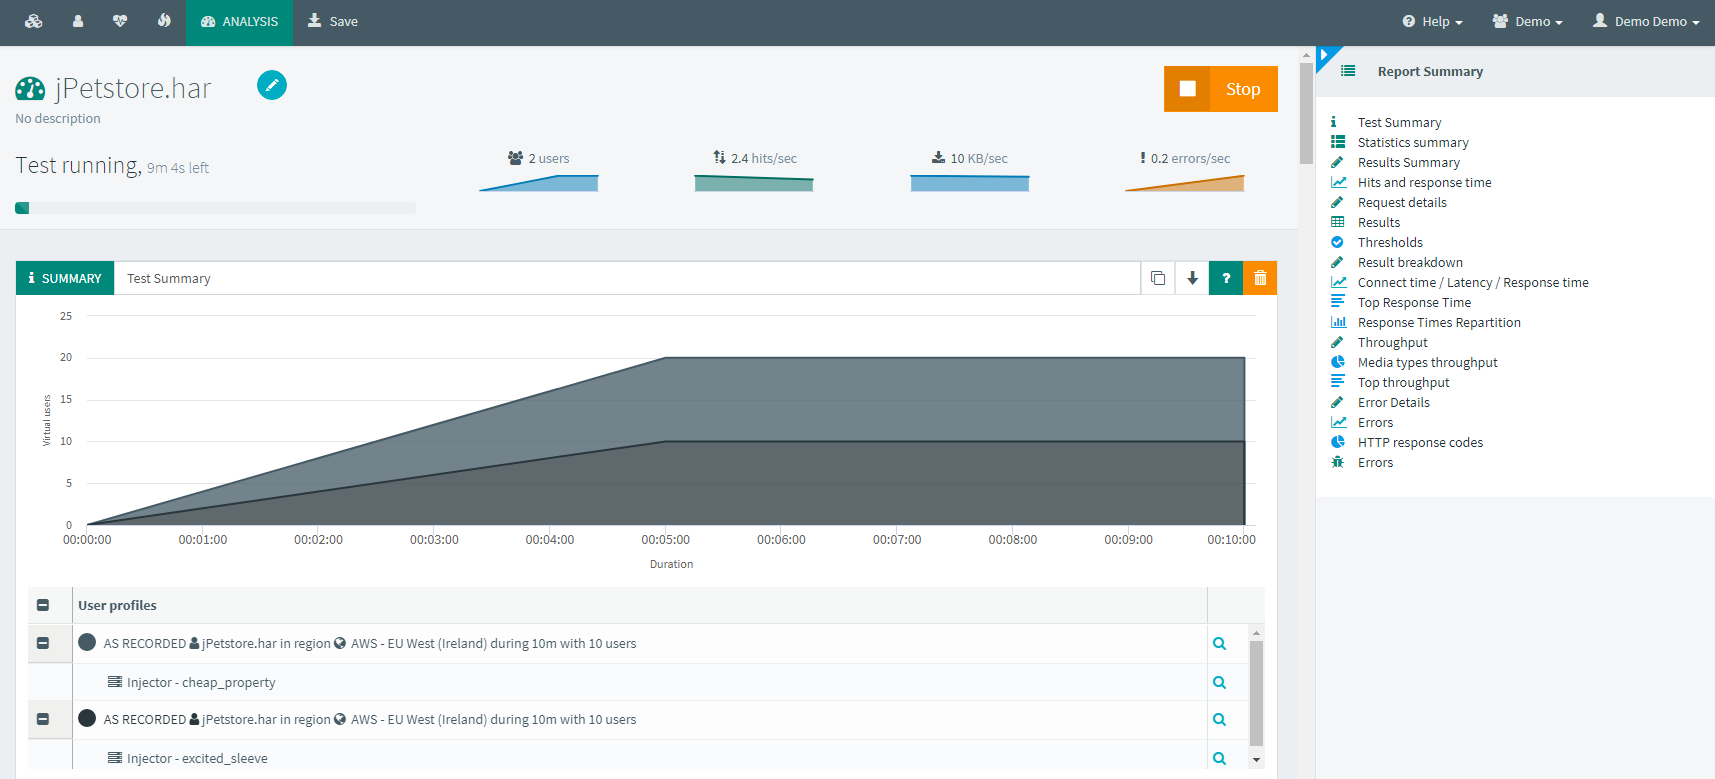
It can be collapsed if you do not need it. But this way navigation will be much faster.
Timeouts on server tab
We keep adding new things to the server page in the design section:
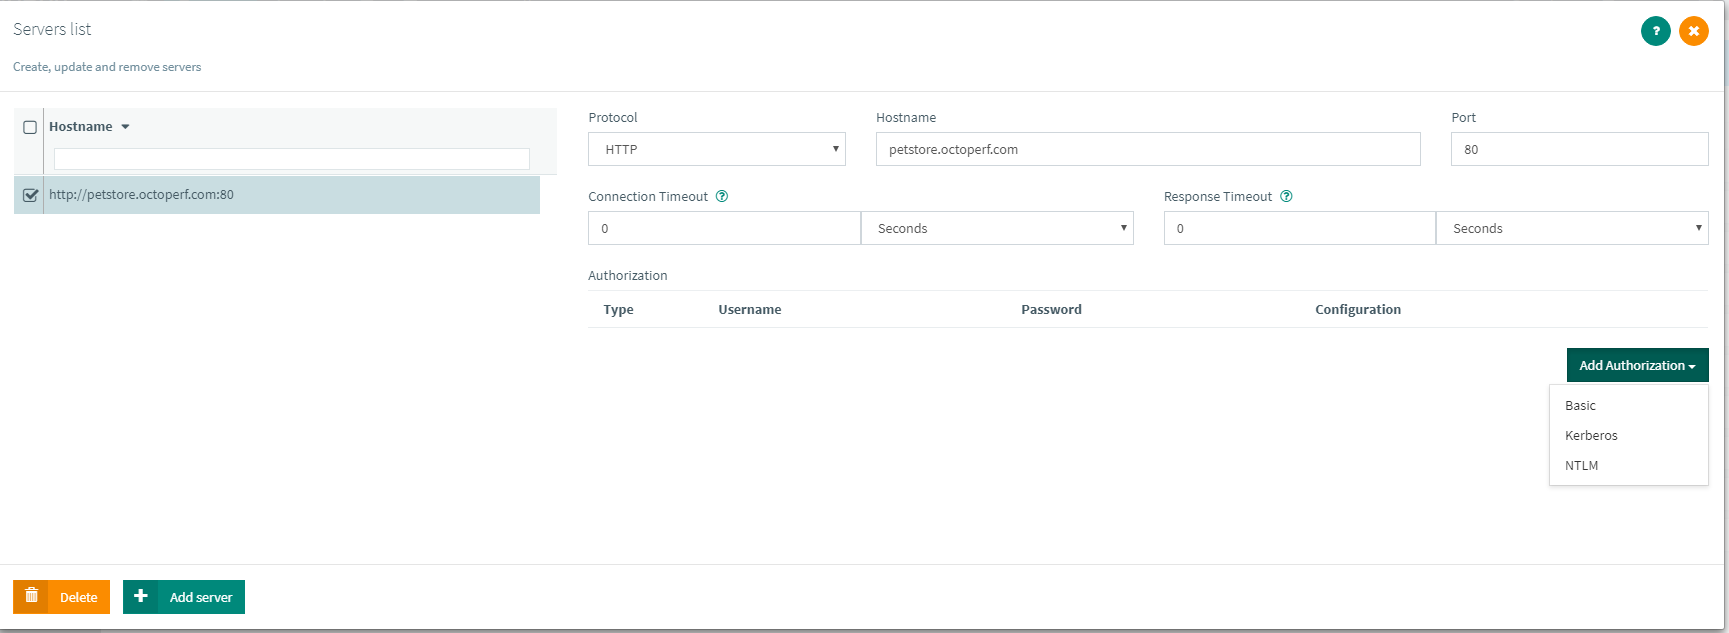
It's getting closer to what you can achieve with HTTP request defaults in JMeter now. We also improved how we handle authentication on this page.
New runtime interface
We have also reworked the runtime interface. Many new users were confused because it was not clear enough that you can add additional profiles. So we've added a large blue button to make it stand out.
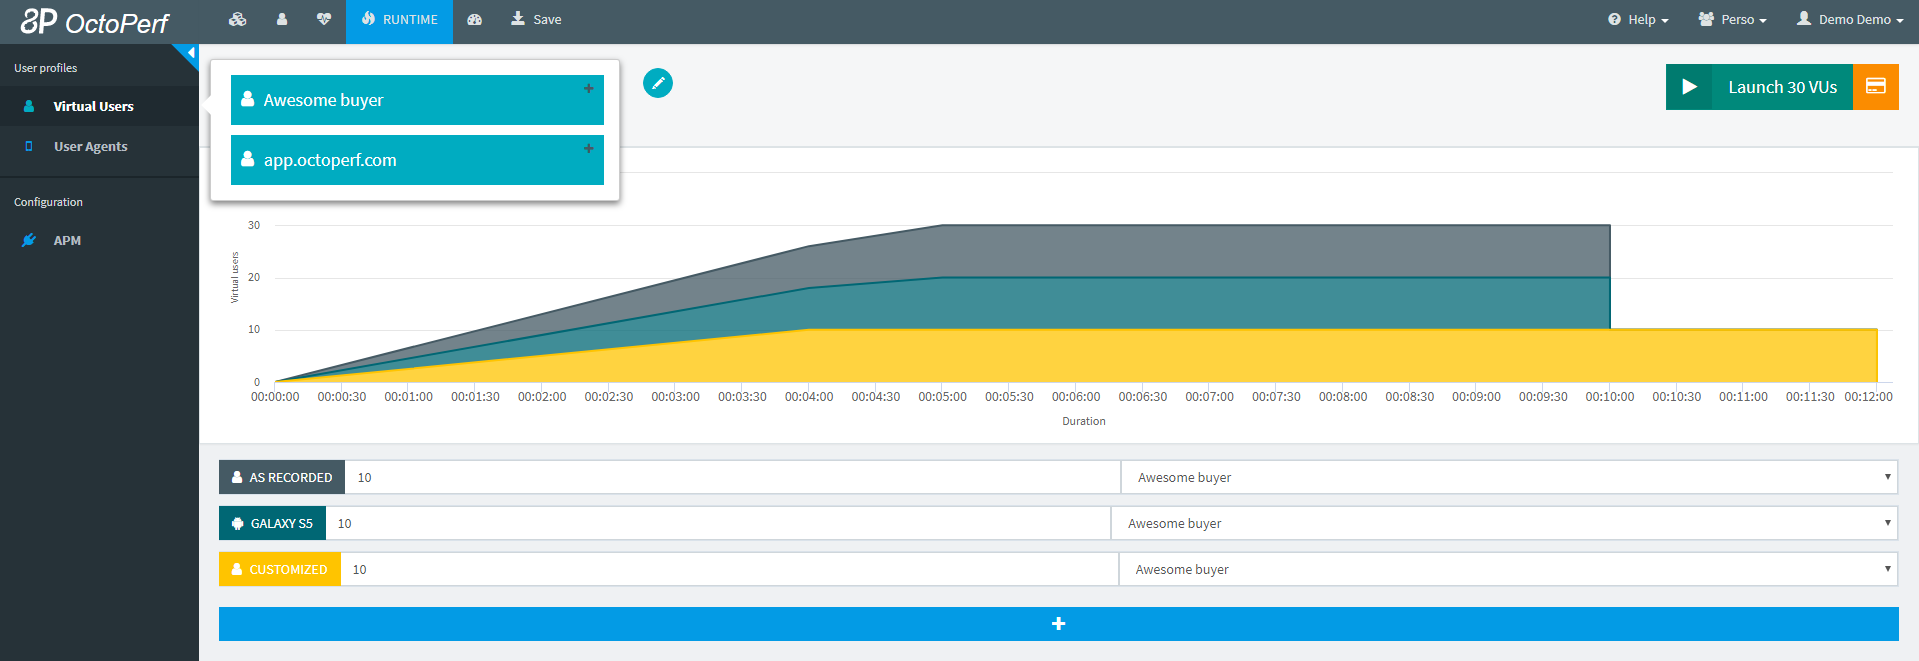
It was also the occasion to get rid of a confusing item. Creating profiles was based on device names and many users thought this meant real device emulation. When in reality it only means User agent simulation. To clarify we changed the labels to User Agents and Virtual Users.
LDAP
One of the biggest expectations for our enterprise edition was to integrate it with existing Single Sign On systems.
This is now possible through the LDAP protocol.
The procedure is detailed in our documentation: SSO through LDAP
Thanks to this you do not need to create user accounts in OctoPerf. Just plug OctoPerf to your LDAP and all existing users will be able to connect with their accounts.
Elasticsearch 5.6.4
And last but not least, we are keeping up to date with elastic search. Since it is important for security and performance, we will also be working on migration to elasticsearch 6 in a near future as well.
Conclusion
As you can see, we are still investing a lot of efforts to keep the development pace high. But as usual we also keep things clean so that this pace can continue in the future. Which means we will have plenty of surprises to unveil next year. I hope you will enjoy them as well!
