Angular Performance Optimization - OnPush Change Detection
In our previous blog post we saw why calling functions in Angular template expressions is bad practice and can have huge performance impact on your application.
Now it's time to take a look at Angular ChangeDetectionStrategy and see how it can help us improve the performances of our Angular applications.
Angular change detection cycle
Angular change detection periodically checks if the application state changed to update the DOM (what's rendered in the web page) accordingly.
Angular parses the components tree from the root to the leaves. In this blog post, you’ll learn how to measure and optimize performances of the change detection mechanism by skipping parts of your application and running change detection only when necessary.
Use case: Books list
To check and improve performances of the detection cycle we will create a simple application that displays a list of Books. Performances start to dramatically decrease around 100000 displayed books.
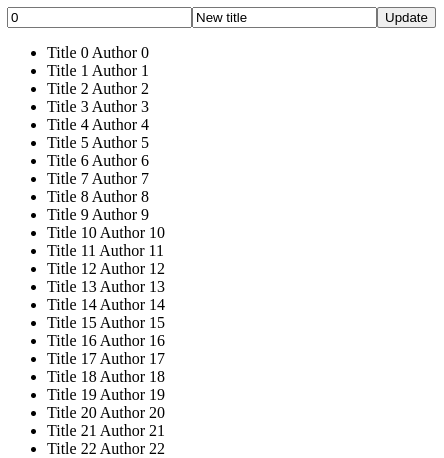
A simple form allows the user to update the title of a book by specifying its index and a new title.
A Book is a simple mutable bean, defined as follows:
export class Book {
  constructor(public id: number,
              public title: string,
              public author: string) {
  }
}
AppComponent
The base application component (generated using ng new) is updated to contain a form and a simple list (Array.from({length: 100000}).map() generates a list with a large number of entries):
import {Component, QueryList, TrackByFunction, ViewChildren} from '@angular/core';
import {Book} from "./book";
import {FormControl, FormGroup} from "@angular/forms";
import {BookChangeDetectorRefComponent} from "./book-change-detector-ref/book-change-detector-ref.component";

@Component({
  selector: 'app-root',
  templateUrl: './app.component.html',
  styleUrls: ['./app.component.scss'],
})
export class AppComponent {
  indexControl = new FormControl<number>(0, {nonNullable: true});
  titleControl = new FormControl<string>('New title', {nonNullable: true});
  formGroup = new FormGroup({
    index: this.indexControl,
    title: this.titleControl
  })

  books: Book[] = Array.from({length: 100000}).map((value, index) => new Book(index, `Title ${index}`, `Author ${index}`));

  updateBook(): void {
    const value = this.formGroup.getRawValue();
    const book = this.books[value.index];
    if (book) {
      book.title = value.title;
    }
  }
}
Since the book is mutable, we can update the title by setting its value to the form value (book.title = value.title) in the updateBook method.
The app.component.html HTML template simply displays the form and books list using the *ngFor directive:
<form [formGroup]="formGroup">
  <input type="number" [formControl]="indexControl">
  <input type="text" [formControl]="titleControl">
  <button (click)="updateBook()">Update</button>
</form>

<ul>
  <li *ngFor="let book of books">
    <app-book [book]="book"></app-book>
  </li>
</ul>
BookComponent
The books are displayed using a dedicated BookComponent that could hardly be made simpler:
import {Component, Input} from '@angular/core';
import {Book} from "../book";

@Component({
  selector: 'app-book',
  templateUrl: './book.component.html',
  styleUrls: ['./book.component.scss']
})
export class BookComponent {

  @Input() book!: Book;

}
It's just a Book @Input displayed in the book.component.html HTML template:
{{book.title}} {{book.author}}
When interacting with the application, we can feel that performances are suffering from the large number of books displayed: there is a perceptible input lag when typing values in the form or clicking on the Update button.
But that's just a user feeling: we need a pragmatic way to measure the lag!
Measure the change detection cycle time
Let's see how we can measure the Angular change detection cycle execution time!
There are two options:
- Angular Debug Tools to measure detection cycles duration in the browser console,
- Angular Devtools to profile performances using a Chrome extension.
Angular Debug Tools
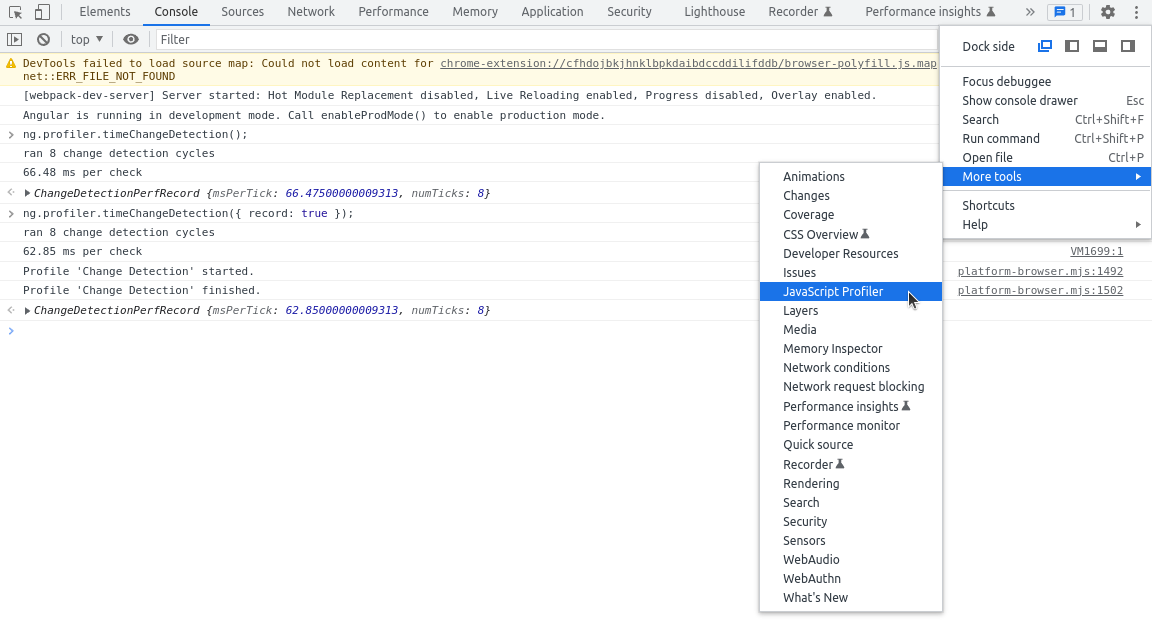
Angular debug tools allows to see how long the detection cycles take by typing a command in the Chrome console (press F12 to open the console):

Here we can see that the detection cycle takes around 60ms to execute.
But first we need to update the main.ts file of our Angular application to enable this debug option:
import {ApplicationRef, enableProdMode} from '@angular/core';
import {platformBrowserDynamic} from '@angular/platform-browser-dynamic';

import {AppModule} from './app/app.module';
import {environment} from './environments/environment';
import {enableDebugTools} from "@angular/platform-browser";

if (environment.production) {
  enableProdMode();
}

platformBrowserDynamic().bootstrapModule(AppModule)
  .then((module) => {
    const appRef = module.injector.get(ApplicationRef);
    const appComponent = appRef.components[0];
    enableDebugTools(appComponent);
  })
  .catch(err => console.error(err));
After adding the call to enableDebugTools() in your application Bootstrap, you can type ng.profiler.timeChangeDetection(); in the browser console to get an average duration of several detection cycles.
Record execution
Another available command that can be typed in the web browser console is ng.profiler.timeChangeDetection({ record: true });.

The result can be seen by enabling the Javascript Profiler tab in your Chrome console:
- Click on the dots icon in the upper right corner of the console,
- Select the More tools menu,
- Click on the Javascript Profiler menu item.
Then you can open the Javascript Profile tab to see the record and get more precise performance metrics:
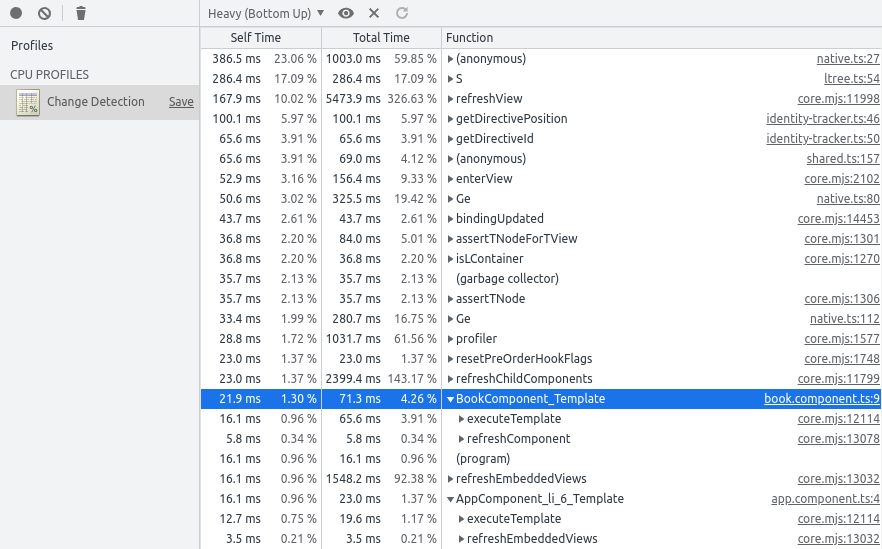
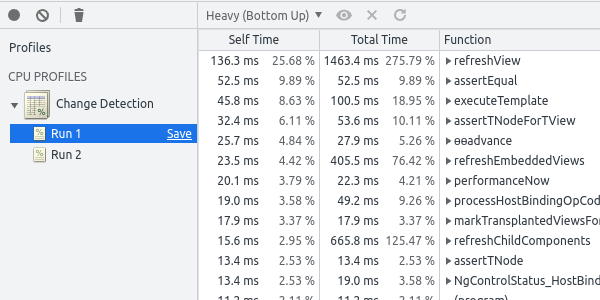
Here we can see that the update of our AppComponent template took 16.1ms and the BookComponent took 21.9ms.
That information is not very insightful for such a small application, but a drill-down of performances can be interesting for larger uses cases.
Having to type a command in the console, this tool is limited to giving us performance metrics only when the application is idle (no user interaction). That's still a very important information as the cycle should not take long when there are no user interactions or the lag will be perceptible.
Angular Devtools
Another solution is to install Angular devtools plugin for chrome. It's a better option to check performances during interactions with the application as this plugin allows us to record performance metrics during a period of time.
First install the plugin for Chrome or FireFox.
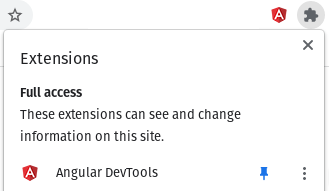
Then activate it by clicking on the Extensions menu (upper right corner of Chrome web browser):
Finally, open the console and select the Angular > Profiler tab (only available if the current browser tab displays an Angular application):

Back to our Books list application, if we click on the Record button in the profiler, then submit a modification to a book title, we can see how long it took to compute the update:
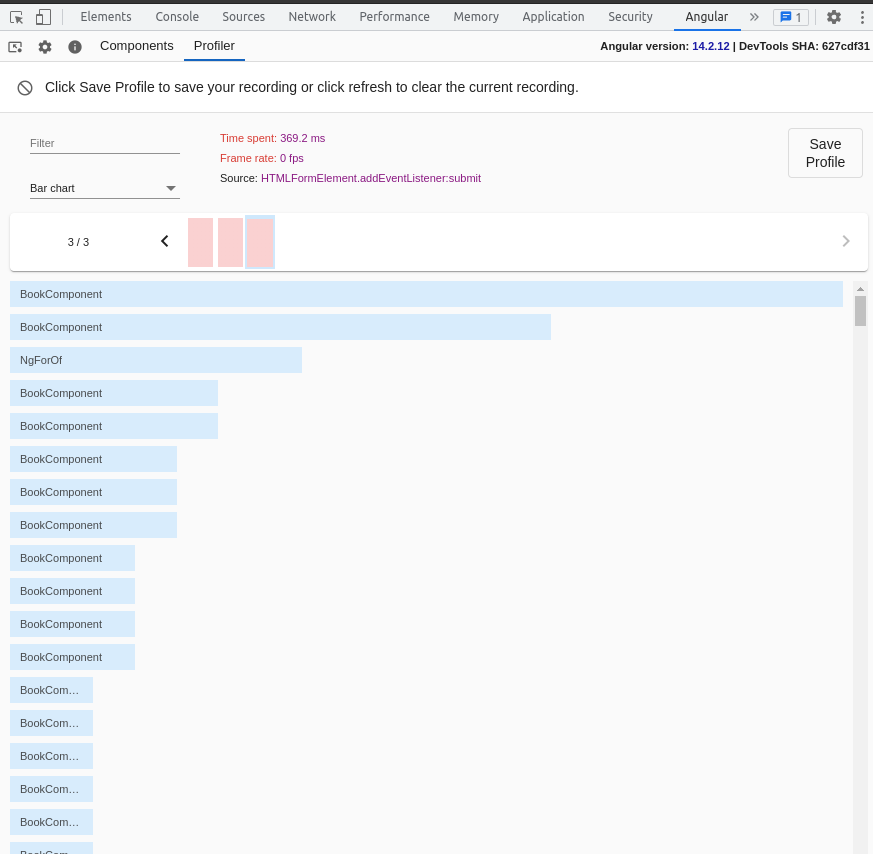
Among all information displayed by the profiler we can note:
- That the form submit took 369ms,
- That a huge number of BookComponent were impacted by this update!
Default Change detection strategy KPI
To sum up the performance metrics of our Books list application using the default change detection strategy ChangeDetectionStrategy.Default:
- The
ng.profiler.timeChangeDetection();console command tells us that a detection cycle takes a bit more than 300ms to execute (idle application), - The Angular DevTools shows that updating a book in the list take around 370ms.
How can we play with ChangeDetectionStrategy options to improve performances?
Using OnPush Change detection strategy
Setting the change detection strategy to OnPush is pretty simple.
BookComponent update
We "just" need to configure it on the BookComponent @Component annotation:
import {Component, Input} from '@angular/core';
import {Book} from "../book";

@Component({
  selector: 'app-book',
  templateUrl: './book.component.html',
  styleUrls: ['./book.component.scss'],
  changeDetection: ChangeDetectionStrategy.OnPush
})
export class BookComponent {

  @Input() book!: Book;

}
Making the application work properly with the OnPush strategy is another story! If we interact now with the Books list application, we can this that a click on the Update button has no effect whatsoever.
Using ChangeDetectionStrategy.OnPush informs Angular that our component only depends on its inputs to trigger the detection of changes to be made to the DOM.
But since we only updated the title of the book, the object reference did not change, preventing the detection by Angular!
AppComponent update
We must change the AppComponent.update() method to create a new Book object instead of updating the existing one, thus updating the object reference in the this.books array:
export class AppComponent {
    update(): void {
        const value = this.formGroup.getRawValue();
        const book = this.books[value.index];
        if (book) {
            book.title = value.title;
            const updated = new Book(book.id, value.title, book.author);
            this.books[value.index] = updated;
        }
    }
}
With this modification the change detection is properly triggered by the update method and the application behaves normally.
Note:
Making your application work with
OnPushChange detection strategy can be much harder than that, especially if your are not already using immutable objects.
OnPush Change detection strategy performances
Now we can take a look at the impact in terms of performances.
First, the timeChangeDetection() debug method gives us 116ms per check (300ms previously):

Then, the profiler gives us around 140ms (369ms previously) to handle the Book update:
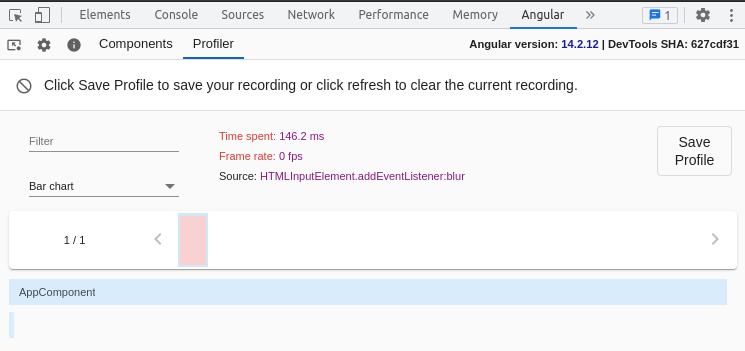
We can also note than only the AppComponent update takes time. There are not many BookComponent updates like with the previous (default) change detection strategy.
So we more than doubled the application performances by using the ChangeDetectionStrategy.OnPush option!
Object immutability and builders
We saw that updating a book would not work using the OnPush change detection strategy.
At OctoPerf we develop a SaaS load testing solution. We think that objects must be immutable both for our Java backend and our Angular front. Object immutability is great both for code maintainability and application performances.
The Book entity can be rewritten as an immutable object simply by adding the readonly keyword, preventing potential bugs caused by changes detection:
export class Book {
  constructor(public readonly id: number,
              public readonly title: string,
              public readonly author: string) {
  }
}
At OctoPerf we heavily relly on Object Builders and created an interface that is used across the whole application:
export interface Builder<T> {
  build(): T;
  from(t: T): Builder<T>;
}
But what if you are not convinced by the benefits of objects immutability? Is there another solution to use the OnPush change detection strategy?
Using the ChangeDetectorRef
Yes there it is: you can inject a ChangeDetectorRef instance and use it to tell Angular that some changes should be detected!
Let's rewrite our BookComponent and expose a public method updateTitle to update the current book title:
import {ChangeDetectionStrategy, ChangeDetectorRef, Component, Input, OnInit} from '@angular/core';
import {Book} from "../book";

@Component({
  selector: 'app-book',
  templateUrl: './book.component.html',
  styleUrls: ['./book.component.scss'],
  changeDetection: ChangeDetectionStrategy.OnPush
})
export class BookComponent {

  @Input() book!: Book;

  constructor(private changeDetectorRef: ChangeDetectorRef) {
  }

  public updateTitle(title: string): void {
    this.book.title = title;
    this.changeDetectorRef.detectChanges();
  }
}
The call to this.changeDetectorRef.detectChanges() tells Angular to check the current view and its children for potential changes.
Now, the responsibility to update the book title was taken from the AppComponent and given to BookComponent.
In the parent component, we simply inject the list of BookComponent using the Angular @ViewChildren annotation and call the updateTitle() method of the proper BookComponent:
import {Component, QueryList, ViewChildren} from '@angular/core';

export class AppComponent {
    @ViewChildren(BookComponent) bookComponents!: QueryList<BookComponent>;

    updateBookChangeDetectorRef(): void {
        const value = this.formGroup.getRawValue();
        this.bookComponents.get(value.index)?.updateTitle(value.title);
    }

}
That's another approach, and it's up to your development habits and coding standards to choose between the two options.
changeDetectorRef.detectChanges() performances
The application performances are similar to the previous option. The timeChangeDetection() debug method gives us 115ms per check:

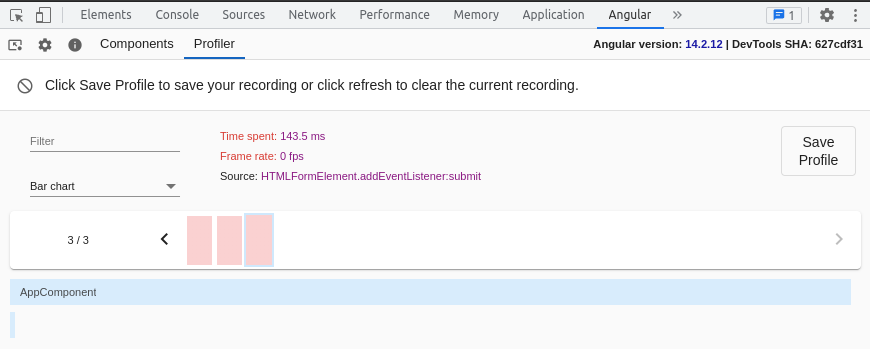
Then, the profiler gives us around 140ms to handle the Book update:
Conclusion
Even though using the OnPush change detection strategy allowed us to double to performances of our application, there are still other paths to explore in order to have a proper user experience with such a large number of items displayed:
- Using Virtual Scroll to only display a part of the Books list,
- Using trackBy to handle additions and removals.
Important:
Setting the OnPush change detection strategy on a component enables this behavior for itself but also for all its children! Keep that in mind if you want to use it in you Angular projects.
