
JMeter Beanshell Server
The Beanshell Interpreter in JMeter can act as a server which as stated in the JMeter documentation is accessible by telnet or http.
So what, I hear you say, well this can be useful and we will explore some of these uses in this Blog Post.
Before we move on the definition of a Beanshell can be found on the official Web Site.
But at a high level:
You can use BeanShell interactively for Java experimentation and debugging as well as to extend your applications in new ways. Scripting Java lends itself to a wide variety of applications including rapid prototyping, user scripting extension, rules engines, configuration, testing, dynamic deployment, embedded systems, and even Java education.
In short, BeanShell is dynamically interpreted Java, plus a scripting language and flexible environment all rolled into one clean package.
So effectively the Beanshell can dynamically change properties or variables while the test is running.
What can we use this for?
The answer to this is for your longer running tests, a Soak test for example.
If you have shorter tests that run for an hour and during execution you realise that the load is to low, or high and you need to change this then you would probably be happy to stop the test, recalculate the threads or transaction rate values and start again.
If you were running a longer test and you had already been running for several hours you would feel disappointed if you had to stop your test, reconfigure it and start again.
In addition to the test above, you may want to create an exploratory test to find the limits of your system and therefore want to scale and flex the load in real time as you monitor its behaviour.
Using the Beanshell Interpreter can help and here is how.
Setting the server up
Find the jmeter.properties file in the bin folder of your JMeter directory:

Open the file and find the BeanShell configuration section:

You need to make sure that both these lines are uncommented:
beanshell.server.port=9000
beanshell.server.file=../extras/startup.bsh
Once the changes have been made, start JMeter, you should see this in your console window:

Once that is done it is time to check the server is running.
Start a command prompt and change directory to the JMeter bin folder. Execute this command to check the server is running:
java -jar ../lib/bshclient.jar localhost 9000 ../extras/remote.bsh
We are effectively executing the bshclient.jar that exists in the lib folder on port 9000 of the localhost and asking it to execute a file called remote.bsh that exists in the extras folder.
If you server is running correctly the output will look like this:

Building a simple test
To demonstrate how we can change properties of a test as it is running we need to first build a simple test. The resulting JMX is available for download here.
We will create a test with two dummy samplers running in their own Thread Group.
Each sampler will have its own Constant Throughput Timer to manage the load distribution across the test.

The values for:
- Number of Threads
- Duration
- Target Throughput
Have been replaced in both Thread Groups.
The first Thread Group is configured like this:

With the Constant Throughput Timer configured like this:

The second Thread group is the same. Only the properties name end in Two rather than One. This means we have six properties we need to set for the test to run.
There are several ways to set these whether it’s in the form of a flat file that you define on the command line when running your test, or whether you specify the values explicitly on the command line, or whether you use another technique to pass the values in.
We just need to ensure that they are configured as properties and not variable or hardcoded. For the purposes of this example we will create a setup Thread Group with a JSR223 Sampler to define the starting values for all these Properties.

This is the code from the JSR223 Sampler.
// Define the properties
props.put("noThreadsOne","2");
props.put("testDurationOne","120");
props.put("throughputOne","480");
props.put("noThreadsTwo","2");
props.put("testDurationTwo","120");
props.put("throughputTwo","480");
This should give us a two minute test with each sampler being executed at a rate of four per second.
If we add a Simple Data Writer to the test, we can output the test results and produce some reports and graphs.
After the test has run we see this in the output:

This shows us that our test using Properties for the values that determine load and duration are working.
Changing the load during runtime
The first thing we are going to do is create a file called OctoPerf.bsh available for download here.
And we are going to save this in the extra’s folder of our JMeter installation.
The content of this file is:
print("Current throughput for Sampler One");
printprop("throughputOne");
print("Current throughput for Sampler Two");
printprop("throughputTwo");

setprop("throughputOne", "960");
setprop("throughputTwo", "960");

print("Updated throughput for Sampler One");
printprop("throughputOne");
print("Updated throughput for Sampler Two");
printprop("throughputTwo");
This file sends instructions to the Beanshell Interpreter to
- Print the throughput rates the test is running at
- Updates the throughput rates to 960 for the duration of the test (double what we have)
- Print the throughput rates after the update
If we now start our test and then about half way through its execution, we will push this file at the Beanshell Interpreter using the command we used at the start of this post but with our new .bsh file.
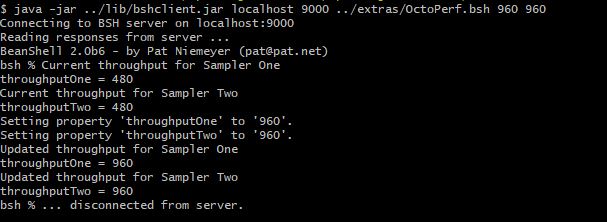
java -jar ../lib/bshclient.jar localhost 9000 ../extras/OctoPerf.bsh
As before we run this from our bin directory, only because that is where the relative paths to both the .jar file and .bsh file is, it could be executed from anywhere if the paths to the files are updated accordingly.
After execution of the command we see this on the command line:

If we now look at a graph of the transactions per minute for the test once it has completed we can see where the change in throughput command was received by the Beanshell Interpreter and applied to the test during execution.

Adding more complexity
If we think back to our reasons why this approach will help in your performance testing, we suggested the ability to flex and change your longer running tests or to perform some exploratory testing over longer periods of time.
We may therefore want to change the values multiple times during our tests, one approach would be to have multiple .bsh files but a better option is to pass values in on the command line when you run the Beanshell command.
Let’s look at an example of this and update our octoPerf.bsh to be:
updateThroughputOne = Integer.decode(args[0]);
updateThroughputTwo  = Integer.decode(args[1]);
print("Current throughput for Sampler One");
printprop("throughputOne");
print("Current throughput for Sampler Two");
printprop("throughputTwo");

setprop("throughputOne", updateThroughputOne.toString());
setprop("throughputTwo", updateThroughputTwo.toString());

print("Updated throughput for Sampler One");
printprop("throughputOne");
print("Updated throughput for Sampler Two");
printprop("throughputTwo");`
What we are now doing is writing two arguments taken from the command line to the variables
- updateThrougputOne
- updateThroughputTwo
and then setting the properties to the values we have passed in.
We now start our test and then about a third of the way through its execution, we will push this file at the Beanshell Interpreter we used earlier. This time with command line arguments to alter the load. And then we will repeat the process about two-thirds through the test with different values.
The first time we run our command we will send:
java -jar ../lib/bshclient.jar localhost 9000 ../extras/OctoPerf.bsh 960 960
Which will have the same effect as we saw in the hardcoded value test, we will then send
java -jar ../lib/bshclient.jar localhost 9000 ../extras/OctoPerf.bsh 480 1440
This will reduce the first sampler back to the original rate and further increase the second sampler.
We can see the output from the first command above.
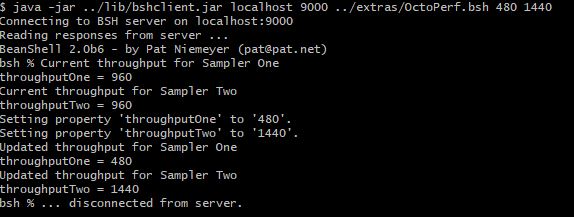
And the output from the second command.
The transaction per minute graph shows us where the load was altered as we executed our Beanshell commands:

Conclusion
If you want to create a complex scenario that varies the load on your application under test, then the best approach is to write a specific test to do this.
If you want to flex tests that may have been running for a while, such as a Soak test and to re-start the test would take too much time, or you want to explore the limits of your system as you increase and decrease volumes and load, then this approach is extremely useful.
Note that OctoPerf has a similar mechanism through live edition of properties.