
JMeter ecosystem for your Performance test through docker-compose, monitor, and mock your services
If you'd like to carry out load tests in a simple way, benefit from a simplified configuration with a focus on writing your test plan and its test typology, have the opportunity to monitor through detailed dashboards, store your metrics, and also mock one or several services: you are at the right place!
With this kind of configuration you will be able to make shift-left performance testing as well!
docker-compose is a small library that allows you to run docker-compose This is useful to bootstrap test environments.
Docker Compose offers a multitude of benefits which I'll detail below:
- Simplified configuration: Docker Compose lets you define and manage all the services of a multi-container application in a single YAML file. This makes it easy to configure, start and stop all the containers in an application.
- Automated deployment: With a single configuration file, you can automate the deployment of all the services required for your application, reducing manual errors and improving consistency between development, test and production environments.
- Managing dependencies : Compose makes it easy to manage dependencies between services. You can define the startup order of containers and the links between them, ensuring that all services start up in the right order and are properly connected.
- Portability: Once you've defined your Compose file, you can easily share it and run it on different machines. This ensures that developers and operational teams work in identical environments, reducing compatibility problems.
- Service isolation: Docker Compose creates isolated networks for containers, ensuring that each service operates in a partitioned environment. This improves security and enables services to be tested without mutual interference.
- Scalability: Compose makes it easy to scale services. You can quickly adjust the number of containers for a particular service by simply modifying the configuration file and redeploying.
- Local development and easy testing: Developers can use Docker Compose to create local development environments that faithfully reproduce production environments. This enables problems to be detected and resolved early in the development cycle.
- CI/CD integration: Docker Compose integrates well with continuous integration and deployment (CI/CD) pipelines. You can use Compose files to orchestrate automatic tests and deployments in your CI/CD workflows.
- Simplified maintenance: With Docker Compose, updating configurations and services becomes simpler. You can update container images or modify configurations by modifying the Compose file and redeploying services.
Docker Compose configuration
I assume that you have installed a version of docker on the host that will run the performance test in non-distributed mode.
Regarding explanations about Dockerfile you can read my previous post on OctoPerf's blog, I've described how to use a Dockerfile, and the common instructions we can run with it, as wells as the entrypoint.sh file.
Quick tree overview :
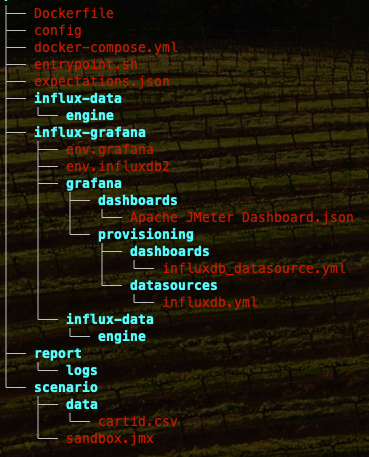
Docker Compose file
Let's take a closer look at the Docker Compose file! There will be 4 services created and run together: a JMeter container, an Influxdb container, a Grafana container, and a mockserver container.
services:
  jmeter-main:
    build:
      context: .
      args:
        - JMETER_VERSION=${JMETER_VERSION}
    container_name: main
    user: 0:0
    environment:
      PROJECT: ${PROJECT}
      BASE_DIR: ${BASE_DIR}
    volumes:
      - ./scenario:/scenario
      - ./report:${BASE_DIR}/${PROJECT}/results
      - ./report/logs:${BASE_DIR}/${PROJECT}/logs
      - ./entrypoint.sh:/opt/entrypoint.sh
In this extract from the docker compose file, we're going to define the first service to be built from the supplied Dockerfile, called "main". We just need to specify which JMeter version we want to use.
When you run the command docker-compose up Docker Compose reads the docker-compose.yml file to determine which services to start.
For each service defined in docker-compose.yml, if a Docker image is not specified but a build context is provided, Docker Compose will fetch a Dockerfile from the specified directory and build the image from it.
In Docker Compose, the volumes section lets you mount volumes from your local file system to a specific path inside the container.
Here after a quick description :
volumes:
  - <local_path>:<in_container_path>
Variables have been defined and are used in this service.
They have been declared in the .env file, detailed as below :
BASE_DIR=/opt/jmeter/
PROJECT=sandbox
JMETER_VERSION=5.6.3
InfluxDB Service
Next, we will see how to declare the influxdb service :
  influxdb:
    image: influxdb:latest
    container_name: influxdb2
    ports:
      - "8086:8086"
    env_file:
      - ./influx-grafana/env.influxdb2
    volumes:
    - /influx-data:/var/lib/influxdb2
InfluxDB 2 is a new-generation time series database. It is designed to store and manage time series data, such as sensor measurements, performance metrics, monitoring data and events. Since I want to use an influxdb version 2 image, I'm using the latest version from docker hub.
Port mapping in Docker Compose enables container ports to be redirected to host machine ports. Here's how it should look like :
ports:
  - <host_port>:<container_port>
env_file
Specifies a file containing environment variables.
This file is located at ./influx-grafana/env.influxdb and contains key-value pairs. In our example I've defined environment variables that are passed to the container when it starts up into the env.influxdb2 file.
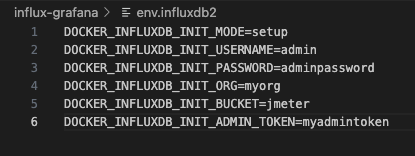
Feel free to hide this information in other execution contexts, here it's purely to explain how it works.
They enable you to configure the container's behavior without modifying its image, here are some of them:
- DOCKER_INFLUXDB_INIT_MODE: Database initialization mode (here, setup to initialize a new InfluxDB instance).
- DOCKER_INFLUXDB_INIT_USERNAME: Username of initial administrator.
- DOCKER_INFLUXDB_INIT_PASSWORD: Initial administrator's password.
- DOCKER_INFLUXDB_INIT_ORG: Initial organization created in InfluxDB.
- DOCKER_INFLUXDB_INIT_BUCKET: Initial Bucket (logical database) created in InfluxDB.
- DOCKER_INFLUXDB_INIT_ADMIN_TOKEN: Initial administrator token for secure access.
- volumes:
- /influx-data: Directory on the host machine where InfluxDB data will be stored.
- /var/lib/influxdb2: Directory inside the container where InfluxDB stores its data.
This means that data generated by InfluxDB in the container will be saved in ./influx-grafana/influx-data on the host machine. So, even if the container is shut down and deleted, the data will remain intact and can be reused by a new container.
To finish, once we will execute the docker-compose file, you will be able to check the influxdb2 details here: http://localhost:8086/signin
Grafana Service
Next part, the Grafana service :
  grafana:
    image: grafana/grafana:latest
    container_name: grafana-docker-compose
    ports:
      - "30000:3000"
    env_file:
      - ./influx-grafana/env.grafana
    volumes:
      - ./influx-grafana/grafana/provisioning/:/etc/grafana/provisioning/
      - ./influx-grafana/grafana/dashboards/:/var/lib/grafana/dashboards/
Grafana is a powerful and flexible tool for data visualization and monitoring, mainly used to create interactive dashboards and graphs from a variety of data sources.
Again, I want to use the latest grafana image, so I pull the latest image from docker hub.
The port mapping is "30000:3000", so you will be able to check Grafana's dashboard here http://localhost:30000.
The env_file is simply used to define an admin account, with password "admin".
As always feel free to modify these information according to your context, they are here to explain help you understand these new concepts with concrete examples.
Regarding the volumes part, they are used to configure the right information to setup our influxdb2 database properly, and also use a custom dashboard for Grafana to monitor our performance test. Note that this dashboard has been adapted to work with a bucket named jmeter.
influxdb_datasource.yml:
apiVersion: 1

providers:
- name: 'Influx-Jmeter'
  orgId: 1
  folder: ''
  type: file
  disableDeletion: true
  editable: true
  options:
    path: /var/lib/grafana/dashboards/
influxdb.yml:
apiVersion: 1

datasources:
- name: Influx-Jmeter
  type: influxdb
  access: proxy
  url: http://influxdb:8086
  isDefault: true
  jsonData:
    organization: myorg
    defaultBucket: jmeter
    version: Flux
  secureJsonData:
    token: myadmintoken
MockServer Service
Final part, the mockserver initialization :
  mockserver:
    image: mockserver/mockserver:latest
    container_name: mockserver
    ports:
      - 1080:1080
    environment:
      MOCKSERVER_WATCH_INITIALIZATION_JSON: "true"
      MOCKSERVER_PROPERTY_FILE: /config/mockserver.properties
      MOCKSERVER_INITIALIZATION_JSON_PATH: /config/expectations.json
    volumes:
      - ./expectations.json:/config/expectations.json
Download docker-compose file here
MockServer is a powerful tool for simulating HTTP/HTTPS servers and API services. It is often used for development, testing and continuous integration, enabling developers to test their applications without needing to access external services.
Here I'm also using the latest image, the port mapping defined is "1080:1080", the mockserver dashboard can be checked here: http://localhost:1080/mockserver/dashboard.
You can also check the logs by using this command: docker logs mockserver.
MOCKSERVER_WATCH_INITIALIZATION_JSON: "true"
This environment variable tells MockServer to monitor the specified JSON initialization file (via MOCKSERVER_INITIALIZATION_JSON_PATH) for changes. If this file changes, MockServer will automatically reload expectations without requiring a container restart.
MOCKSERVER_PROPERTY_FILE: /config/mockserver.properties
This variable specifies the path of the MockServer properties file to be used. This file can contain various configurations for MockServer, such as ports to be used, logging levels, etc. In the absence of this file, MockServer will use the default values.
MOCKSERVER_INITIALIZATION_JSON_PATH: /config/expectations.json
This variable specifies the path of the JSON file containing the expectations to be loaded at MockServer startup. This file must be mounted in the Docker container via a volume, as shown below.
Regarding the volumes: expectations.json:/config/expectations.json
This line mounts the local expectations.json file in the Docker container at /config/expectations.json (Download expectations.json file here). This allows MockServer to access this JSON initialization file and load the expectations specified at startup.
Regarding the expectations file you will that it's easier to define endpoint and their respective responses :
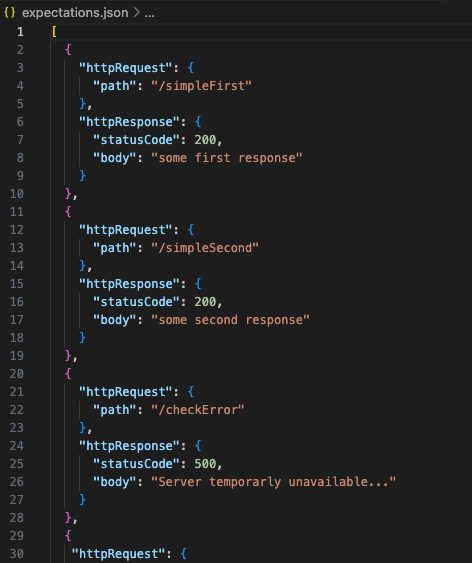
Load test configuration and test scenario
The config file
In this file (Download the config file here), a certain number of parameters are defined and will be taken into account when the test plan is executed :
Test Typology
This defines the load, duration and ramp-up period to reach the expected load.
NB_USERS=1
DURATION=300
RAMPUP=60
Target
Used to define the target information to be solicited as part of the tests, in this case where are sending request on host.docker.internal.
host.docker.internal is a special address provided by Docker to enable containers to communicate with services running on the host machine.
This address automatically resolves the IP of the host machine from inside the container, facilitating communication between the container and the host.
TARGET_HOST=host.docker.internal
TARGET_PORT=1080
SCHEME=http
Scenario Parameters
The arguments that will be used at the runtime when executing the scenario.
PARAM_USERS_ARGS="-Jthreads=${NB_USERS} -Jduration=${DURATION} -Jrampup=${RAMPUP}"
PARAM_HOSTS_ARGS="-Jhost=${TARGET_HOST} -Jport=${TARGET_PORT} -Jscheme=${SCHEME}"
JMX File Path, Logs Path
The orchestration of the information transmitted during execution, including the test plan and log files.
JMX_FILE=${BASE_DIR}/scenario/${PROJET}.jmx
RESULT_FILE=results-lt-${PROJET}-${NOW}.csv
LOGS_DIR=${BASE_DIR}/logs/
RESULTS_DIR=${BASE_DIR}/results/
RESULTS_FILE=${RESULTS_DIR}/${RESULT_FILE}
LOG_FILE=${LOGS_DIR}/${PROJET}.jtl
JVM Configuration
Time zone definition, IP address stack preferences, garbage collector, JVM memory size, stack size definition for JVM threads.
JVM_ARGS="$JVM_ARGS -Duser.timezone=CET"
JVM_ARGS="$JVM_ARGS -Djava.net.preferIPv4Stack=true -Djava.net.preferIPv6Addresses=false"
JVM_ARGS="$JVM_ARGS -Dcom.sun.management.jmxremote.authenticate=false"
JVM_ARGS="$JVM_ARGS -XX:+UseG1GC -XX:MaxGCPauseMillis=100 -Xms1g -Xmx1g -XX:G1ReservePercent=20 -Xss256k"
The test scenario
For this example, we will call the mock on the endpoints defined in the expectations.json file. There are several types of GET/POST requests (not exhaustive), which also return HTTP return codes equal to 500.
Global view:
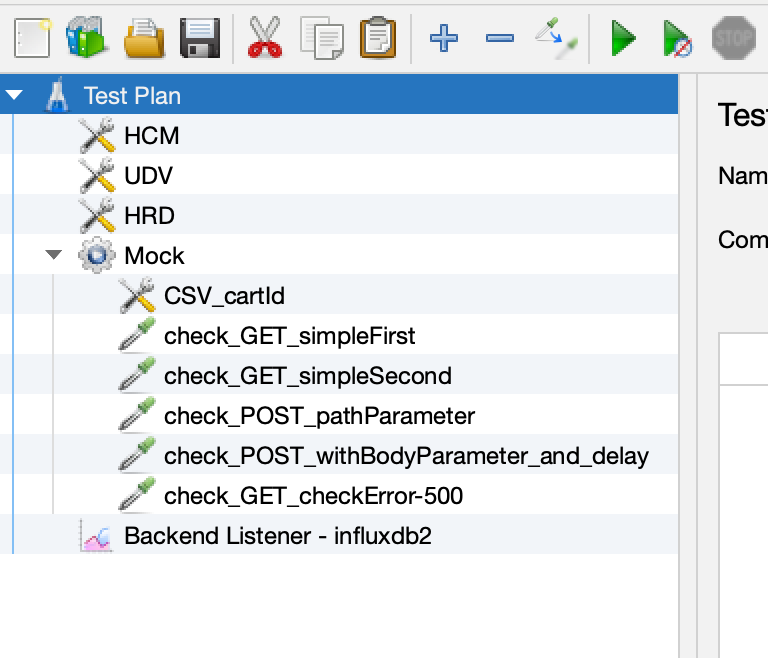
The test scenario can be downloaded (Download sandbox.jmx here) to see how the requests are made, here's a focus on the backend listener to see how to configure it:
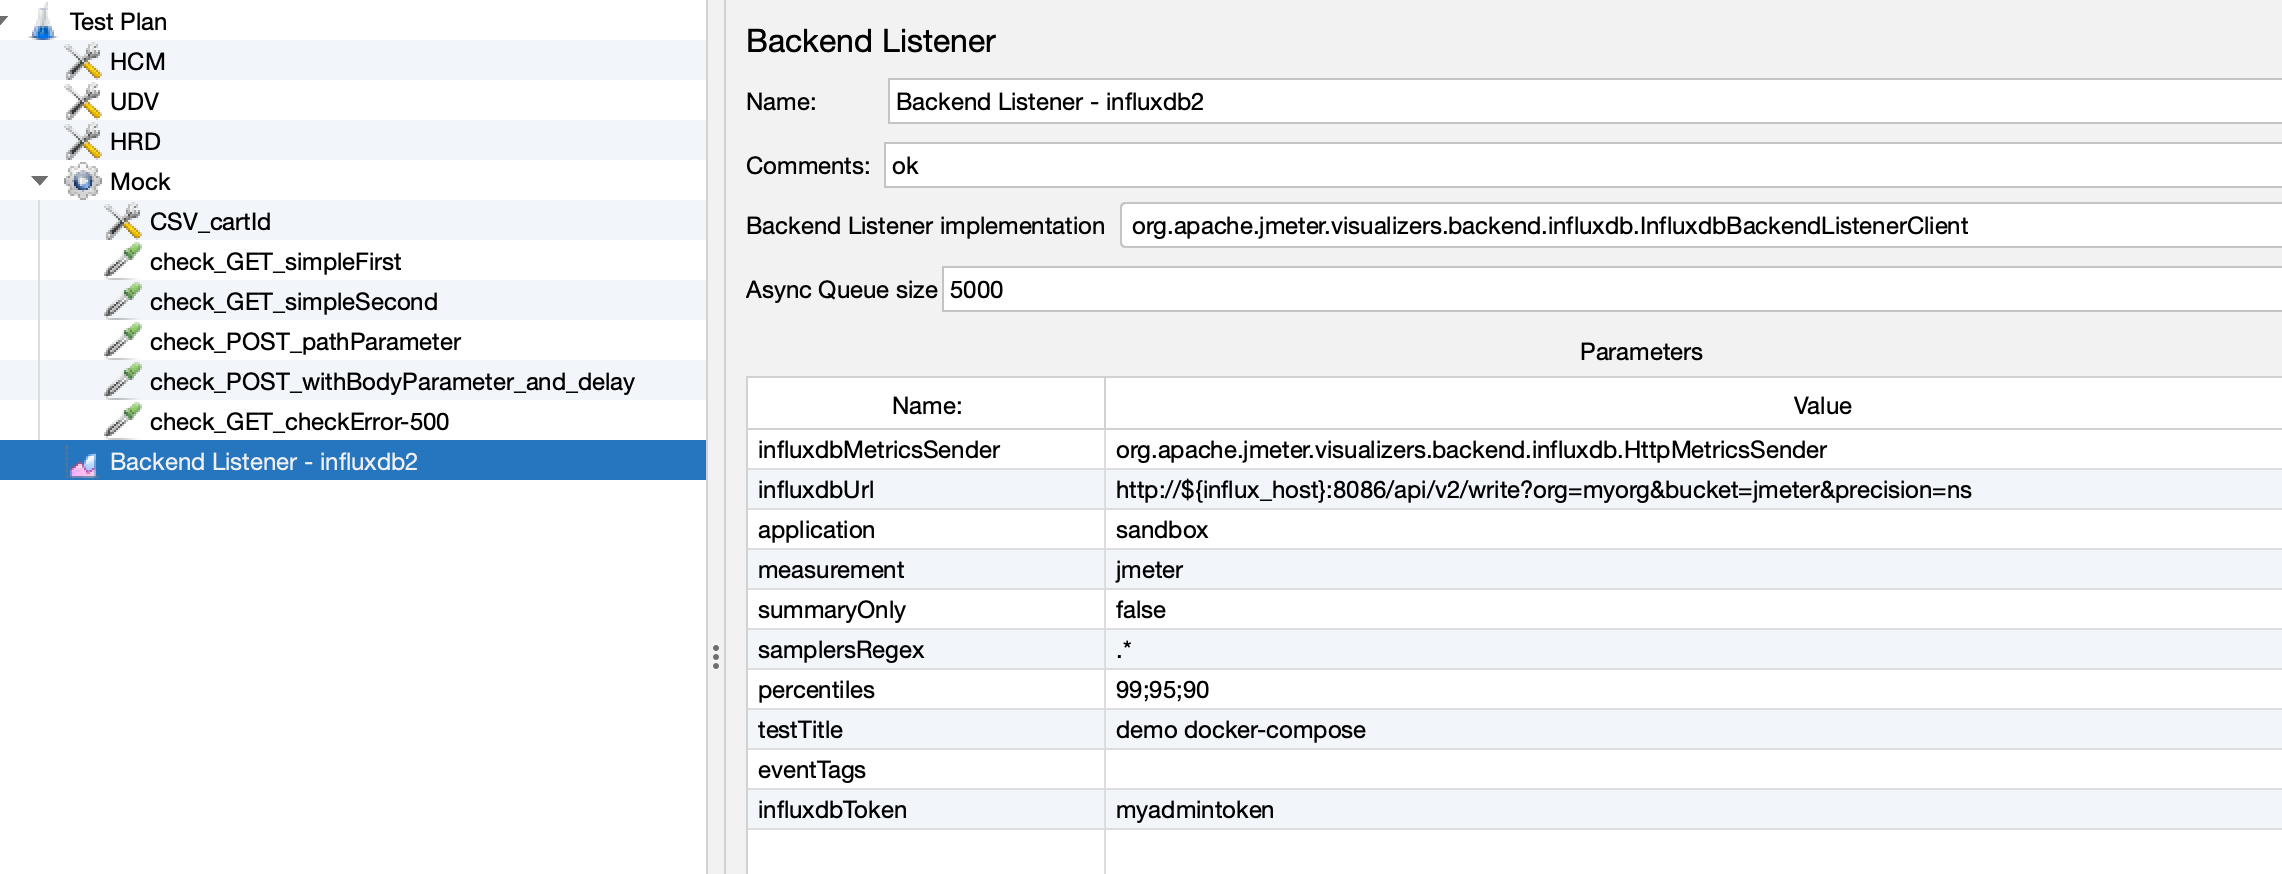
Don't forget to add one key/value to the existing backend as follows : influxdbToken myadmintoken
As per my example this information are correct, as they match with the information filled in the env.influxdb2 file.
There's also an example of using a .csv file in a .jmx file.
Execute your test with every service
How to use this docker compose project ?
That's very simple, you have move to the root directory, and execute the following command: source config && sudo docker-compose -p jmeter up -d
Here are some explanations:
source: All environment variables and configurations defined in the config file will be loaded into the current shell.docker-compose: Command to execute Docker Compose.-p jmeter: Uses the -p option to specify a project prefix. Here, the prefix jmeter is used to name containers, networks, volumes and so on. This makes it possible to isolate Docker resources for this specific project.up: Starts the containers defined in the docker-compose.yml file. If containers do not exist, Docker Compose will create them.-d: Use the -d option to start containers in detached mode (in the background). This ensures that the terminal is not blocked by container logs and can continue to be used.
Once it is done you will see that all the container have been created:

InfluxDb Connect
To check if your influxdb is receiving the data correctly you can connect to your service as explained previously: http://localhost:8086/signin and fill as detailed in the file admin and adminpassword
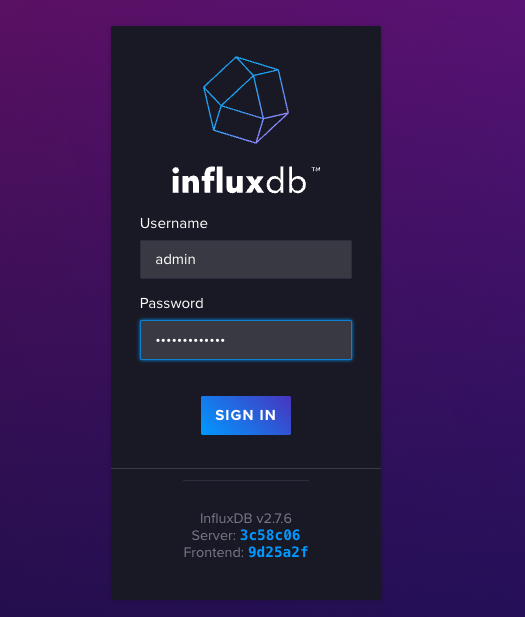
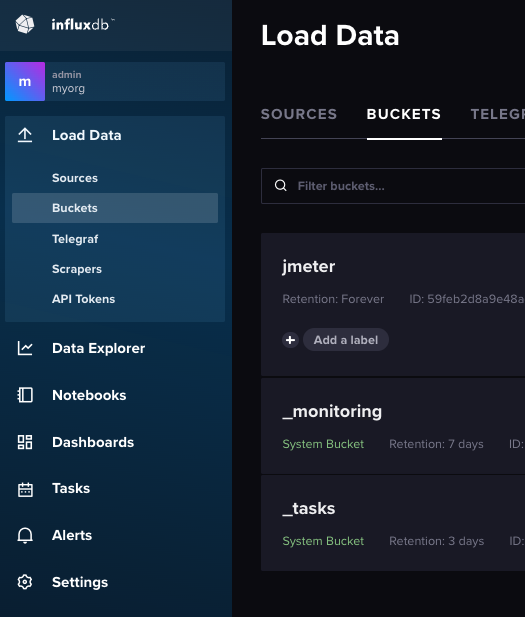
Once it is done you can select the buckets in the "Load Data" part, you will then see that our bucket "jmeter" is well created!
You can then click on it.
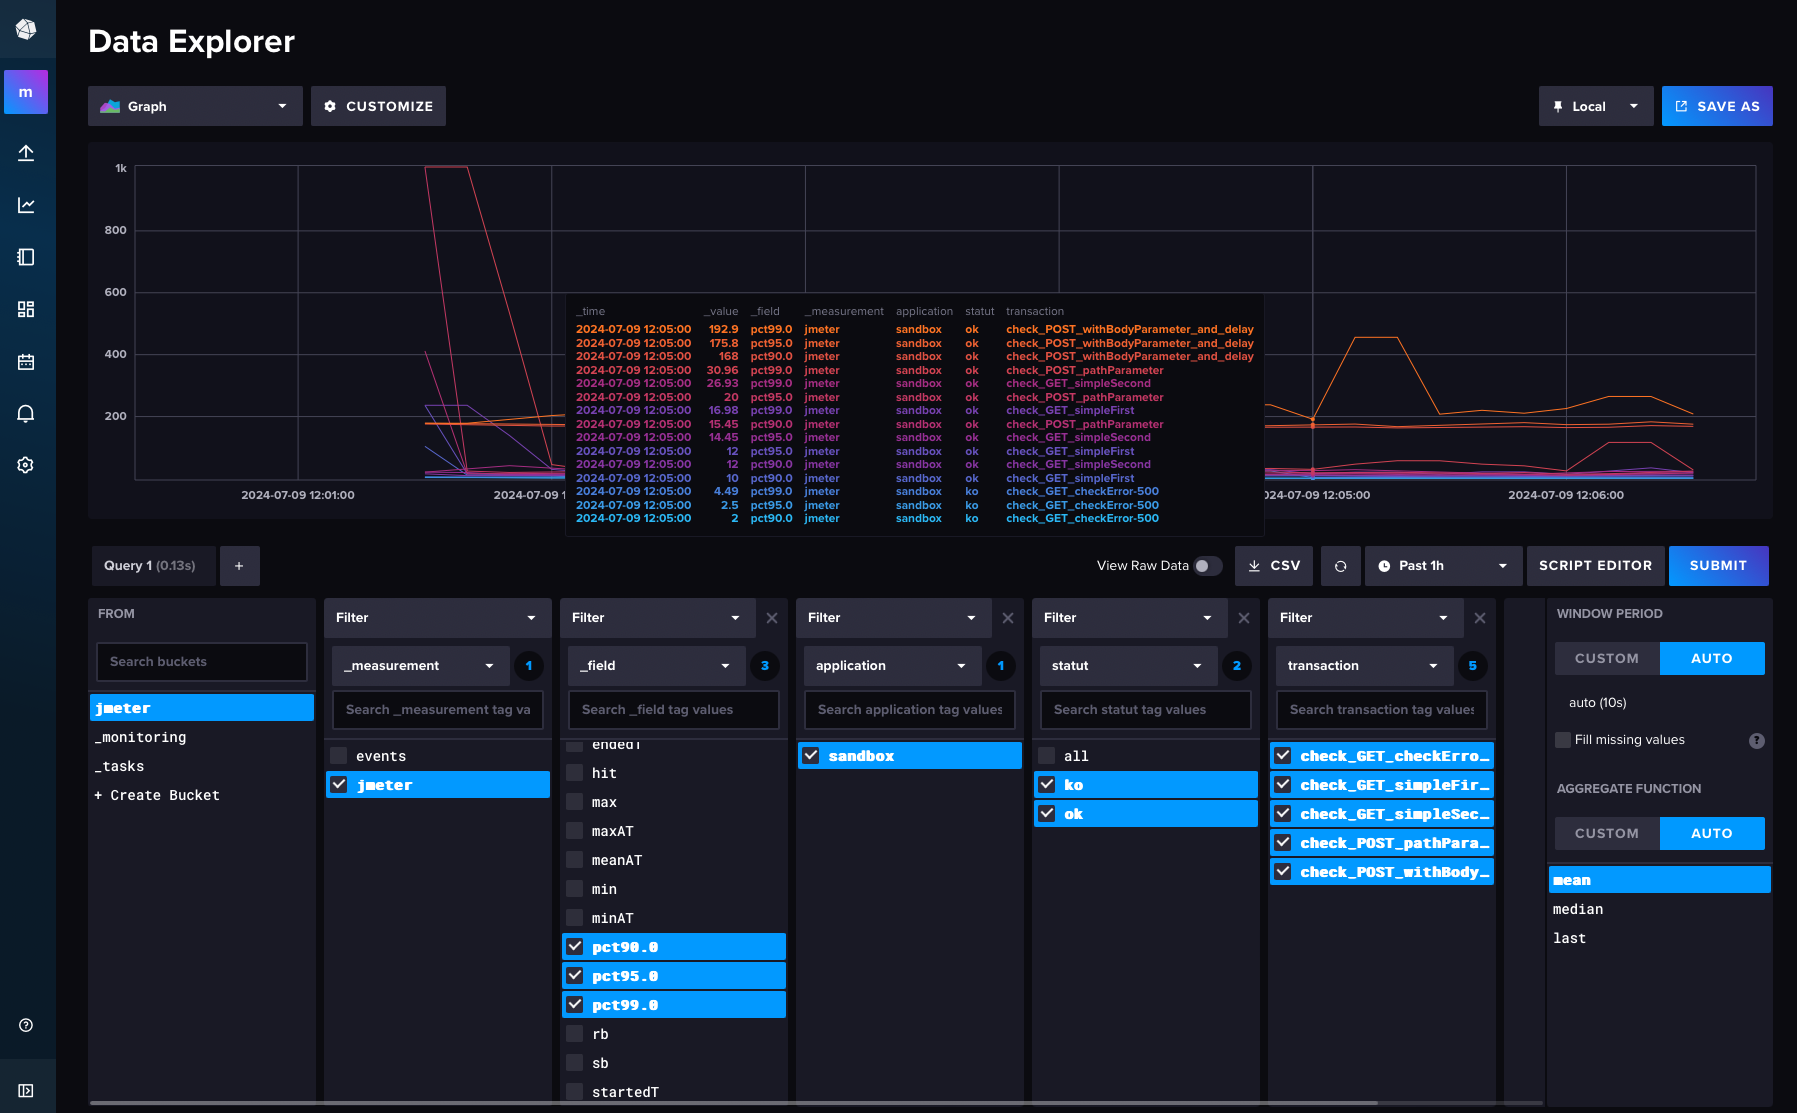
After that, you can filter your metrics, submit them and check that everything is properly integrated:
Grafana Connect
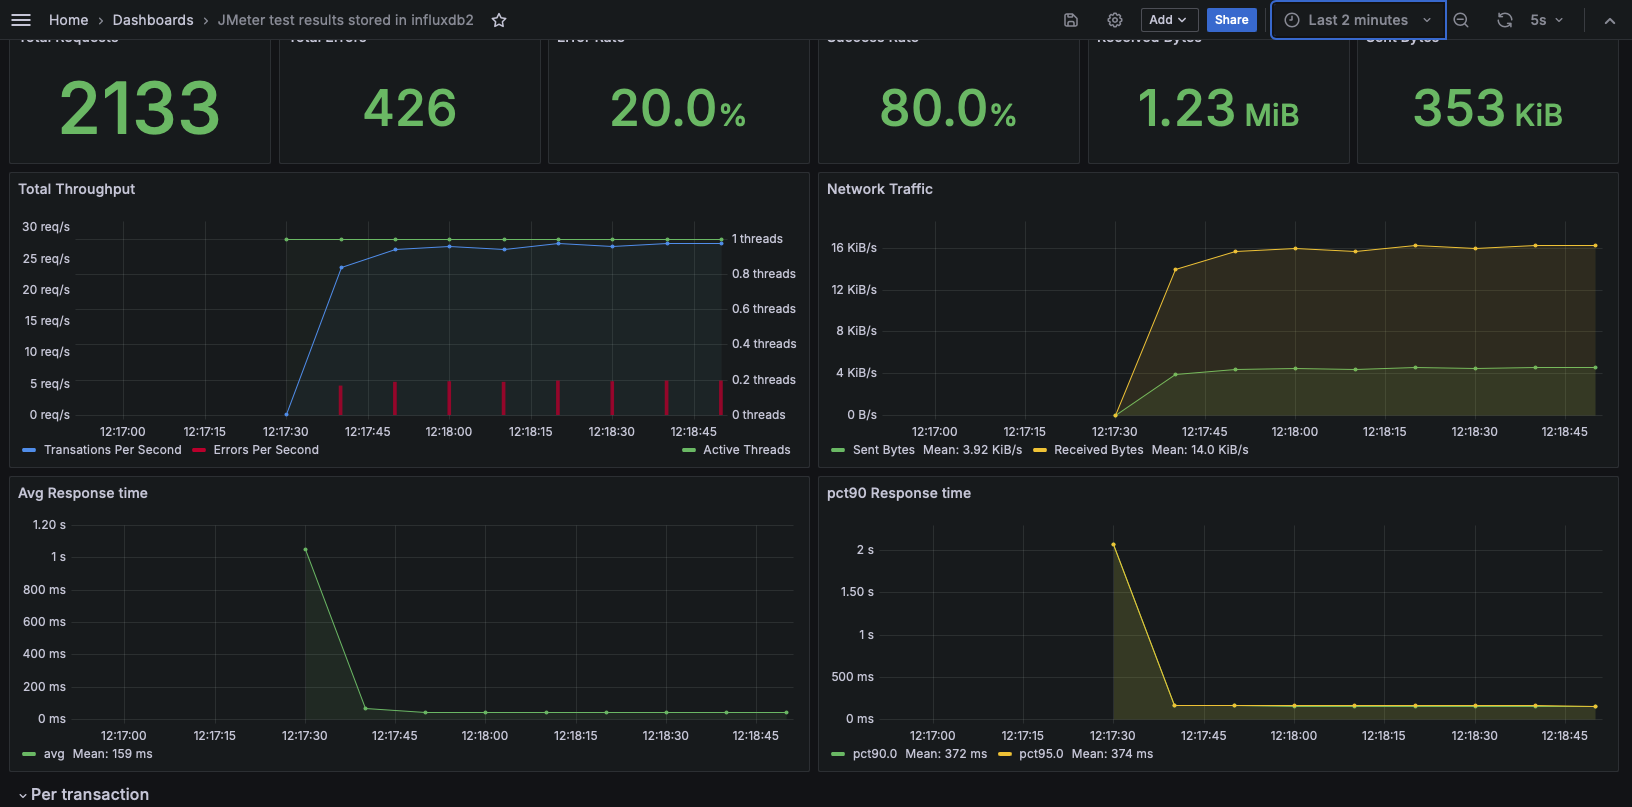
To check if your Grafana is actually connected to your influxdb2 container, you can connect to your service as explained earlier: http://localhost:30000 and fill as previously detailed admin with the admin password then click on 'skip' button.
Then you can select your Dashboard > JMeter test results stored in influxdb2, here under a quick overview:
MockServer DashBoard
To check if your expectations are created and that your mockserver is receiving request you can reach http://localhost:1080/mockserver/dashboard as explained before.
Here the Active Expectations are well created, and the requests are correctly received:
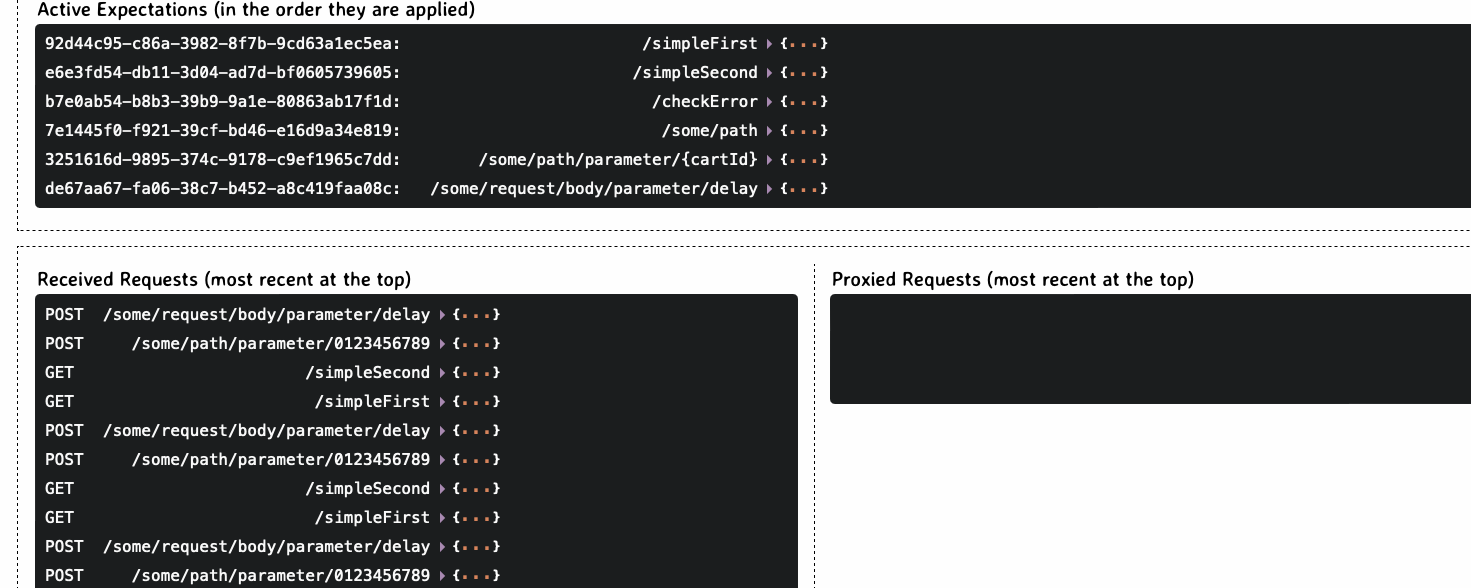
During the test, when request are received, you can check more precisely what's happening:

Final steps
Local reports are stored in the report folder of your local host. And as you may already know, you can integrate third-party tools like Grafana, Datadog, Dynatrace, Elasticsearch, Graphite, directly in OctoPerf.
It is very easy and can be done in the Runtime menu:
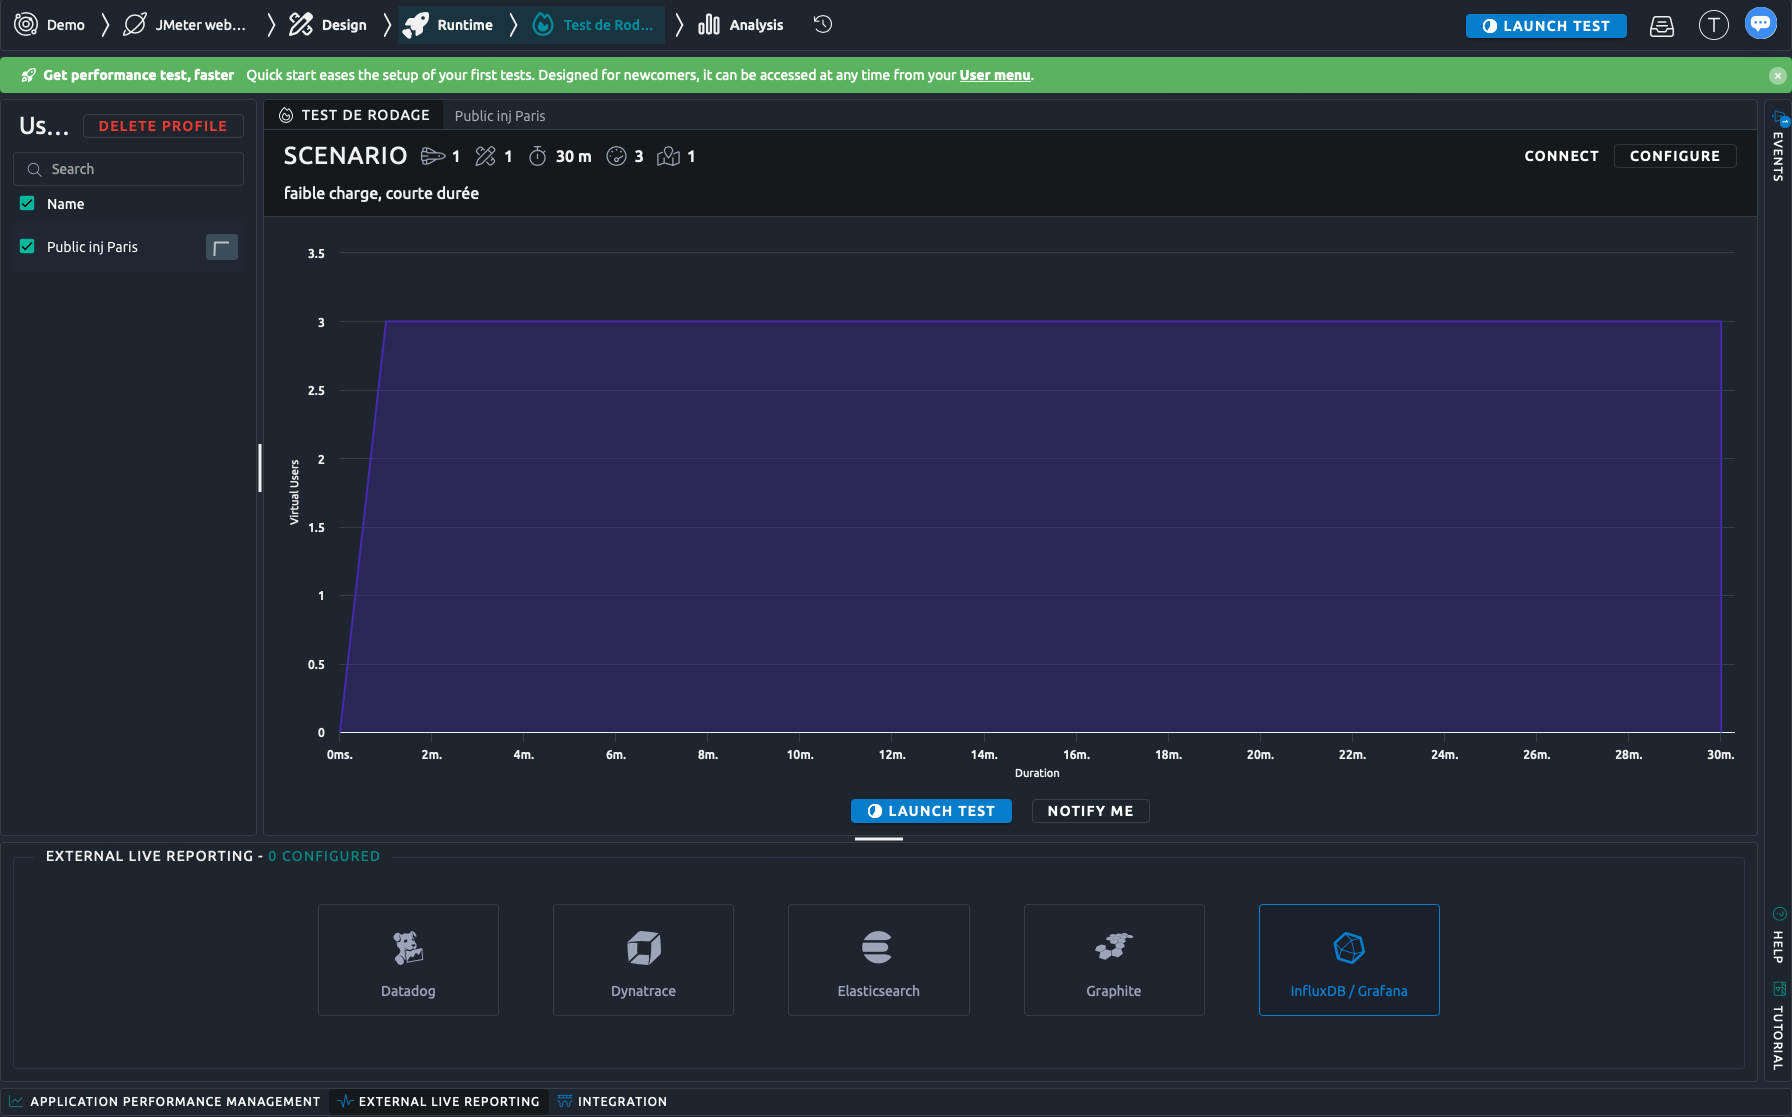
You just have to fill your credentials:
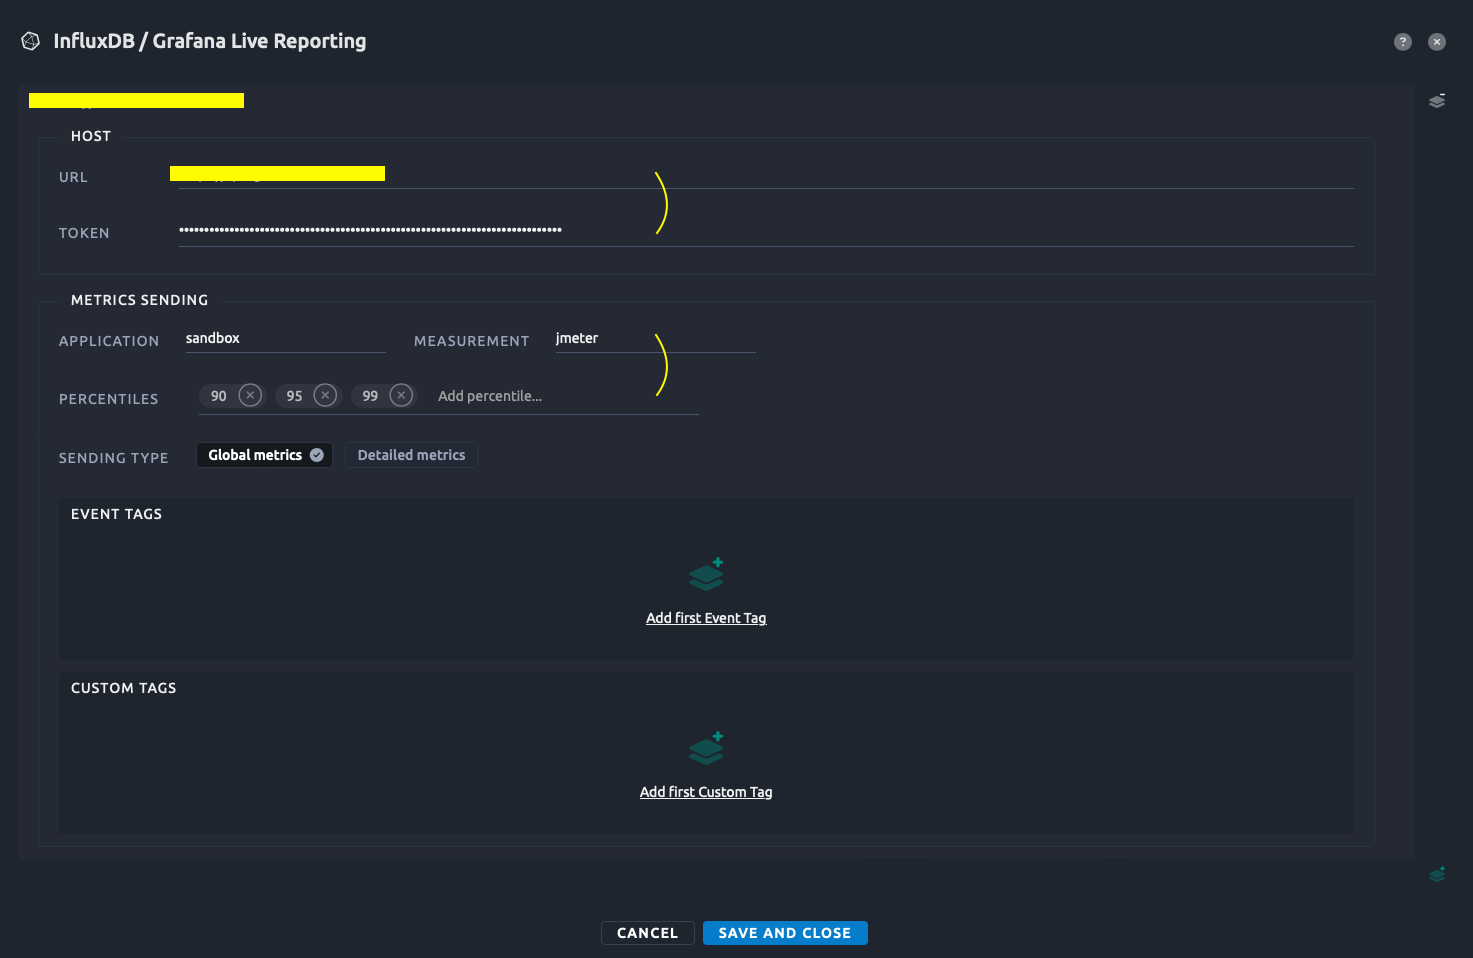
It's up to you to use one or more dashboards adapted to the metrics you wish to display!
For some reasons, if you need to shutdown your test: docker-compose -p jmeter down
If you want to download the JMeter Mock docker-compose kit click here.
Conclusion
This tutorial has shown you how to take advantage of the power of docker compose, and thus benefit from different services, all of which are complementary. You can now carry out one or more load tests, based on a methodology that offers many advantages, particularly in terms of robustness, flexibility and efficiency.
