
JMeter Out Of Memory: 12 Actionable Fixes
If you're here, it's because you've probably experienced Java Heap Space exceptions while running JMeter. Isn't it?
JMeter Out Of Memory exceptions happen during a heavy load tests, with the following log lines appearing in jmeter.log:
2017/10/01 13:35:16 ERROR - jmeter.threads.JMeterThread: Test failed! java.lang.OutOfMemoryError: Java heap space
It can also be a message like Unable to create new native Thread. Don't panic!
You'll learn 12 ways to get ride of memory issues and get a better understanding of how the JVM works.
Use Java JDK NOT JRE
As per Java Garbage Collection handbook:
By default the JVM is configured to throw Out Of Memory errors if **it spends more than 98% of the total time doing GC and when after the GC only less than 2% of the heap is recovered.
Here is the difference:
- JRE: Java Runtime Environment. It is basically the Java Virtual Machine where your Java programs run on. It also includes browser plugins for Applet execution.
- JDK: It's the full featured Software Development Kit for Java, including JRE, and the compilers and tools (like JavaDoc, and Java Debugger) to create and compile programs.
The reason to go with a JDK is that it contains a server optimized compiler which is better at optimizing Java code execution, thus JMeter Execution.
From Chapter 2 of the whitepaper (The Java HotSpot Performance Engine Architecture):
The Server VM contains an advanced adaptive compiler that supports many of the same types of optimizations performed by optimizing C++ compilers, as well as some optimizations that cannot be done by traditional compilers, such as aggressive inlining across virtual method invocations. This is a competitive and performance advantage over static compilers. Adaptive optimization technology is very flexible in its approach, and typically outperforms even advanced static analysis and compilation techniques.
Increase Java Heap Size
JMeter is a Java program which relies on the Java Virtual Machine. The JVM can be tuned to increase the allocated RAM. When a Java program requires fair an amount of memory, like JMeter, it's common to increase the allocated RAM.
By default, JMeter can use up to 512MB of RAM, as stated in jmeter.sh or jmeter.bat launch scripts:
# This is the base heap size -- you may increase or decrease it to fit your
# system's memory availability:
HEAP="-Xms512m -Xmx512m"
This is a pretty conservative setting to ensure JMeter can run even on tiny computers. Let me explain the settings:
- -Xms512m: tells the JVM to allocated at least 512MB of RAM,
- -Xmx512m: tells the JVM to allocated at most 512MB of RAM.
For example, if you want to allocate between 1024MB and 2048MB of RAM to the JVM, use the following settings by editing your JMeter startup script:
HEAP="-Xms1024m -Xmx2048m"
Upgrade Java and JMeter
Make sure to use the most recent versions of:
- Java: use the latest 64 bits Java Virtual Machine, as it allows to use more than 1536MB or RAM as Xmx,
- JMeter: latest JMeter versions usually contain many fixes and improvements,
- JMeter Plugins: make sure to use the latest JMeter Plugins,
- Operating System: upgrade your operating system to the latest version.
Generally speaking, avoid using old software versions otherwise you may encounter bugs that have been fixed in latest versions.
JMeter Non-Gui Mode
You can execute JMeter test from the command line without launching the UI (which consumes a lot of memory):
jmeter -n -t scenario.jmx
- -n: runs JMeter in non-GUI mode,
- -t: specifies the path to source .jmx script to run.
Disable Listeners
Many of the JMeter listeners consume a lot of memory because they keep all the results in the RAM. You should disable or remove them all before running a load test to avoid putting pressure on the JVM with unnecessary results kept in main memory.
Tune JMeter SaveService
JMeter's SaveService manages the data which is written into the JTL result file. You can vastly improve the throughput by reducing the amount of data being written into the JTL files by editing the jmeter.properties file.
The properties below are pretty well optimized and can be used as default settings:
# true when field should be saved; false otherwise

# assertion_results_failure_message only affects CSV output
#jmeter.save.saveservice.assertion_results_failure_message=true
#
# legitimate values: none, first, all
#jmeter.save.saveservice.assertion_results=none
#
#jmeter.save.saveservice.data_type=true
#jmeter.save.saveservice.label=true
#jmeter.save.saveservice.response_code=true
# response_data is not currently supported for CSV output
#jmeter.save.saveservice.response_data=false
# Save ResponseData for failed samples
#jmeter.save.saveservice.response_data.on_error=false
#jmeter.save.saveservice.response_message=true
#jmeter.save.saveservice.successful=true
#jmeter.save.saveservice.thread_name=true
#jmeter.save.saveservice.time=true
#jmeter.save.saveservice.subresults=true
#jmeter.save.saveservice.assertions=true
#jmeter.save.saveservice.latency=true
# Only available with HttpClient4
#jmeter.save.saveservice.connect_time=true
#jmeter.save.saveservice.samplerData=false
#jmeter.save.saveservice.responseHeaders=false
#jmeter.save.saveservice.requestHeaders=false
#jmeter.save.saveservice.encoding=false
#jmeter.save.saveservice.bytes=true
# Only available with HttpClient4
#jmeter.save.saveservice.sent_bytes=true
#jmeter.save.saveservice.url=false
#jmeter.save.saveservice.filename=false
#jmeter.save.saveservice.hostname=false
#jmeter.save.saveservice.thread_counts=true
#jmeter.save.saveservice.sample_count=false
#jmeter.save.saveservice.idle_time=true
For example, jmeter.save.saveservice.samplerData=true can really hurt JMeter performances because it writes down all the responses data. Avoid saving anything related to response data, response headers or assertions data unless you absolutely need them. They can consume a great amount of memory.
Avoid Fancy Extractors
Json Path Extractor or XPath Extractor should be avoided. They consume a lot of memory because they need to convert the response body into a complex data structure in memory.
Use Few Assertions
Assertions increase CPU and memory usage because they usually need to process the response data sent by the server.
Use The Right Script Engine
Go for JSR223 + Groovy scripting. It's the fastest scripting engine in JMeter. Beanshell, Javascript and others should be avoided because the performance penalty can be huge compared to Groovy.
Further Tweak JVM Settings
WARNING: danger zone. Tweaking the JVM is mostly not required and can lead to problems. However, if you really want to squeeze the last bit of performance out of the JVM, you can use the following JVM settings (at your own risk):
- -server: This switches JVM into "server" mode with runtime parameters optimization, as explained above it enables more aggressive compiler optimizations,
- -XX:+UseConcMarkSweepGC: Enables concurrent Mark Sweep GC which can improve CPU usage on multi-core CPUs,
- -XX:+DisableExplicitGC: Prevents explicit GC Calls. Unfortunately (and in spite of the disclaimers in the documentation), many developers decide they know better than the JVM and call the Garbage Collector programmatically to collect memory. I'm aware of many instances where the -XX:+DisableExplicitGC improved the production environment and zero instances where there were any negative side effects.
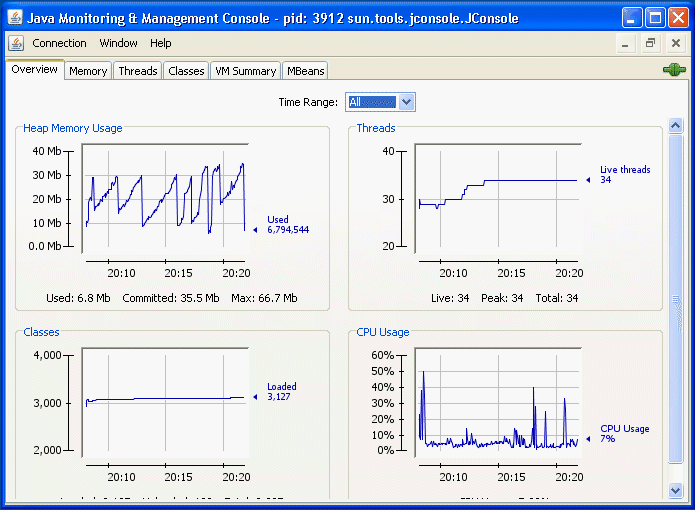
Monitor JMeter JVM
JConsole is a monitoring tool which can be used to view JMeter's JVM overall performance counters like Thread Count or memory usage.
Distributed Tests
At some point, you won't be able to further improve JMeter's memory usage if you need to run a massive amount of concurrent users. You won't be able to run 10.000 concurrent users from a single machine, that's simply not working (and not simply because of CPU and memory usage, but also network usage).
You have two options left:
-
Run Distributed JMeter tests by your own, Distributed JMeter testing is tricky and requires a lot of knowledge. Always make sure to configure each JMeter instance running on each computer with the same SaveService settings, same JVM settings etc. You will have to setup each load generator manually and edit each configuration file,
-
Run Distributed JMeter tests on OctoPerf. Needless to say this will save you a tremendous amount of time.