
JMeter Plugins Overview And Install
JMeter in its vanilla form is a very powerful tool for performance testing, the ability to create complicated test scenarios using the out-of-the box samplers, timers and logic controller can sometimes be extremely difficult and require you to write your own complimentary code.
There are however Plugin’s that exist that can help in building some of the more challenging scenarios.
In this post we are going to look at some of these and discuss how they can be used.
Installing Plugins
The correct way to install plugins when running locally is to use the Plugins manager by selecting Options -> Plugins Manager from the JMeter menu or selecting the Plugins Manager icon.
![]()
If you do not have these options you need to download the plugins manager which can be found at this link and follow the instructions.
If you are running your performance tests in the cloud and you are using a docker image with JMeter and don’t want to update your image, then an alternative is to make sure that the Plugins you want to use are available in your test scripts code repository and then reference these plugins in the JMeter classpath.
The plugins we are using are documented here.
The example below shows and example of a test with a logical reference to the Plugins JAR files.
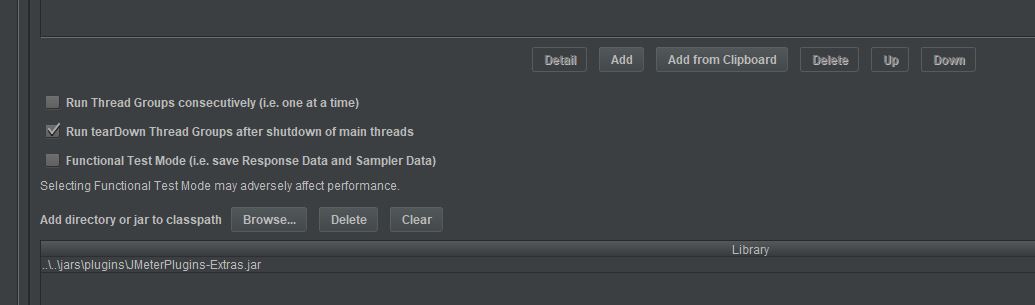
For the purposes of this Blog Post we will use the Plugins manager as the examples will be run from a local machine.
Now you have these installed you will see several additional entries under Threads, Config Elements, Samplers, Listeners, Pre and Post Processors amongst others.
Most of these additions are prefixed with jp@gc but there are some that are not.
The example below shows the additions to the listeners.
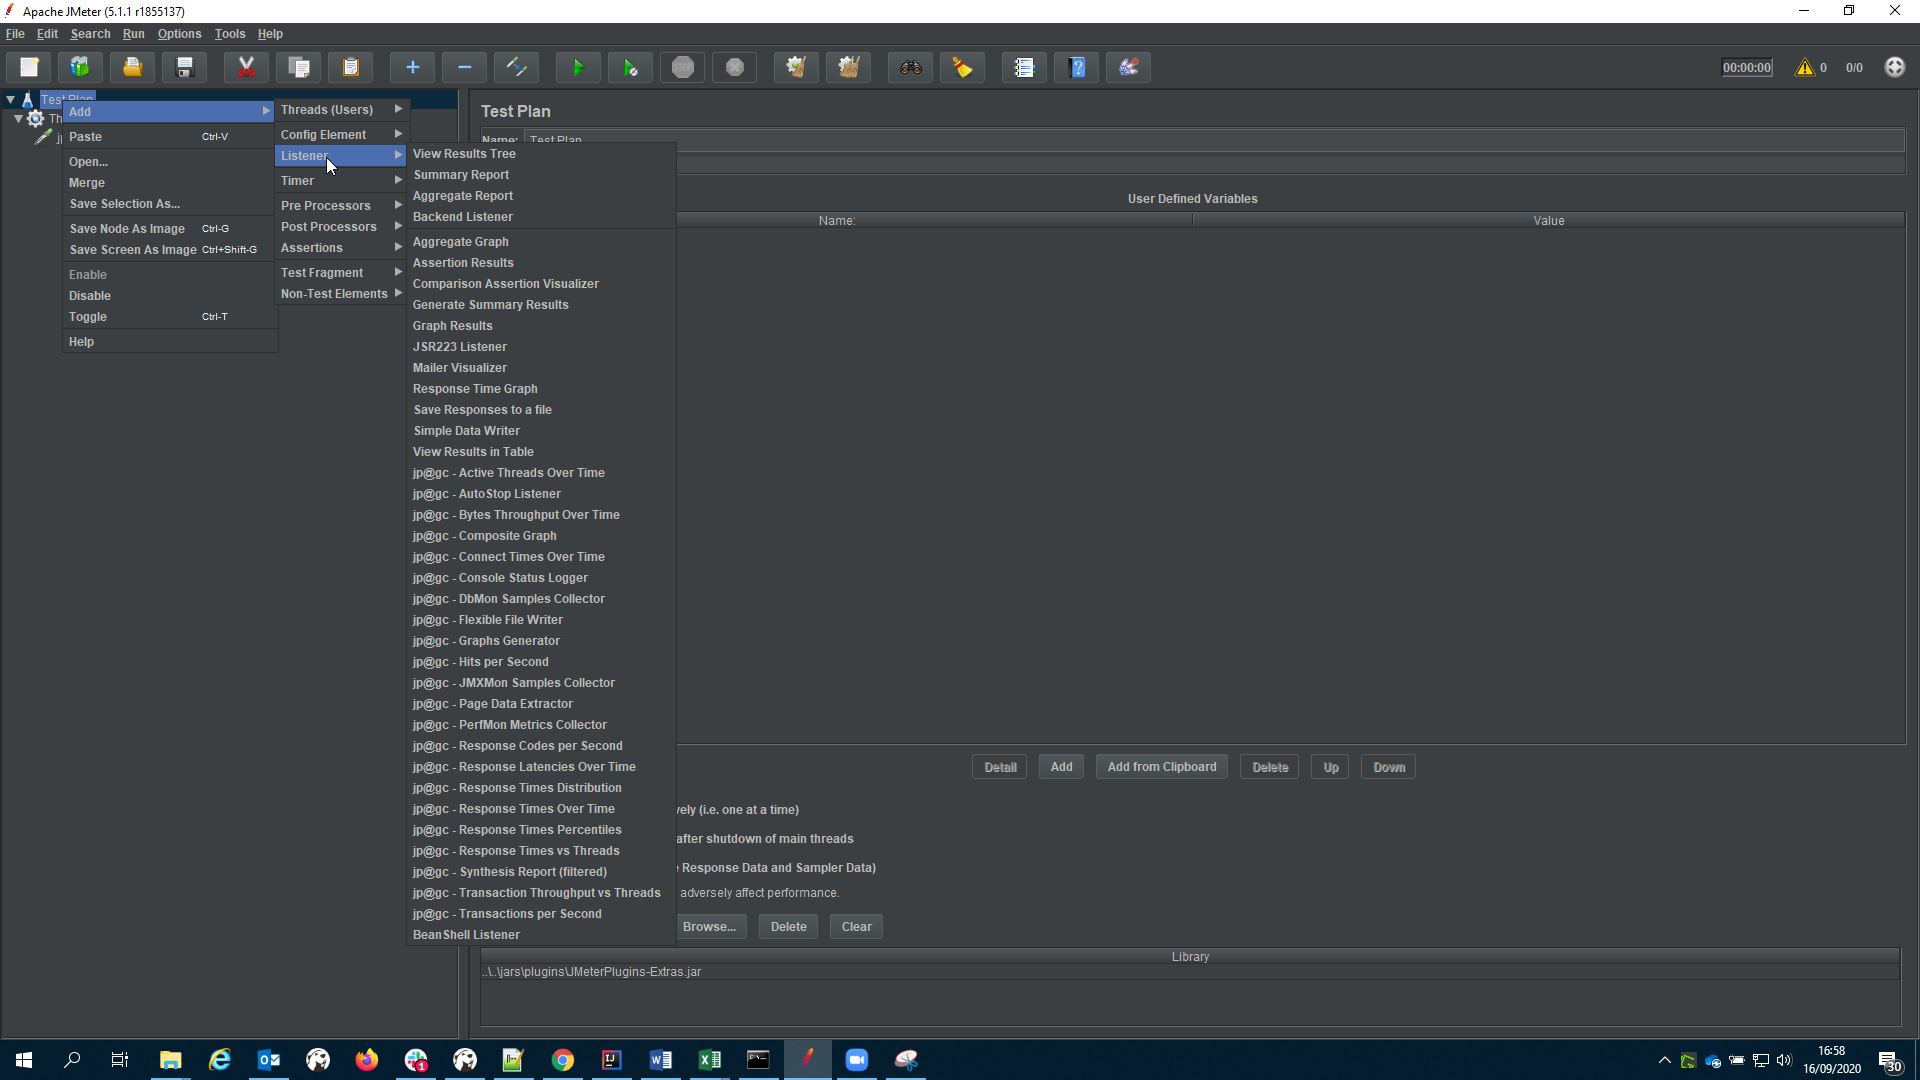
As you can see there are many of these additions and this Blog Post will only touch on a couple but hopefully it will give you the inspiration to go and take a more in-depth look at the others.
Dummy Sampler
We are going to start with the Dummy Sampler because we are going to use this sampler to demonstrate the use of the other plugins.
The dummy sampler is just that, a sampler that simulates a request and response to and from a service or endpoint.

If you are working in an Agile environment and you want to start writing performance tests whilst development in ongoing then this is extremely useful as you can build a request and response that mirrors what is being developed.
You can build the performance testing throughput and concurrency logic around this dummy sampler which means when the code is ready for test all you need to do is replace your dummy sampler with one that points at your real service.
Let’s build a simple example:

We can simulate may different responses and response codes quite easily and well as providing a dummy request and response.
The response time can be controlled along with the connection and latency times making this a very powerful way to simulate endpoints or services that are being developed and simulate all the possible responses and performance permutations.
Throughput Shaping Timer and Hits Per Second Graph
The Throughput Shaping Timer is a very quick and easy way to simulate any type of scenario that looks at varying load profiles across the duration of the test.
Take a scalability test for example where you want to systematically increase your load over a period using this plugin makes this very easy.
Basically, you specify a start requests a second and an end requests a second and a duration, and you can add as many of these as you like and JMeter will attempt, if you have enough threads, to stick to these volumes.
Let’s look at an example:

We have built a scenario that:
- Ramps up from 1 request a second to 10 requests a second over 10 seconds
- Runs at 10 requests a second for 20 seconds
- Ramps up from 10 request a second to 20 requests a second over 10 seconds
- Runs at 20 requests a second for 20 seconds
- Ramps up from 20 request a second to 30 requests a second over 10 seconds
- Runs at 30 requests a second for 20 seconds
- Ramps up from 30 request a second to 40 requests a second over 10 seconds
- Runs at 40 requests a second for 20 seconds
We will use our dummy sampler we have already created to demonstrate the execution of this scenario.
If we look at the test in full:

We have our Dummy Sampler, our Throughput Shaping Timer and a Hits per Second listener.
Before we look at the Hits per Second Listener it is worth looking at the Thread Group as for the Throughput Shaping Timer to successfully complete the scenario we have defined we need to make sure we have enough Threads and we need to make sure that Loop Count is set to Forever.

We have set the number of threads to 40 as our scenario is going to be running at 40 requests a second in the last section and this will ensure that we have enough threads available.
The new addition to the test is the Hits per Second listener, and the reason for adding this is because firstly is provides a really nice view of the transaction rate and secondly is another useful plugin.
If we execute our test and then look at the hits per Second listener

We can see that our test has followed the requests per second we set in the Throughput Shaping Timer and then finished when the final step is completed.
Flexible File Writer
The Flexible File Writer provides the ability to output any number of pre-defined values which would require the need to use a JSR223 sampler and some coding to achieve.

When added it comes pre-populated with a number of examples which can be seen in: - Write File Header - Record each sample as
These two fields obviously need to match it’s the header and the data value.
If we look at each:

We see that there are seven entries in the header field separated by a tab and seven fields on the sample field separated with a ¦\t and a \r\n at the end
The \t is the delimiter and this can be changed depending on your preference with the \r\n at the end being the carriage return\new line.
To add more you simply select one of the available fields and that copies it to the clipboard and you then paste into sample field, making sure you also add a header entry for each one you add.

We have added responseHeaderSize and activeThreads and set the output file to be testResults.txt which will output to the JMeter bin folder unless you change this here with either a physical and logical path.

The output shows the additional two fields we added before the test was run.
Response Times Over Time
The title of the Response Times Over Time plugin gives away what it does, it plots the response times from your test.
The output of our Throughput test that we have built shows.

Active Threads Over Time
As with the previous section the clue is in the name for the Active Threads Over Time plugin, basically it’s the number of active threads.

Its benefit is not obvious with our simple test as we have 40 threads active through the duration of the test, more complex scenarios with multiple Thread Groups will make the information in this plugin much more valuable.
Composite Graph
The Composite Graph allows you to combine a number other listeners into a single output, when you add it to your Test Plan and select the Graphs tab you are not presented with any of our existing listeners to add.

If we start the test again and then stop it this is enough for the Available Sources to be populated.

If we execute our test again.

We can see that we have all our previously discussed listeners on one graph.
Create your own
As JMeter is open source it does mean that you can create your own plugins and whilst a bit complicated it is not overly so.
The source code is available from the JMeter download site.
We will not go through how to create one in this post but there is a really good tutorial from the creators of JMeter which can be found here.
JMeter is intuitively organised into sub-directories and therefore looking at the source code for examples of how plugins have already been created is relatively straightforward.
The tutorial looks at writing GUI elements, Visualizers, Listers, Graphs and TestBeans and a working knowledge of Java and its principles should allow you to build samplers specific to your organisation and even share with the wider community.
Conclusion
The examples in this Blog Post have all been run through the JMeter GUI, when you are running your tests under load you will not be using the interface and therefore if you want to use the output from these plugins, as with the standard ones, you need to specify a file name for the output,
As you can see we have only scratched the surface and I have picked a few of the plugins that I use on a regular basis to assist my testing.
I would encourage you to continue to investigate what JMeter plugins can offer you in building and enhancing your performance tests.