New reporting capabilities
OctoPerf last update focused on improving the overall reporting with, for example, the possibility to insert page breaks in the generated PDF report.
The result table
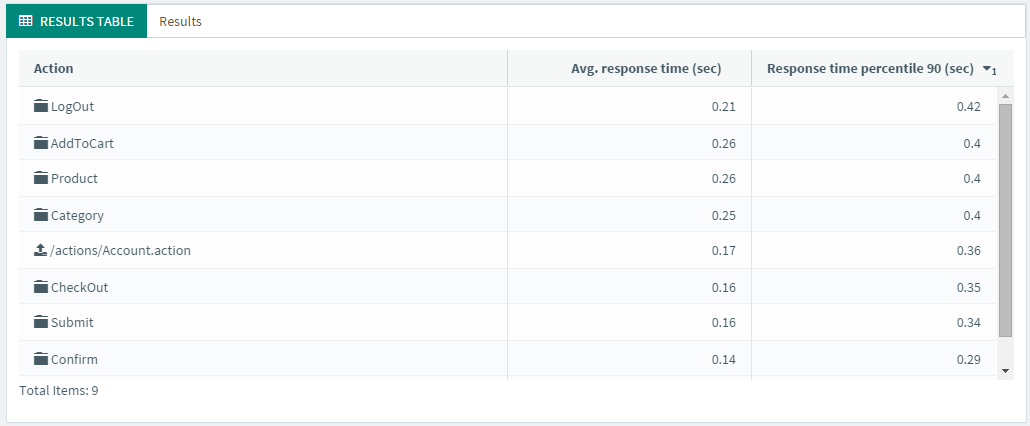
We worked hard on the result table: from the way the metrics are displayed and sorted to the CSV export, we reviewed this report item so you can get the most revealing information from it.
The percentile metric
Until now OctoPerf analysis section only came with a specific report item dedicated to percentiles.
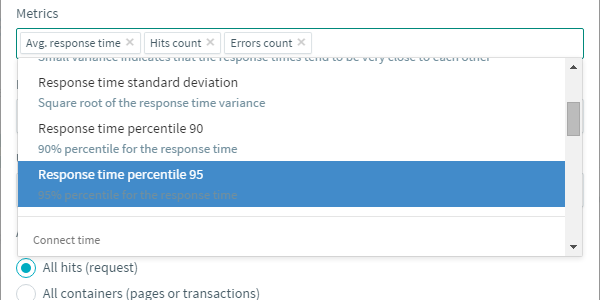
As we think this metric deserve more visibility in load testing reports, we added the Percentile 90 Response Time and the Percentile 95 Response Time to our result table.
What is a percentile?
To understand what a percentile is, let's consider a list of 100 values. This list is ordered from lowest to highest value. In this case, the 90th percentile is the 90th value in the list. This means that 90% of the values are lower than the 90th percentile.
Percentile vs average response time
The most commonly used performance metric is the average response time. It is of course a very quick way to find out if the "average" user can access a page or resource in a timely manner. But it also paints a very different picture from reality.
A good illustration of this is when you look at the average revenue in a country. Around where I live the average revenue per household per month is more or less 2000 euros. But if you look at the 5% richest the revenue is more than 10 000 euros. What's more, 50% of the households earn less than 1500 euros.
To sum up :
- Average : 2000
- 50th percentile (median) : 1500
- 95th percentile : 10 000
If you only look at the average value you get a wrong feeling about what most households earn. This is because a small number of households have a very high revenue.
Percentiles helps you put this in perspective, they add another dimension compared to average values.
Which one is the best?
Averages tend to be influenced a lot by high or low values and give unrealistic values. They are quite one-dimensional and show a simplistic view. For instance, small peaks might not be visible when looking at an average whereas a small portion of your users is experiencing a slowdown. In OctoPerf we rely on elasticsearch to store test data and this is described accurately in elasticsearch documentation about percentiles.
On the other hand percentiles can be more accurate by not taking into account extreme values but at the same time showing you what a certain fraction of your users experience. In short, percentiles are a great indicator for your load tests.
Transactional metrics
Now you can also plot metrics on transactions/containers in the result table. Simply edit it and select All containers (pages or transactions) in the action filter:
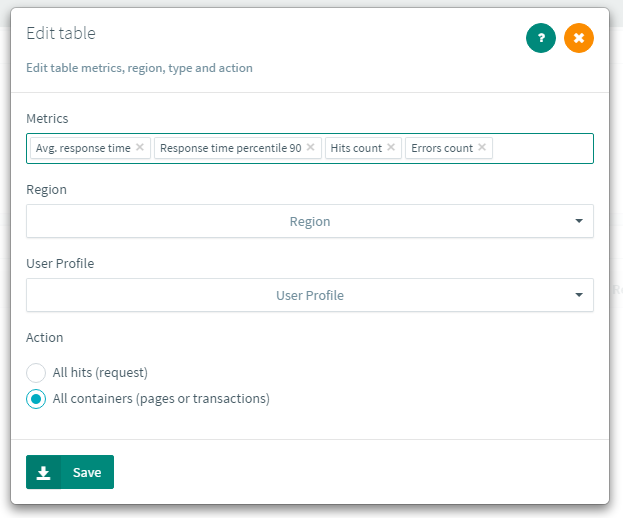
As containers are user defined, they will give you a more concise and accurate view of the performances metrics values than displaying them for each request.
Report exporting improvements
OctoPerf provides performance testing reports out of the box. You can edit it even as your load test is running, because there is usually not much to do at that time. We figured it would be the perfect opportunity to write down your conclusions before sending it to the stakeholders or the rest of your team after the test, in just a few clicks.
Load testing report branding
To improve this aspect of our solution, we let you place your company logo and name on top of the exported report.
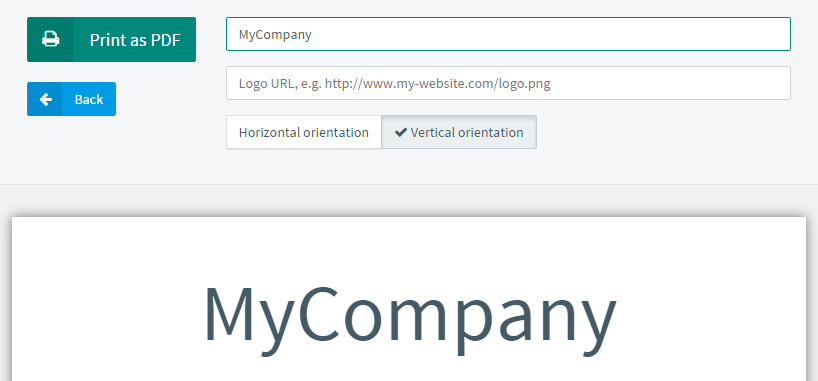
Our octopus is a very shy animal, so the OctoPerf logo or name never appears in the report. Mentioning the tool used to get these nice performance test results is at your sole discretion.
Report formatting
An other point regarding the exported report is the formatting. Page breaks are automatically inserted before H1 titles.
Now your can insert page breaks anywhere you want using the CSS class page-break.
To do so edit a Text report item and switch to HTML edition mode (the ** button). Then simply add class="page-break" on any element:
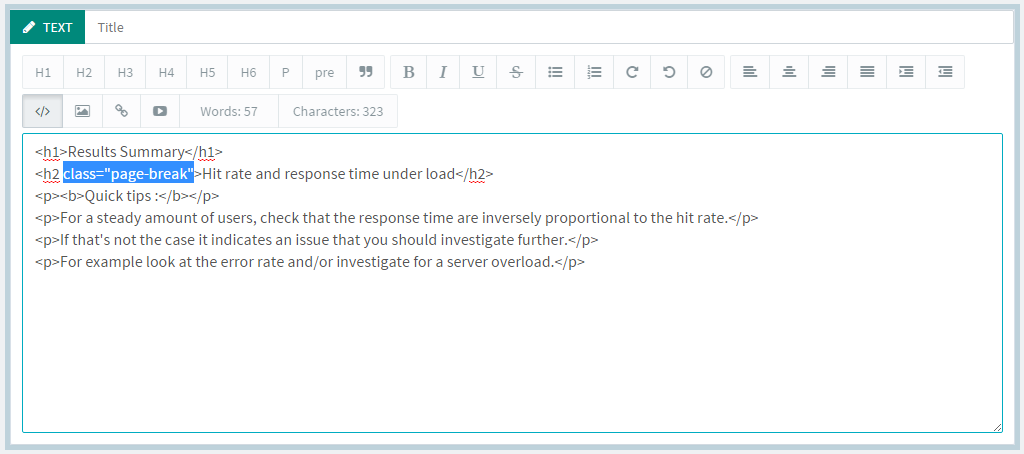
A line is displayed in the preview of the Text item. This line is replaced by a page break when exporting the report as a PDF file.
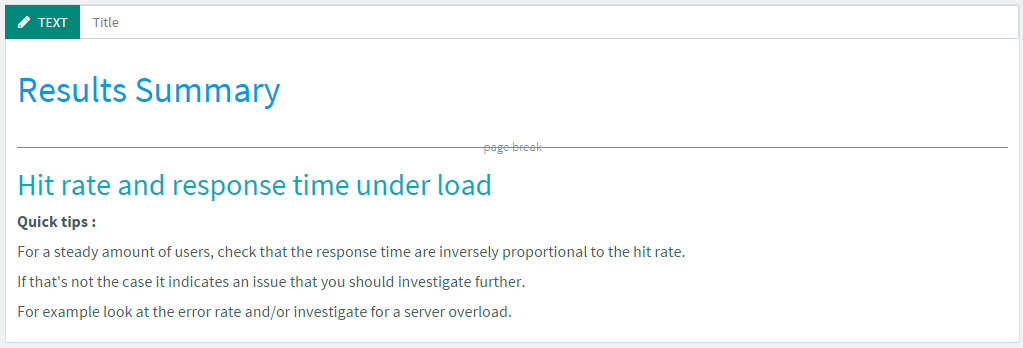
Pretty useful when you want to space out the layout of your performance test reports.
CTRL + s maniacs
When working on a word document or writing code in Eclipse, I may press CTRL + s a dozen times per minutes.
Just to make sure my work is saved. If you're like me, you probably developed this habit after losing an hour of work when your computer crashes.
To fulfill our strange needs, the last version of OctoPerf comes with a small but important feature: a Save button:

This button is present on the Project, Virtual User, Scenario, and Report pages. It lets you force the save operation if there are pending modifications. And the shortcut is, of course, CTRL + s. You can also wait a few seconds and OctoPerf will automatically save.
We also added a warning message if you try to close the application with pending changes. So there is no way you can loose your precious work.
