
OctoPerf 11.7 - Pacing, monitoring, dynatrace and more
Article Summary
OctoPerf 11.7 focuses on more realistic load control, deeper monitoring, and stronger observability integrations.
New pacing options make it easier to model user behavior beyond simple concurrency.
Load agent monitoring now exposes JVM-level metrics to better detect bottlenecks.
Dynatrace integration has been refined for clearer correlation between load tests and APM data.
Reporting and runtime controls are improved to simplify comparisons and execution tuning.
Table of Contents
Introduction
This new release of OctoPerf brings a lot of long awaited features. This is all based on your feedback, so make sure to let us know what you would like to see in OctoPerf next!
Of course we have a few plans of our own for the future, but I strongly believe that a good software can only result from a good collaboration between users and developers.
Improvements
Pacing your execution
Throughput
If you ever had to execute a load test campaign you are probably aware that it's not only a question of concurrent users, you also need to define the execution rate of each user.
JMeter provides a Constant throughput timer that is also available in OctoPerf, this way you can define a target hit rate and the timer will increase or decrease to try to maintain this rate:

The main problem with this timer is that it is incompatible with anything that influences sub requests like the automatic resources and follow redirects option.
It's also often difficult to translate real business transactions activity to a certain number of hits/s.
Pacing
But when you come from a load testing background you might also be familiar with iteration pacing. The idea is to define a minimum duration for each iteration and wait until this minimum time has elapsed before moving to the next one.
This is not natively available in JMeter but to make matters easier, we added the option to OctoPerf:

This can be combined with think time override, but it is mutually exclusive with the throughput option, since both achieve the same goal but with a different method.
New Load agent monitoring
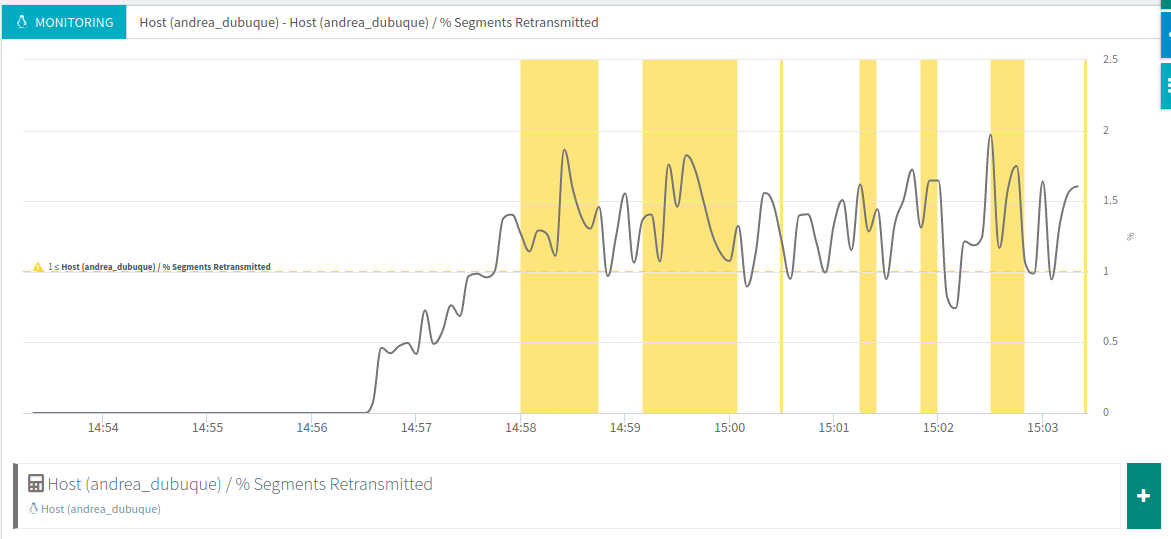
OctoPerf has provided load agent monitoring for a while now.
It automatically triggers alerts when one of the key metrics is over the limit, for instance here with segments retransmitted:
But this monitoring at the operating system level is flawed since it doesn't show what's going on inside JMeter's Java virtual machine. That is why we've added new metrics such as heap memory used:
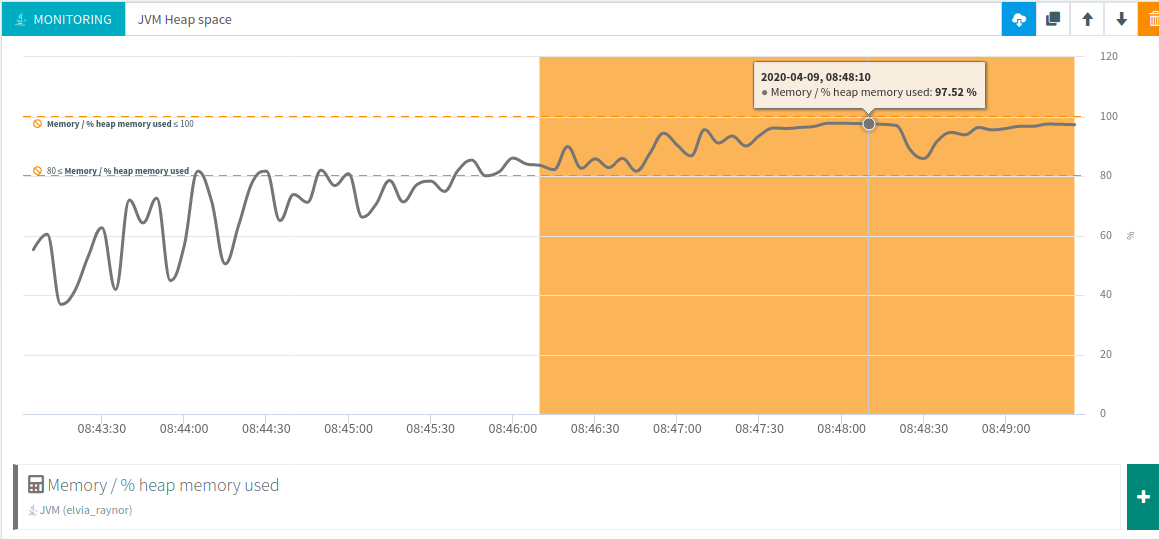
But also a lot of others like garbage collection times and threads.
Better Dynatrace integration
We have also reworked our Dynatrace integration to make its results even more relevant.
You can activate it from the runtime screen as usual:

Then each request will have an additional header:

All the details about how this header is computed can be found in our documentation.
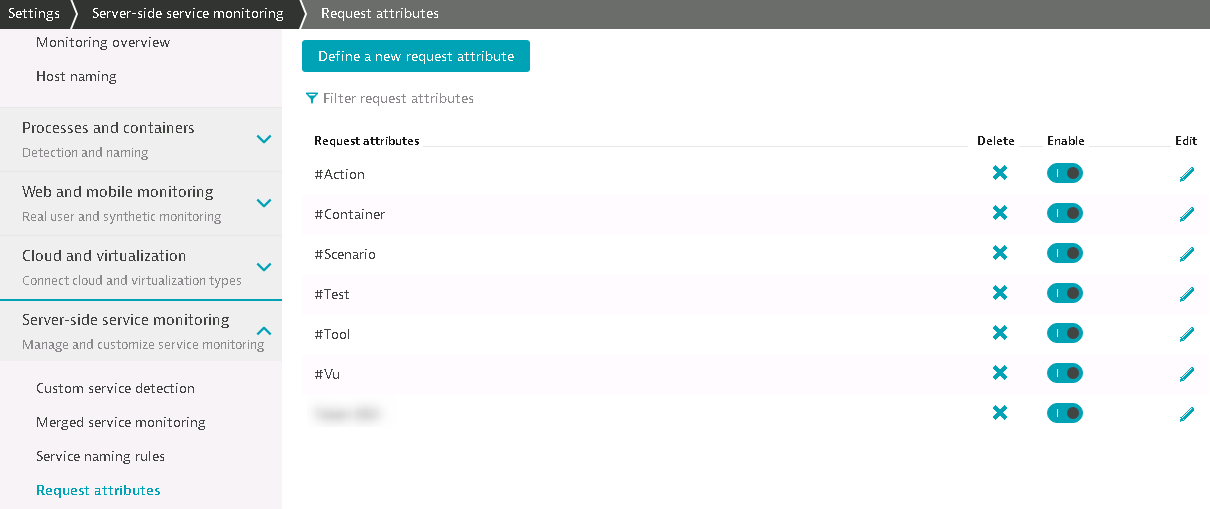
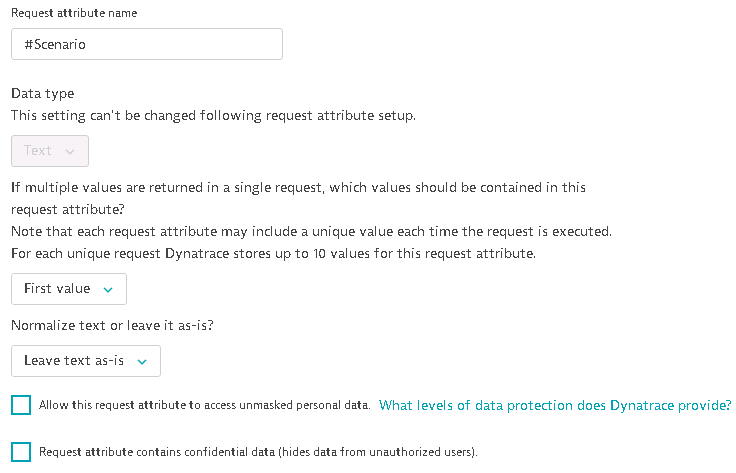
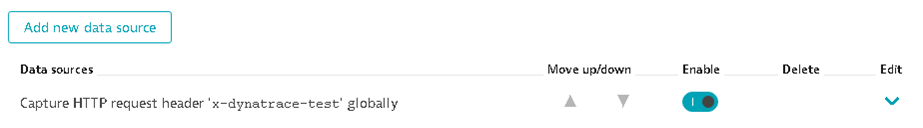
Then in Dynatrace you can capture the values passed in this header this way:
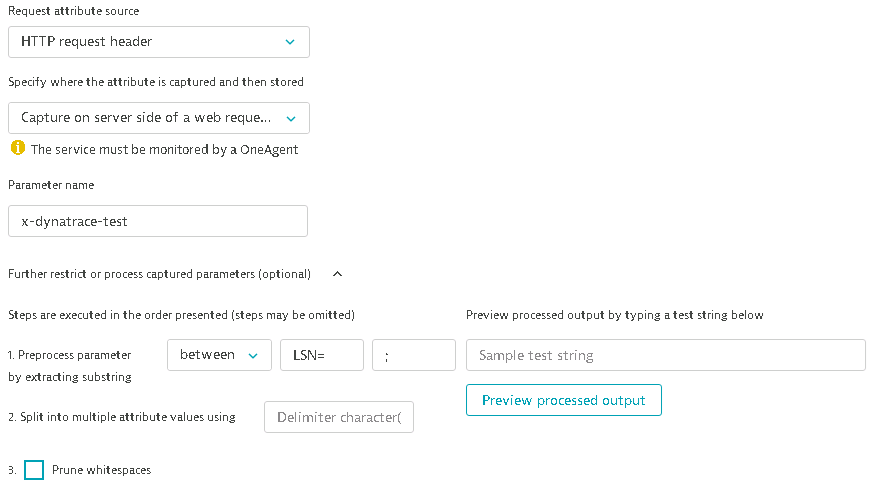
This will give you a much better overview of your load test from inside Dynatrace. And you can correlate it with any other relevant metric during your tests.
Comparison report labels
Previously, when creating a comparison report each test result was labeled Result A, Result B, etc...
We've added a new option to rename the labels so that you can create even simpler comparison reports:
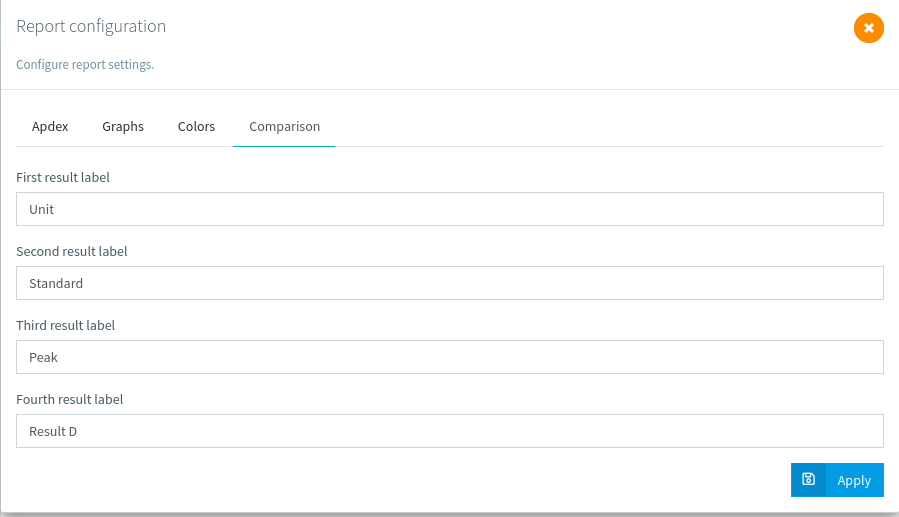
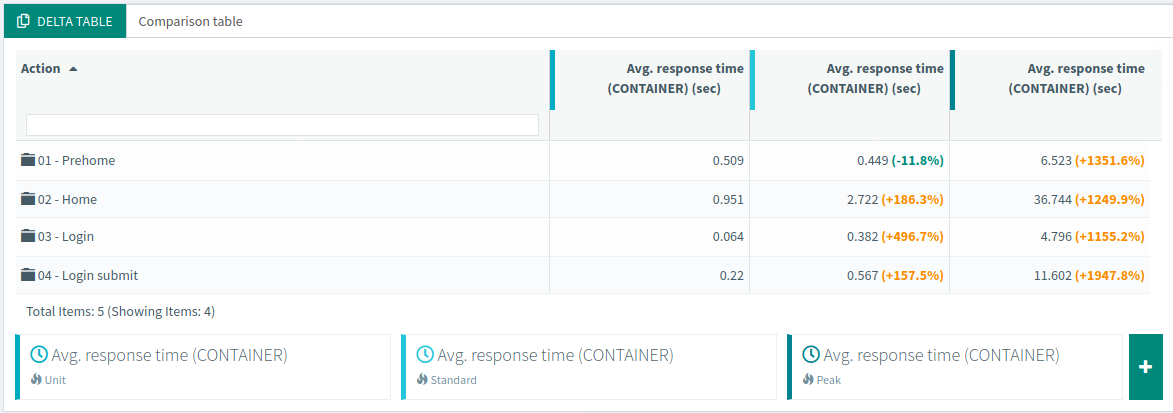
After that all the labels will be updated:
Auto resources
Automatic resources can be activated from the design screen, on each request. But when you want to change your strategy and deactivate the automatic download of resources, it can be tedious to deactivate it for each request of each virtual user. So instead, we've added the option on our runtime screen:
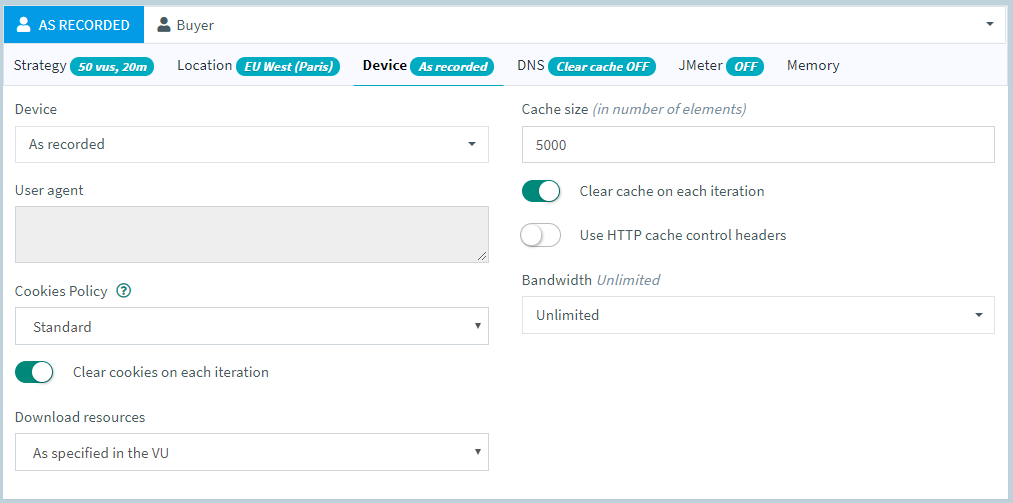
You can chose to leave them as they are, or force activate/deactivate them.
Zipped dataset upload
Another important topic is the upload of dataset files, when working with large files and automation, it can take a lot of bandwidth and/or time to upload the files.
We've added a possibility to upload a group of zipped files to make that process easier:
Just make sure your filename ends with .unzipme.zip and we will automatically pick it up.
Full changelog
For the complete list of fixed bugs, please refer to 11.7 Release Notes.