OctoPerf 11.9 - Azure on demand, new JMeter, setup/teardown threadgroups and more
Article Summary
OctoPerf 11.9 expands load-testing capabilities with Azure on-demand load generators and broader cloud coverage.
The release updates JMeter to version 5.3 and adds native support for setup and teardown thread groups.
Improved agent monitoring introduces load-average tracking to better detect performance bottlenecks.
Runtime properties can now be shared easily across load generators for coordinated test behavior.
Reporting is enhanced with a redesigned Top chart highlighting the slowest transactions.
Table of Contents
Introduction
Here we are for yet another new release of OctoPerf. We've actually released two minor versions since the last update post, but this time we will also release a long awaited feature, Microsoft Azure on demand load generators!
We kept it in our beta version for a while since we wanted to be absolutely sure it can be used for proper testing. We are quite satisfied with it at the moment, but note that the agent startup time is much longer on azure than on other providers, you should expect to wait a few more minutes if you are using it.
Of course we also have other new and exciting features to share, so let's dive into it.
Improvements
Azure load generators

As stated in the introduction, you can now select Azure load generators from the locations tab of your runtime profile. This opens up a lot of new locations and will help you test your applications under even more realistic conditions than before.
Of course it comes with all the usual features like retry on agent startup failed and load generator monitoring live during the test.
New AWS zones
We've also taken this opportunity to add two new AWS zones to the list:
- Cape Town - South Africa
- Bahrain
This will again improve our geographical coverage and allow you to run more realistic tests.
Improved agent monitoring
We have been improving our load agent monitoring quite a bit in the past few months. There's one more metric we wanted to add to the list of counters we automatically watch: the load average.
The only issue is that we know that the load average is going to increase and pass the defined threshold when the response times increase on an application. That's simply the way JMeter threads will behave when waiting for network I/O that will cause this. The only way to know for sure is to compare it with the average CPU usage. If the CPU usage is low while you experience high load average, then the cause is the increasing response times:

We were not sure if adding this counter and threshold would generate more problems than it would solve since it could be confusing. But we'd rather provide as much information as we can when possible. We hope you will agree. Otherwise let us know and we can remove the threshold. But let's be honest, if there's no alert anymore, nobody will go look at the load average, so we might as well remove it entirely.
JMeter 5.3
A new minor version of JMeter was released a few weeks ago and as usual we have updated all our agents to use it. The most notable change is the Groovy engine update.
Our investigations do not show any major change in existing scripts but we will keep watch to see if it has an impact on existing Groovy scripts.
Setup/Teardown threadgroups
On to the main course of this update, we added support for Set Up and Tear Down threadgroups.
That was probably the last main feature of JMeter we were not able to handle and we had to go through quite a bit of rework to implement it in our model. But the good news is that you can now configure any thread to be a Set Up/Tear Down from the runtime profile advanced menu:

More information on the mechanics behind it and all the parameters you can use is available in our documentation page.
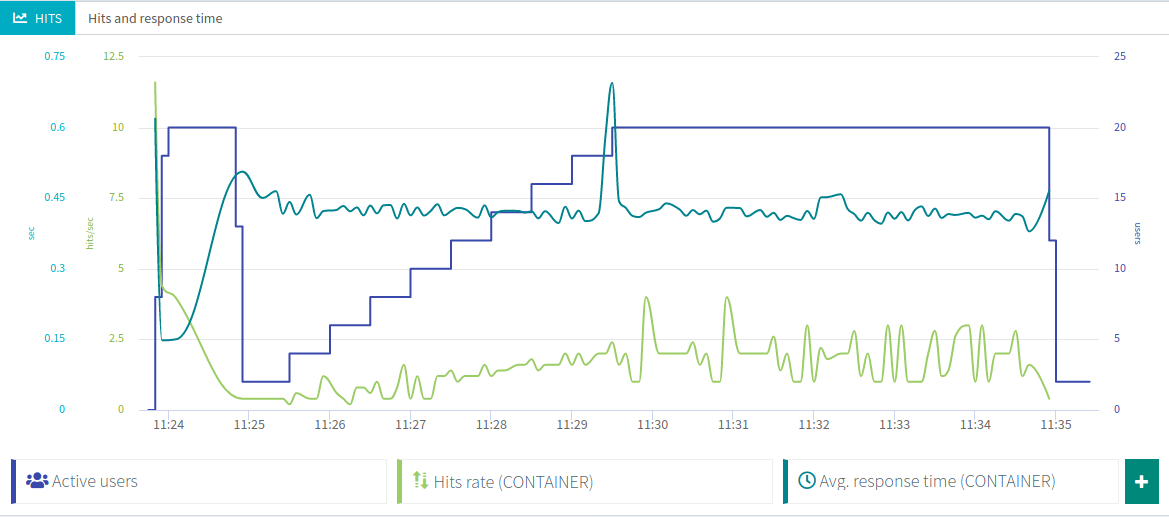
During a test you can expect to see something like this:

And inside the result tree you will be able to see the Set Up/Tear Down results:

Share a runtime property
We used to have a workaround that you could use to share a property between all your load generators.
But it was complex to setup, so instead we made it into a new logic action:

This will create a property on all the load generators during your test, which is a good way to have them share a new session token and have it refreshed every one in a while by a separate virtual user.
In the above example you could then use : ${__property(sessionToken)} in all your other scripts to get the value of this property. And if you want this to happen only once at the beginning of the test, just add a Set Up user with a Global scope. That way only one of the load generators will execute this user to create the property once only and then all of them can use it.
Top report item
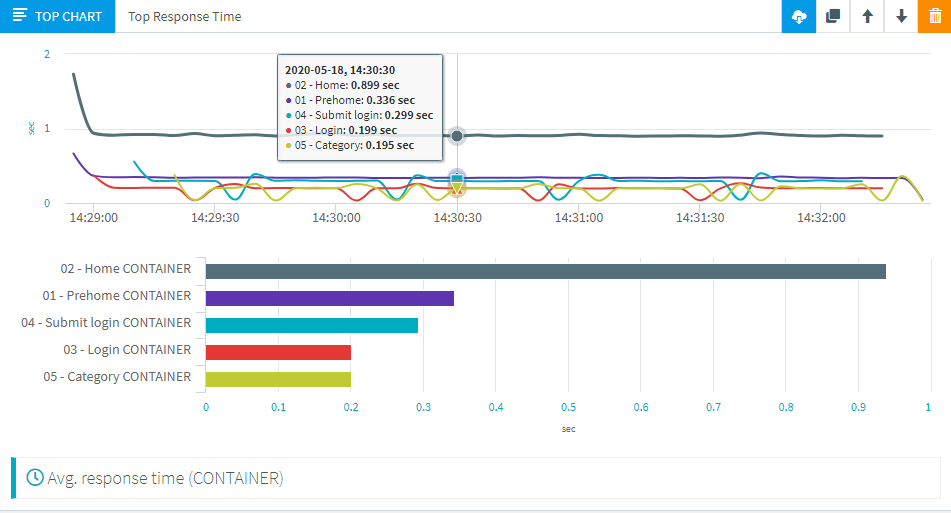
And last but not least, we've refreshed the Top chart item. This one used to be one of the least used report items, so when someone told us they would like to have a line chart with the slowest transactions, we figured we could do two birds with one stone and overhaul the existing Top chart:

You can of course configure it to show requests instead of containers or other stats than response times as usual.
Full changelog
For the complete list of fixed bugs, please refer to 11.9 Release Notes.
