
OctoPerf 7.2 is released
We recently released a new minor version of OctoPerf. It includes many improvements in terms of usability and also support for a new monitoring technology. Let's have a look at these.
Usage logs
One of the main feedback from our large customers was about how difficult it can be to follow the activity on a workspace.
We decided to implement a new section in the subscription page that will log every test done on the current workspace:
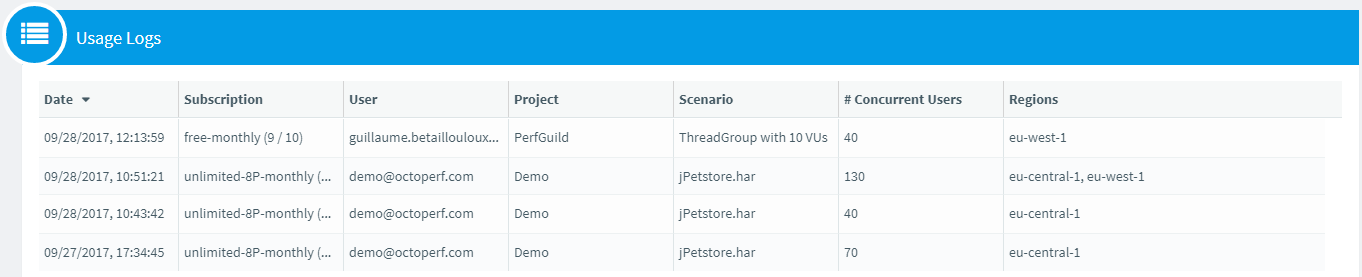
This way you can quickly assess if you need to upgrade or downgrade your subscription.
CSV Randomization
Another frequently asked feature was the possibility to shuffle the lines inside a CSV file automatically.
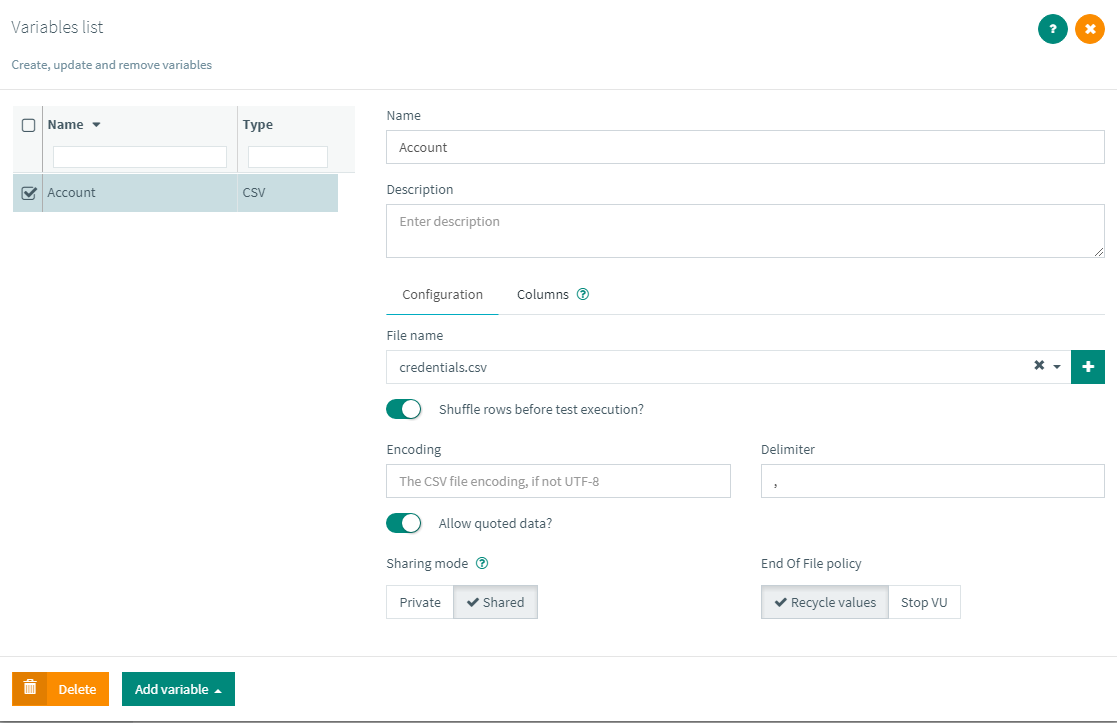
Combined with our file distribution system, you can make sure every user will have access to a unique random value during the test.
Cookie policy
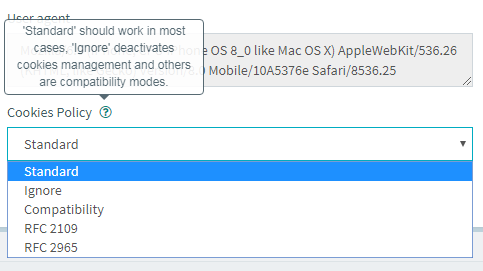
Sometimes automatic cookies are adapted to the way your application handles cookies. Also you might be using a diferent implementation than the default one. Which is why we allowed selection of the cookie policy before running a test:
Frameworks
My personal favorite feature of this release is what we call frameworks. Our correlation rules already allow you to automate dynamic parameters, but we wanted to take that one step further. Frameworks are pre-existing correlation rules for particular technologies that you can add to your project in one click:
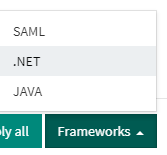
You can then apply them right away and all correlations will be taken care of for you:
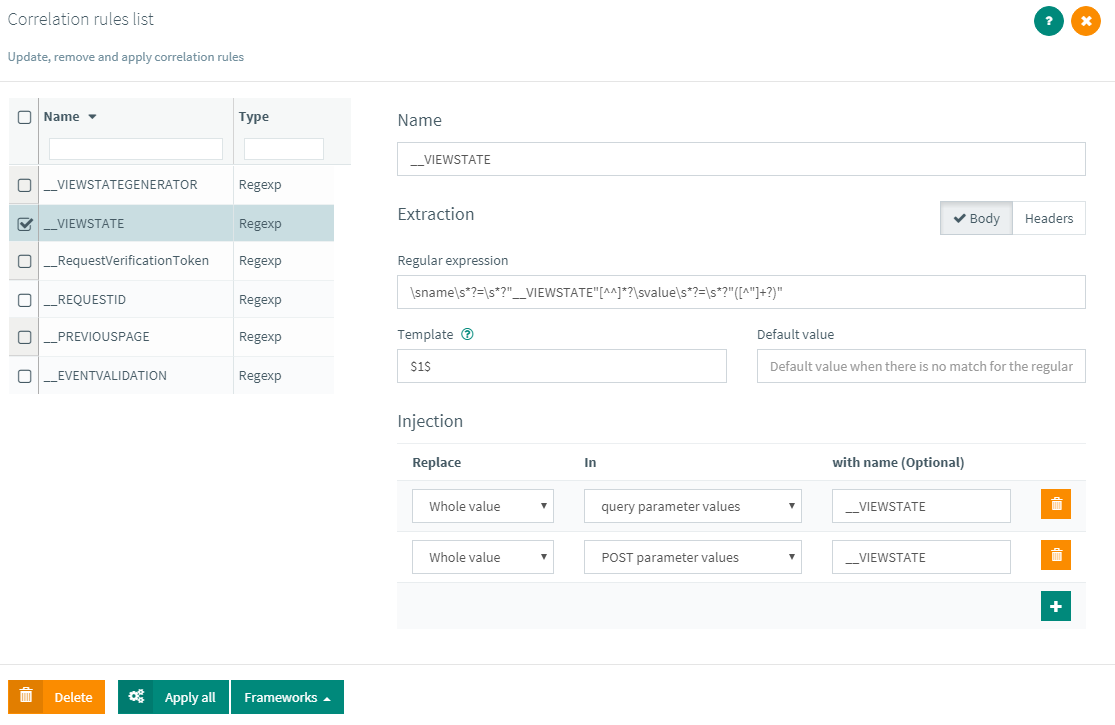
Frameworks are really quick for us to add, so feel free to send us your suggestions.
Runtime wizard
Running a test in OctoPerf used to be a one click process, but we had a couple of issues with this because:
- Some scripts might not be in a good shape,
- Monitors might not be working anymore,
- You might want to use a different subscription than the default one.
So we created a 3 steps runtime wizard that will take care of all these:
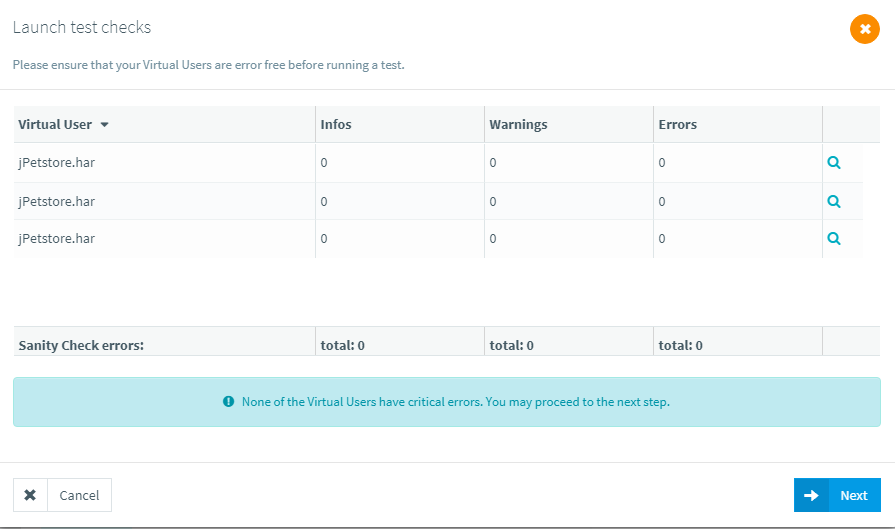 First scripts are sanity checked for ambiguous variable names and other critical topics.
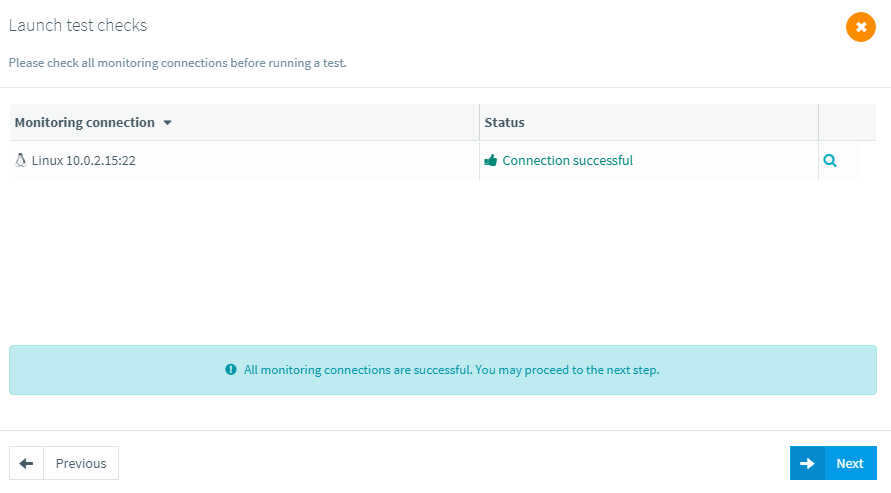 Then every active monitor is double checked.
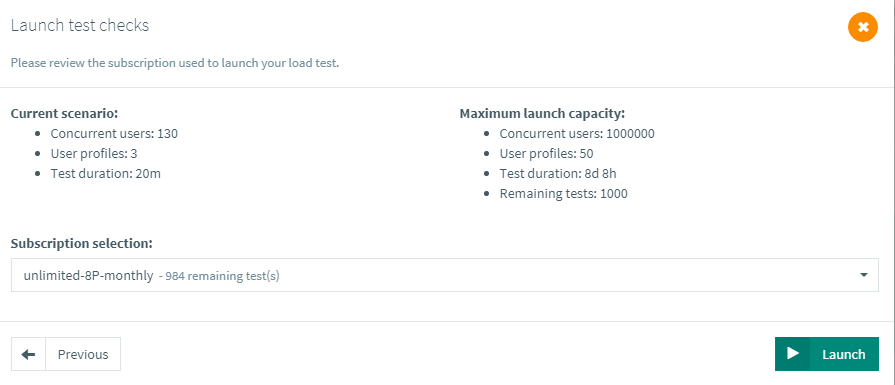 And finally if our algorythm has selected a subscription you do not want to use, you can select another one.
Also if no subscription matches, you'll be notified of what's the issue.
And finally if our algorythm has selected a subscription you do not want to use, you can select another one.
Also if no subscription matches, you'll be notified of what's the issue.
Responses formatting
As all web applications communicate using different content types, sometimes it's hard to find the proper readable format for them. We've improved this by adding new response formatters:
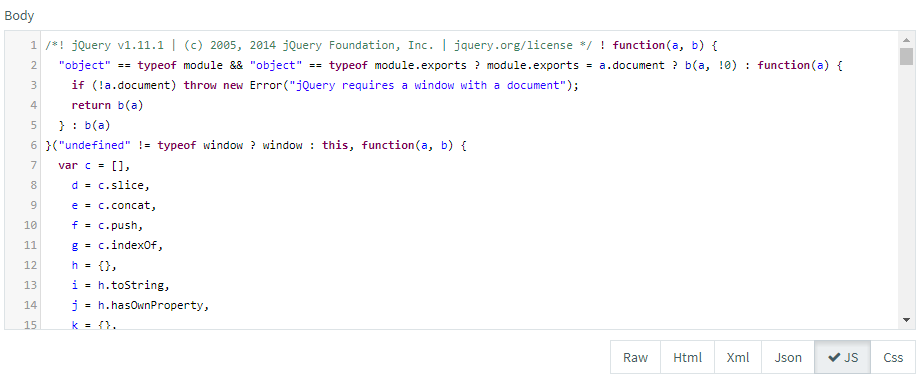 Here it is for JS.
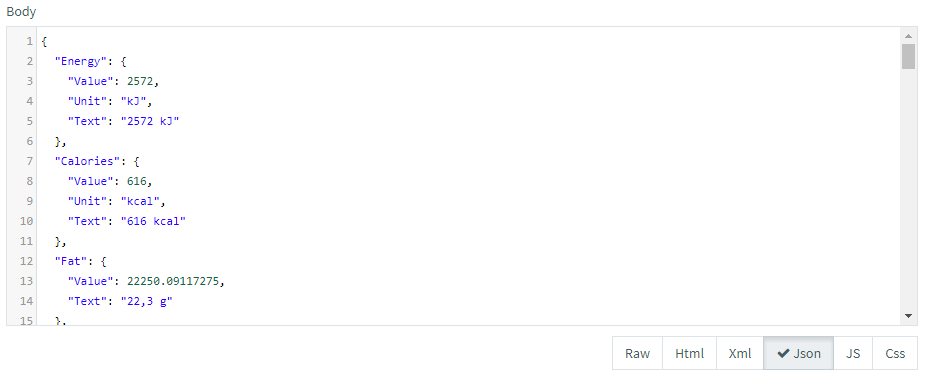 And another example with JSON.
The right one will be selected by default, making it much easier to read server responses.
MongoDB
As I mentioned in the introduction we've also added a new monitored technology with MongoDB. You'll benefit from the usual pre-selected counters and easy configuration thanks to our centralized agent:
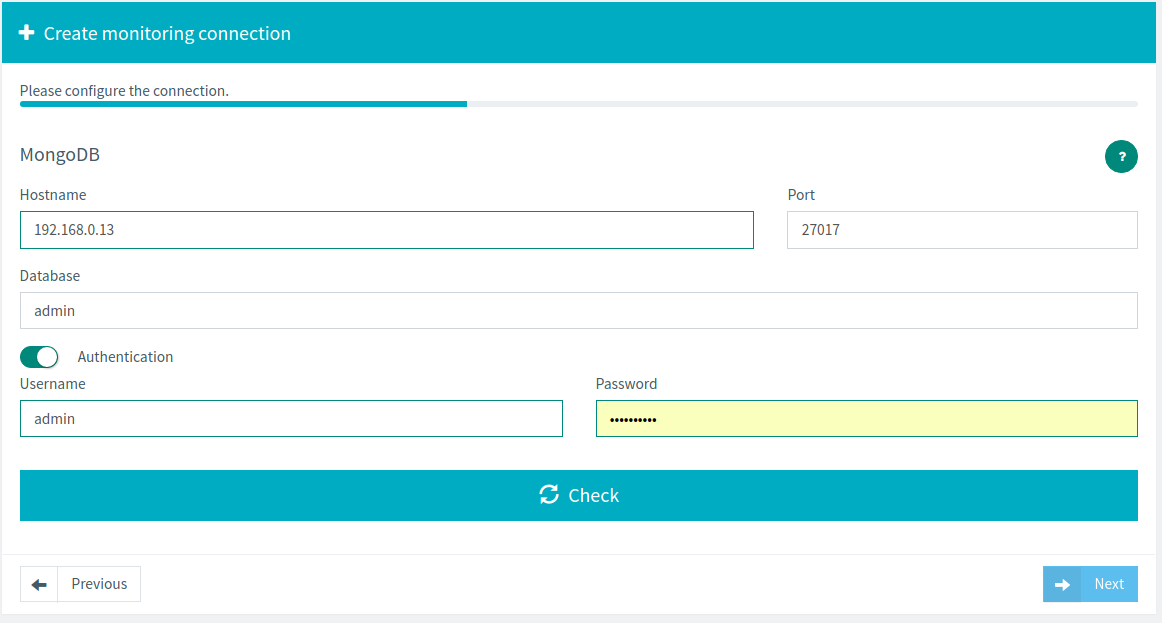
And of course all this to display the counters along with response times and other metrics.
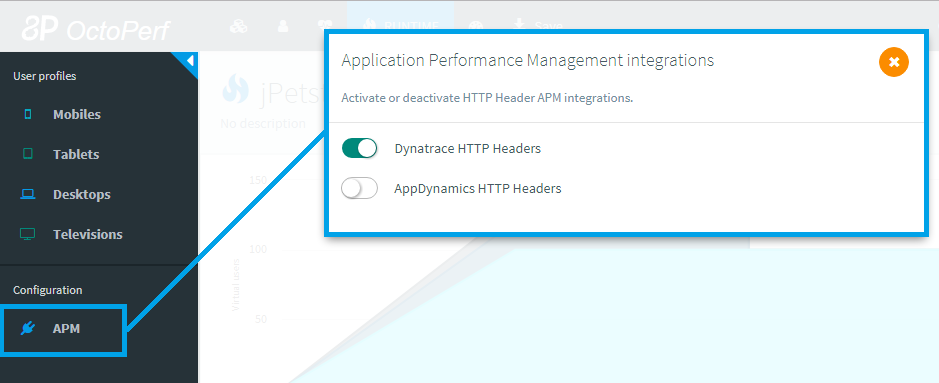
APM integration
And last but not least we developed the integration with APM solutions. This way you can get additional stats inside AppDynamics or Dynatrace regarding the load generated by OctoPerf. Which is another step toward easier reporting and analysis.
MOAR Features
As I usually say in these posts, most of these features come from your feedback so please keep telling us what you need. And once again, a big thanks to all of you.