
OctoPerf v12 - Scheduler, slack integration and UI upgrade
Summary
OctoPerf v12 introduces a powerful test scheduler, Slack/mail/webhook notifications and a redesigned UI for clearer navigation.
- The scheduler automates recurring load tests using UI settings or cron expressions, while notifications ensure teams stay informed.
- Navigation between workspace, project, design, and runtime has been streamlined to surface key features more intuitively.
- New debugging tools, including a JMeter-style Debug Sampler and cache manager toggle, improve test transparency.
- Quality-of-life additions: ad blocker control, global test rescaling, project moving between workspaces, and new AWS regions—round out the release.
- This version lays important groundwork for easier automation, cleaner workflows, and smoother day-to-day usage.
Table of Contents
- Introduction
- Improvements
- Scheduler
- Notifications
- Improved menus
- Debug sampler
- Deactivate cache manager
- Ad blocker
- Rescale entire test
- Move project from one workspace to another
- New AWS zones
- Documentation
- Full changelog
Introduction
It's been some time since our latest major release, in fact OctoPerf v12 is probably our biggest/longest coming release to date. There's of course been a couple of minor versions this summer and we'll also cover them but first let's focus on the new killer features: the scheduler, alerting through slack/mail and a better UI for the menus.
The scheduler is the first item left on our original roadmap (back when OctoPerf was still called jellly.io). Of course we've got a lot more planned on our current roadmap than back then, but still it's an important landmark for us! We've decided to merge it with notifications through slack integration or mail so that you can get the best out of these scheduled tests.
At the same time we've worked on the menus to highlight all the possibilities instead of hiding them in sub-menus.
Improvements
Scheduler

Obviously the scheduler options are very close to the runtime options, with the added bonus of being able to tag it on the fly. The actual scheduling can be done through our UI or directly through a cron expression:

Scheduled tests results will be available on the analysis page the same way as regular tests, and on top of it you'll get a recap of these tests on the scheduler page:

Notifications
Launching the test is one thing, but it is also important to be made aware of the results somehow. That's the notifications' purpose, and you have 3 ways to achieve it:
- Slack integration
- Mail notification
- HTTP webhook
For instance, if you use slack, you can create an incoming webhook by following the procedure in their documentation.
In our case we will be assuming that:
- The webhook URL is
https://hooks.slack.com/services/T00000000/B00000000/XXXXXXXXXXXXXXXXXXXXXXXX, - The user that created the webhook is named
Demo, - You have an
#octoperfchannel andDemocan post into it.
In OctoPerf it would look like this:

And here's how it will look in slack:

You might want to use the filters to remove smaller tests from the notifications in order to avoid getting too many messages.
Improved menus
Over the years as we kept adding more and more features, we've always struggled to find their proper place in the UI. Because of this many settings were hidden in sub menus where it would not make much sense, typically for monitoring you had to be inside a project and open the upper right menu. If you were at the workspace level, the monitoring would not show. This was very confusing and something had to be done.
Workspace and Project
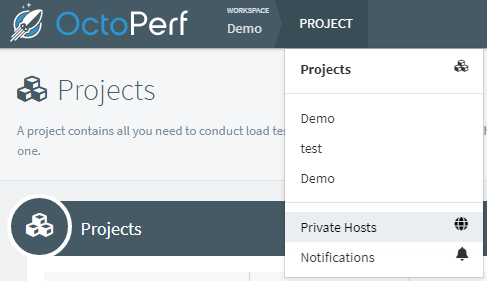
Instead of having the workspace in the upper right, we've decided to have the upper menu display workspace and project next to each other:

This makes more sense since a project has to be part of a workspace. Also we hope this organization is easier to figure out for new users.
The upper menu will display the 3 top Workspaces or projects based on their Last modified date.
Project
Here we can find settings that are at workspace-level:
The reasoning is that to display the list of projects you have to be inside a workspace. So at the same level you can also access:
Design configuration
The design screen has always had a less than ideal layout since a few of the menus were global to the entire project, yet only accessible when a virtual user was opened. Which is why we've moved them also on the design menu:

Thanks to this you can edit variables, and other settings directly from the menu, whenever you are in the project.
Runtime
And last but not least, the runtime menu now also includes the new scheduler and the monitoring screen, since these are two aspects you want to configure prior to launching a test:
Debug sampler
The debug sampler is a JMeter action well know of advanced users. It displays the state of all variables and properties at a specific time in the execution. We added it to our UI so that you can also use it to track the value of your parameters or post processors:

Deactivate cache manager
When a test is launched in OctoPerf we automatically generate a JMX based on the settings you selected. A cache manager was always added, but you could deactivate all its actions if required. We noticed that in some situations it is better to not have a cache manager at all, which is why we've added a toggle next to the cache size:

Ad blocker
We used to have a URL filter for new scripts that would remove some domain names, typically for large websites or advertising/sponsored links. But we ended up deactivating it because some of our customers were actually on this list. We've reintroduced it but it can be deactivated from the virtual user creation page:

In case you are unsure if you should leave it or not, you can just try or you can check the list of blocked domains:
- https://github.com/gieljnssns/Social-media-Blocklists,
- https://www.securiteinfo.com/administration-systeme-et-reseau/outils/ultimate-hosts-blacklist.shtml,
Rescale entire test
This one is a quick but very helpful option on the runtime screen:

It allows you to increase the entire runtime all at once, this way we will maintain the same ratio between the existing profiles. Typically you can duplicate your standard test and use this setting to increase the load of all the profiles in the duplicate to make it a peak test.
Move project from one workspace to another
Moving a project between workspaces is an important minor feature we added earlier this summer. Most OctoPerf users originally need time to figure out all the possibilities of workspaces and how it fits in their organization. This allows everyone to properly reorganize things even after projects or tests have been run:

New AWS zones
We've also added two new AWS zones to the list:
- Milan
- Hong kong
We hope that these will help you test under even better conditions.
Documentation
We've reworked our documentation, we've been mostly moving things around for a better readability. But as the documentation contains a huge amount of information, it was about time we made it easier to browse.
In terms of content, one of the major addition to the documentation is the test startup process page.
Over the years, the test startup process was updated quite often, to better handle datasets, to deal with JMeter properties, hosts files or other complex situations. This guide explains, step by step, every action we take before and after JMeter's execution. We hope it will clarify how you can control the underlying JMeter or just save information before the docker containers are destroyed.
Full changelog
For the complete list of fixed bugs, please refer to OctoPerf 12 Release Notes.