
Open source Load Testing tools comparative study
Summary
Different open-source load-testing tools report response times in very different ways, and default settings can drastically affect results. A single test scenario was executed with JMeter, Locust, Gatling, and K6 using identical load, connection reuse disabled and a shared target URL. The study shows major discrepancies across tools due to differences in TCP/TLS handling, connection pooling, DNS resolution, and timing definitions.
JMeter and Gatling report values close to browser timings, while Locust reports significantly higher numbers and K6 under-reports unless metrics are combined. Understanding how each tool measures response time is essential before comparing results or drawing performance conclusions. The key takeaway: trust results only when you know exactly what the tool is measuring and how its configuration impacts the load.
Table of Contents
Introduction
When using a testing tool, it is only logical to trust its results. And the more well-known the tool is, the more trust we put in it. Furthermore, how could we know it is wrong ? After all, who is in a position to judge the judge ? This phenomenon is particularly true in the load testing community, since the field is still something of a niche among the testing world. Finding deep-dive studies about the actual technical aspect of load testing is difficult. Those observations led to the creation of this study. In this article, I will compare the results obtained for the exact same load test using 4 different open-source load testing tools: JMeter, Locust, Gatling and K6. These softwares were chosen because they are among the most used and/or discussed in the community, but in the future the goal will be to add others, including the ones that are not open-source.
The goal of this comparison is not to point any fingers and decide which tool is right or wrong. The objective is to try to understand what we measure within each tool, and what it means for our performance tests.
Methodology
Load profile
The same URL will be called on each tool, with the exact same load profile.
The URL tested will be https://petstore.octoperf.com, using a GET request.
The load will consist in 500 concurrent users, during 6 minutes, a 1 minute ramp-up, with each user generating a request then waiting 5 seconds:

Those tests will be executed from the same machine, using the same internet connection.
And before I get started, since this will be a simple test using a single HTTP request, it is important to look at all the steps we expect to go through. In particular regarding TCP connexion and SSL context.
TCP and SSL reuse
When a request is sent by a user toward a server for the first time, part of the response's time consists in:
Opening the TCP connection
This is when the connection is established between the client and the server. A 3-way handshake is made for synchronization purposes.

For more information about that subject: TCP handshake
The TLS Handshake
When a user requests a website over HTTPS, after opening the TCP connection, it must send a series of datagram to initiate a secure way of communication through the TLS encryption protocol.

For more information about that subject: TLS handshake
For this comparison, those handshakes will be performed during every request sent, in order to simulate a new user accessing the URL during each iteration. This required configuration changes in each tool, making this comparison even more interesting.
Setup
K6
K6 load tests configuration is made through JavaScript files.
The configuration change made to force the handshakes to be done on each iteration was the following one:
noConnectionReuse: true,
More information about that option can be found in K6 documentation.
Here is the JavaScript file used:
import http from 'k6/http';
import { check, sleep } from 'k6';


export const options = {
  noVUConnectionReuse: true,
  scenarios: {
    TestCompaNoReuse: {
      // arbitrary scenario name
      executor: 'ramping-vus',
      startVUs: 0,
      stages: [
        { duration: '60s', target: 500 },
        { duration: '5m', target: 500 },
      ],
      gracefulRampDown: '10s',
    },
  },
};

export default function () {
  http.get('https://petstore.octoperf.com');
  sleep(5);
}
JMeter
The JMeter configuration was made through OctoPerf:

The "keep-alive" option was disabled in the scenario configuration:

Locust
Locust uses Python file to configure the requests that are going to be sent during the test.
Here is the code used in this comparison:
import time
from locust import HttpUser, task, between

class QuickstartUser(HttpUser):
    wait_time = between(5, 5)

    @task
    def prehomepagemain(self):
        self.client.get("/")
        self.client.close()
I used the following option to prevent users from reusing connections:
self.client.close()
The rest of the configuration (number of users, ramp-up, targeted host) is then made through Locust UI:
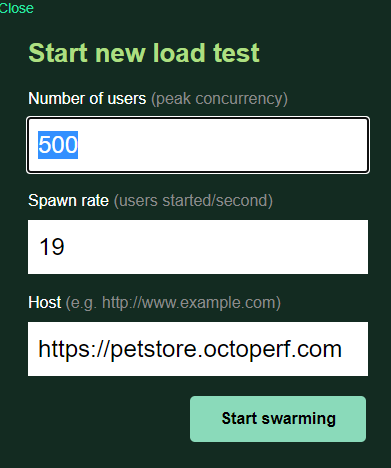
The first time I launched the targeted load using Locust, a message appeared notifying me that the CPU was overloaded and the response time were a lot higher than what I was expecting.
I found out that by default Locust only uses one core among all the available ones on the load generator. In order to use more, I need to distribute the load among what Locust calls "workers".
The following commands allowed me to create a "master" that would orchestrate the load and "workers" that would generate it:
locust -f my_locustfile.py --master
locust -f my_locustfile.py --worker
In order to get relevant measurements I launched several tests with more and more workers, until the response times stabilized:
| 1 Worker | 2 Workers | 3 Workers | 4 Workers | |
|---|---|---|---|---|
| Average Response Time | 1,053 s | 0.205 s | 0,145 s | 0.150 s |
Gatling
Gatling's configuration is possible through Java files, here is the file used during this comparison:
package com.octoperf.tutorials.three

import scala.concurrent.duration._
import io.gatling.core.Predef._
import io.gatling.http.Predef._
import io.gatling.jdbc.Predef._

class PetStoreSimulation extends Simulation {

    val scn = scenario("PetStoreSimulation")
        repeat(1000).on()
        .exec(http("Homepage").get("/"))
        .baseUrl("https://petstore.octoperf.com"))
            }

    setUp(scn.inject(rampUsers(500) over(60))).protocols(httpProtocol)

}
Results
First of all here's the results from Chrome dev tools point of view:

It's been executed many times in order to make sure the value displayed here is consistent.
And here are the results using the default settings of each tool:
| Average Response Time (s) | 90 Percentile (s) | Hits count | |
|---|---|---|---|
| JMeter | 0,081 | 0,095 | 32280 |
| K6 | 0,01959 | 0,02107 | 32253 |
| Gatling | 0,071 | 0.132 | 33551 |
| Locust | 0.150 | 0.280 | 31821 |
Notice how the results are all different. The two closest tools are JMeter and Gatling with "only" a 15% difference with Chrome, while Locust displayed higher response times. K6 stands out, with really low values.
Let's dive into those tools' documentation to understand how they calculate their values.
JMeter
Here is an excerpt from the JMeter documentation:
JMeter measures the elapsed time from just before sending the request to just after the last response has been received. JMeter does not include the time needed to render the response, nor does JMeter process any client code, for example Javascript.
Which means that it starts at the connection and stops when the last byte of the response is downloaded:

If I compare the average response time to that specific part of the timings measured on Chrome, the results are very close (81ms / 83,6ms).
K6
A lot of HTTP metrics are displayed by K6 in the report. I initially selected http_req_duration as the value that I would use in my article.

After realizing that this value was very different than what I could see in Chrome and in the other tools, I dug a bit deeper and understood that it was only a small part of the actual request timing.
From K6 documentation :
http_req_duration: Total time for the request. It's equal to
http_req_sending + http_req_waiting + http_req_receiving(i.e. how long did the remote server take to process the request and respond, without the initial DNS lookup/connection times).

Which means that to get something comparable to what JMeter calls a response time, we probably have to calculate the sum of:
http_req_duration + http_req_connecting + http_req_tls_handshaking
The value we get is then 0.109s, which puts it in the same ballpark as the other tools but DNS time is not measurable.
Fair warning, I was unable to assess if http_req_connecting and http_req_tls_handshaking are either:
- parallel like in Chrome,
- sequential like the measurements above suggest.
Through k6 documentation and my experience I found examples that contradict both assumptions. So if you have more information about this, feel free to share it so that I can update this article.
Gatling
Here how the response time is described in Gatling's documentation:
The response time is the elapsed time between the instant a request is sent and the instant the complete response is received
- The beginning of the request’s sending is the instant when the connection to the target host has been established or grabbed from the pool.
- DNS resolution time,
- TCP connect time,
- TLS handshake time,
- HTTP round trip.
- The end of the response’s receiving is the instant when the whole response (status, headers and body) has been received by Gatling
It also explains that DNS, TCP and TLS timings are not available using the free version of Gatling so we will not be able to see if they are accurate in this comparison. This is a shame since it would seem that the DNS time is cached automatically when comparing with our measures in Chrome 71ms/66.78ms.

Locust
I didn't find any clear indications on how the response time was calculated. We can see that the value is way higher than the other ones so the value possibly includes everything (Connect time etc..) but I haven't found a logical explanation for that difference.
Conclusion
As we were able to observe, using a tool without knowing exactly what is going on under the hood can lead to deceiving results.
First, default configuration of each test will lead to different ways of handling connections. These different configurations will lead to:
- Different loads on the targeted servers
- Different results in your report
Secondly, the way each tool is calculating the response time is different, which is important information to have when analyzing the results. Different conclusions might have to be made. For example if you're testing an application that requires a CDN, then the DNS resolution time will be an important part of your tests. And we've seen that several of the tools used do not measure this at all.
Other than that, no tool is absolutely right or wrong, and you can pretty much achieve the same thing with all of them. The most important things while load-testing are:
- Knowing what you are actually doing, and what you are actually analyzing,
- Using a tool that has reproducible results, so that when you compare your results between different load tests, you are actually comparing meaningful data.