
Real-time analytics with ElasticSearch
When we first started to think about real-time analytics, we though that our previous experience in load testing would help us to get quickly to something working fine. It always seems easy to rethink about a problem you already solved in the past. We were totally wrong.
We wanted to provide our users a completely new analytics experience when load testing their website. Our requirements are :
- Real-time: users should not wait the end of the test to analyze results,
- Blazingly Fast: users should experience sub-second response times, regardless of the number of concurrent virtual users,
- Scalable: we must be able to scale horizontally as the number of users grows,
- Reliable: the analytics system should be redundant to provide fault tolerance and avoid outage,
- Testable: we should be able to easily verify through unit testing that the analytics system is working correctly,
- Open-source: we don't want to build this by ourselves. We believe that it's not our job. We don't want to waste our time reinventing the wheel.
We placed the bar very high. If you want to reach the moon, shouldn't you somehow aim for the stars?
Many new open-source projects, like Druid or InfluxDB, are emerging to provide real-time analytics. Which one to choose? Which one best suits our needs? The more solutions there are to evaluate, the longer it takes.
Proof of Concepts
Druid.io
![]()
While I was working for TapValue, a nice company about real-time marketing statistics, I found Druid while looking for a new real-time analytics system. The company was shifting from Real-time Bidding to Multi Channel Retailing: it was time for them to adapt their solution to the new target market.
Druid is a great tool for ingesting timeseries data and serving them real-time. The following architecture diagram, taken from Wikipedia, shows how druid works:
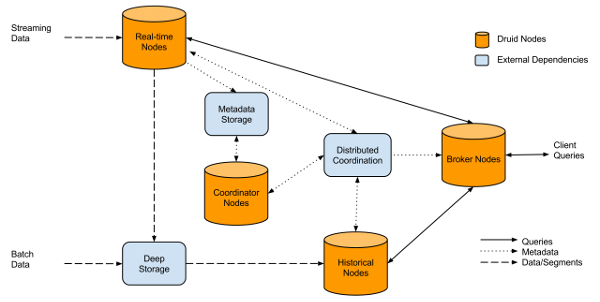
Druid is composed of a bunch of machines with different roles:
- Real-time nodes: to ingest the data,
- Broker nodes: the broker receives queries and dispatches them to the data nodes,
- Data nodes: as their names says, those nodes store the data.
We ran through a number of Proof of Concepts, which took months, to find out that Druid finally did not match our expectations:
- Unconsistency: Druid works with statistical approximations. The returned results vary even with consistent input datasets,
- Expensive architecture: Druid requires many machines to run fine. This is a show-stopper for us as we don't have the cash today to feed such an hungry system,
- Not testable: we could not figure out how to test our analytics system with Druid using simple JUnit tests.
Druid seems to be a great project, but it isn't suited for our needs and company size.
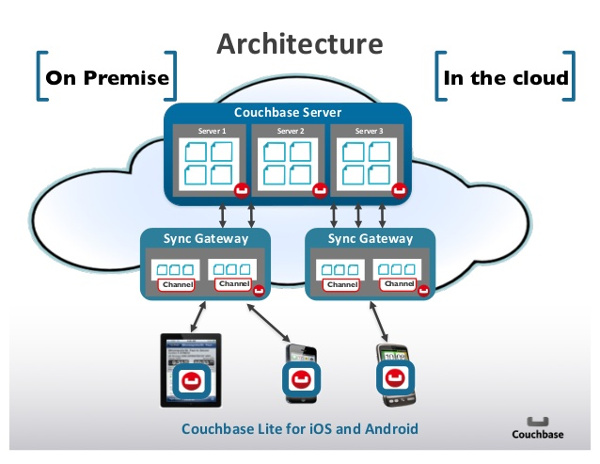
Couchbase
We were already using Couchbase for our data layer. Couchbase is very fast, and easy to scale. It's also easy to install, and they provide a Reactive Java Client API, using RxJava.
The biggest challenge with Couchbase was to query results with different dimensions:
- Region: the Cloud region of the load generator (USA, Europe, Asia etc.),
- Virtual User: which virtual user is linked to the results,
- Request: going down to every single request to get accurate statistic about each.
For each combination of these dimensions, we needed to create a dedicated Couchbase view like:
if(doc && doc.region_id) {
  emit(doc.region_id, null);
}
Couchbase views allows to index JSON documents on specific fields. The example above, indexes the JSON documents on region_id field. You can then query the JSON documents by their region_id field. It quickly becomes tricky: we need a couchbase view for every combination of the dimensions. (region, region and user, region and user and request, etc...)
We also faced the following issues:
- Database-only: Couchbase does only limited computation on json fields like sum or stat,
- Speed: the query time linearly increases with the number of hits stored. With a test with more than 1 million hits, the query takes more than 1sec to get all the documents,
- Computation in REST server: as the database only returns us the relevant JSON documents, we needed to develop the statistical computation in our REST server.
We clearly had a big performance issue with this technical solution. The next was a great performance improvement.
ElasticSearch
![]()
After spending a weekend reading the ElasticSearch (ES) documentation, I began to understand how powerful and simple it is. ElasticSearch is Apache Lucene distributed and fault tolerant. It allows to store arbitrary JSON documents and perform search queries on them.
But, we were more interested into Aggregations. Previously named Facets, it allows to perform a great number of statistical computations on JSON document fields. It was time to throw away the Couchbase analytics code! ElasticSearch is incredibly easy to install: download the archive, unzip and run. It provides insanely high query speeds (around 100ms most of time).
Marvel is a great tool to monitor the ES cluster.
We use AWS Discovery plugin to connect ElasticSearch nodes and REST servers all together without messing around with Amazon Elastic IPs. The ElasticSearch cluster can be grown automatically simply by starting a new machine with the right Amazon EC2 AMI. Removing a node is as simple as stopping the machine. ElasticSearch takes care of replication and node failures.
Improvements
Aggregating Data
Instead of storing a JSON document for every request sent, we aggregate them. It consists of grouping several request statistic into a single JSON document. This document then only contains, min, average, max for each statistic. There is some loss of information.
Aggregation is done by time. We aggregated result for a given time sample: for example, requests are grouped by 10sec interval. This gives enough statistical accuracy and greatly reduces the number of results to store into the database.
By aggregating results, we achieved to reduce the number of data to store by a factor of 10, and even more when the test generates a high number of requests per second. The cost is some minimal loss of information, but it's still acceptable for a load test. Aggregation improved Couchbase queries speed by the same factor. Although it seems amazing, it only shifted the problem to 10 millions hits tests, instead of 1 million hits tests. The problem is still there, it just happens later.
That's still not enough. We're not into over-optimization. But waiting several seconds for a single graph curve is not acceptable.
Refactoring
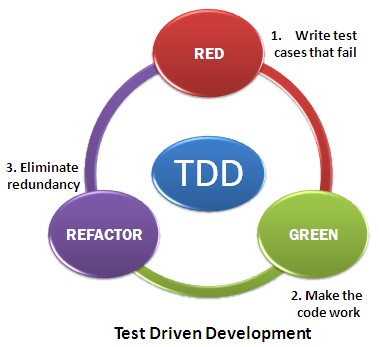
We refactored the reporting code 7 times until it met our requirements. When you're a startup willing to be quickly on the market, it seems crazy. In fact we don't think we lost time doing this. Wouldn't our customers waste their time waiting our application to respond with a badly designed performance reporting?
It's never a waste of time to change code that doesn't fit the needs, or completely throw away deprecated code. It's nearly impossible to get an optimal solution working at the first write. We think that well-tested and well-written code is easy to garbage. And it should be garbaged as soon as it doesn't meet the requirements anymore.
Kafka Queue
![]()
Apache Kafka is a distributed messaging system. It's a must have when you build a component which pushes data to another one that consumes them. Kafka is written in Scala and designed to be fault tolerant, scalable and high-throughput.
Architecture Overview
The following diagram gives a simple overview of our current technical architecture for the reporting system:
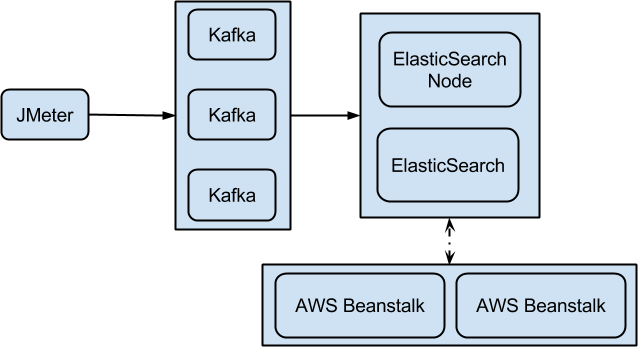
Our architecture is fully horizontally scalable with the following components.
- JMeter: JMeter is running inside Docker containers on Apache Mesos slaves,
- Kafka: Kafka queues are running themselves inside Docker containers on Apache Mesos slaves,
- ElasticSearch: ElasticSearch is running on separate EC2 virtual machines, with a specific AMI.
- Beanstalk: our Rest API is hosted on Tomcat 8 containers on AWS Elastic Beanstalk.
Our Rest API is exposed to our AngularJS Web UI. It performs the aggregation queries on ES and returns the result as JSON.
Every component of this architecture is fully scalable and fault tolerant. A quorum of Zookeeper nodes, not shown here, is used by both Apache Kafka and Apache Mesos for cluster management. Zookeeper is managed itself using Netflix Exhibitor.
Going Further
The following articles give some good advices on how to use and get the best out of ElasticSearch:
- ES Documentation,
- ES in Production,
- Indexing Performance Cheatsheet,
- Configuring ES for High Performance.
Thanks to ElasticSearch, OctoPerf is able to provide nearly real-time test results analysis with fast response time.
Lessons Learnt
What we learnt the hard way while designing our tool:
- If a solution doesn't fit, don't force. Try another one,
- Be ready to garbage your code, even if it looks beautiful. If this code is not adapted to the needs, there is no reason to keep it. And if your application is well designed, replacing one of its components should be easy to do.
- You can't build the perfect system on the first try. Or you're very lucky,
- Use open-source technologies, widely. Contribute to them. Don't reinvent the wheel, unless you want to create a square wheel.
- Drink a beer. Take a shower. Best ideas usually pop when you don't expect them.