
Scalability Testing
We are going to look at scalability testing in this Blog Post. On paper scalability testing is simple because all you are doing is increasing the load, but there are some common pitfalls that can be easily avoided. So you need to really understand what you are trying to achieve before you start.
Basic Principles
Let’s start with the basic principles: A scalability test is the process of systematically increasing load on your application under test until
- You reach your goal in terms of desired load,
- The system starts to become unresponsive.
If you want to get a clear picture of whether your application does scale then it is important to run your scalability test on an environment that is consistent with production, or how you expect production to be.
Clearly one of the objectives of a scalability test is to size the environment so you must also have the flexibility to increase the resources in the environment in which you are running this test.
To determine the above, your scalability testing depends on the answer to two fundamental questions:
-
Are you looking to determine how far your application can scale.
-
Are you looking to determine if your application can meet your expected growth.
Once you know which one you are trying to achieve, which may be both things, then you can define your load profile.
Load Profiles
This needs to be the first thing you do when running a scalability test, define what you are looking to do in terms of scaling load.
We discussed above that you should ask yourself two questions which will help in defining your load profile.
Before we come onto that you need to determine what your starting point is and what you are going to increase.
As a scalability test would normally happen after you had determined that the application under test was able to manage your peak load profiles then your peak volume load and concurrency levels are the best place to start.
Another important consideration is, are we just interested in scaling transactions or are we also interested in scaling the number of threads that simulate a virtual user.
If you are testing API’s then you may be able to support the increased load with a consistent number of threads whereas if you are simulating a user journey, then you will also need to systematically increase your thread count as well.
We mention the phrase ‘systematic’ several times through this post and this is important in your scalability testing, any load increases should be in managed increments and not random or inconsistent.
One of the mistakes that can be made in scalability testing is making the time between increments too long which can make your scalability test run for a very long period. There is no reason to spend more than 10 minutes per increment as this should give you enough time to document the impact of the load on your application and infrastructure. If it does not then you can extend it.
In case you just want to see if your application can handle your expected growth estimations, then a good approach is to:
- Deduct your starting transaction rate from your final transaction rate,
- Divide by 5,
This will give you a test across one hour with 5 incremental 10-minute period of increase load.
For example, is we are starting at 50 transaction per second and we want to try and determine if our application can support 250 transactions per second then our profile would be something like this.
(250 target transactions – 50 starting point transactions) / 5 increments = 40 transaction increase per increment
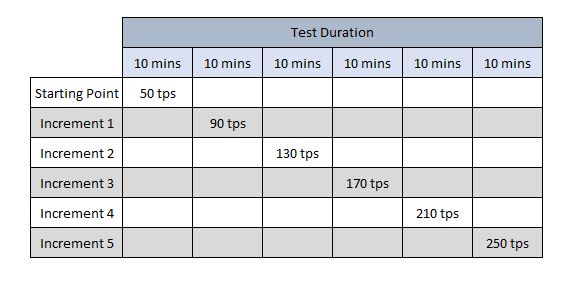
If, however you have decided you want to push your application to the point at which it breaks then an alternative approach is better.
Using the approach above to reach application failure can take a while and therefore a better approach is to - double the load until failure, - incrementally reduce the load to find the point of first failure,
Using our example above we would increment load like this.
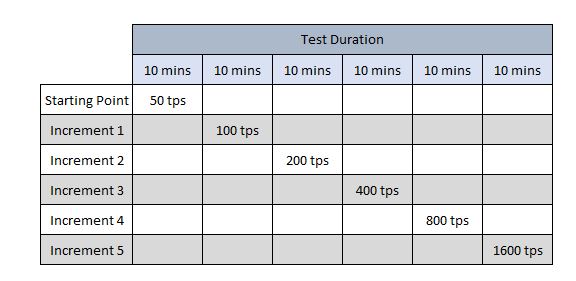
If then we found that 800 transaction per second was fine but 1600 transaction per second resulted in failure, then we run another test using our original approach where the starting point is 800 transactions per second and our end point is 1600 transactions per second.
(1600 target transactions – 800 starting point transactions) / 5 increments = 160 transaction increase per increment
Measuring load and analysing results
So, we have determined our profile and before we move onto looking at how we would construct a JMeter test, let’s look at the analysis side of a scalability test.
The most obvious is looking at how the transaction response times are affected as the load increases as analysis of transaction response times between increments is a powerful and relatively easy thing to do. Consider using percentages as a way of measuring any degradation as reporting per a unit of time can become meaningless depending on how long the transaction took at the start.
For example:
If Transaction A takes 1000ms at the starting point and increases by 500ms during each increment, then we would say that Transaction A increased by 2500ms when all increments were completed.
If Transaction B takes 10000ms at the starting point and increase by 500ms during each increment, then we would also say that Transaction B increased by 2500ms when all increments were completed.
On the surface this is the same level of degradation but as the starting points are different, we should measure as a percentage so we can compare all transactions equally.
So based on the above example:
- Transaction A increased by 150%,
- Transaction B increased by 25%,
These are extreme examples but show how data can be misinterpreted.
The other obvious things to measure are impact on Memory (including the Garbage Collection policy) and CPU.
As load increases so will the resources consumed on the infrastructure, but how it increases can tell you a lot about your application.
- Does it scale in a linear fashion ?
- Is there a direct correlation between load and resource consumption ?
- Do the application resources scale exponentially ? (ie doubling of load results in a significant increase in resources).
There are clearly many other things you can measure including throughput rates of Message Queues or Topics and how their queue depths are managed as load increases.
When monitoring your application as load increases, the other consideration is to determine if you can - scale horizontally, - scale vertically.
Assuming our goal is to reach a throughput rate defined by our expected growth then we expect to reach this target. In which case it is different from a test to see how far we can push the application. This is a test to determine what will happen when these volumes are reached as we will expect to reach them at some point in production.
If we fall short in the ability of the application to support the target load, then we need to scale up our application and the options are - vertically where you add more instances of the same specification , - vertically where you keep the same number of instances but increase CPU and Memory etc,
Our scalability test gives us the opportunity to determine how best our application scales so that when we are faced with increased load in a production environment, we know how to best increase the hardware capacity.
Is it your application that is suffering?
When running a scalability test, if you are seeing high response times it may not be your application that is causing the issue. If we are clearly seeing high CPU and Memory then it probably is but it may be something else. If your application relies on interfaces to either internal services or 3rd party services are these sized as production? If not this may be the cause of your performance issues. We have already discussed the fact that your application under test must be hosted on production sized infrastructure, and it follows that interfaces need to follow the same rules.
It is certainly worth looking at using stubs for interfaces for all your performance testing not just your scalability tests.
Another common pitfall is that your load injector can be the source of the slow performance. If the host does not have enough CPU or Memory then this is not going to be able to support your load test. This can lead to the tool reporting slow response times due to its inability to support your load profile.
JMeter tests for scalability
We have discussed how you might think about your scalability tests and define what your load looks like, lets take a practical look at how we would write a scalability test using JMeter.
One of the simplest ways is to use the jp@jc – Throughput Shaping Timer, this is added as a JMeter PlugIn.
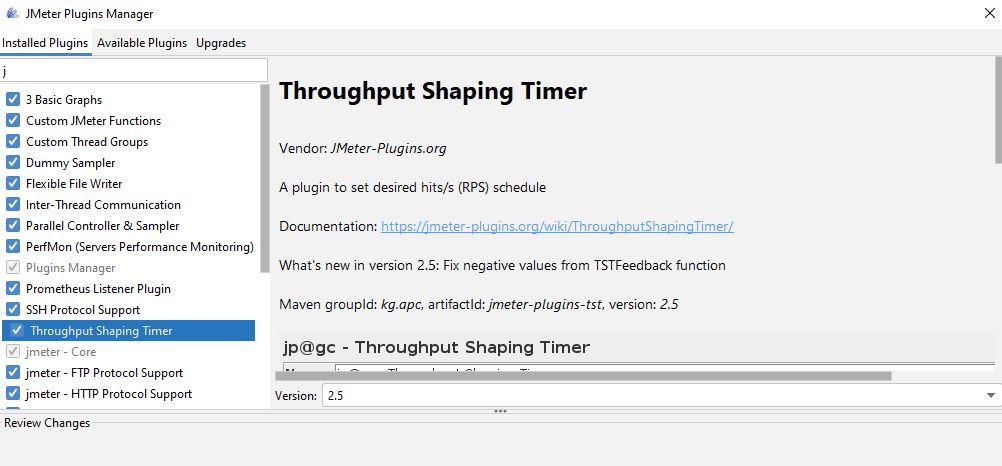
Let’s build a Test Plan with a Thread Group and add the Throughput Shaping Timer to it.
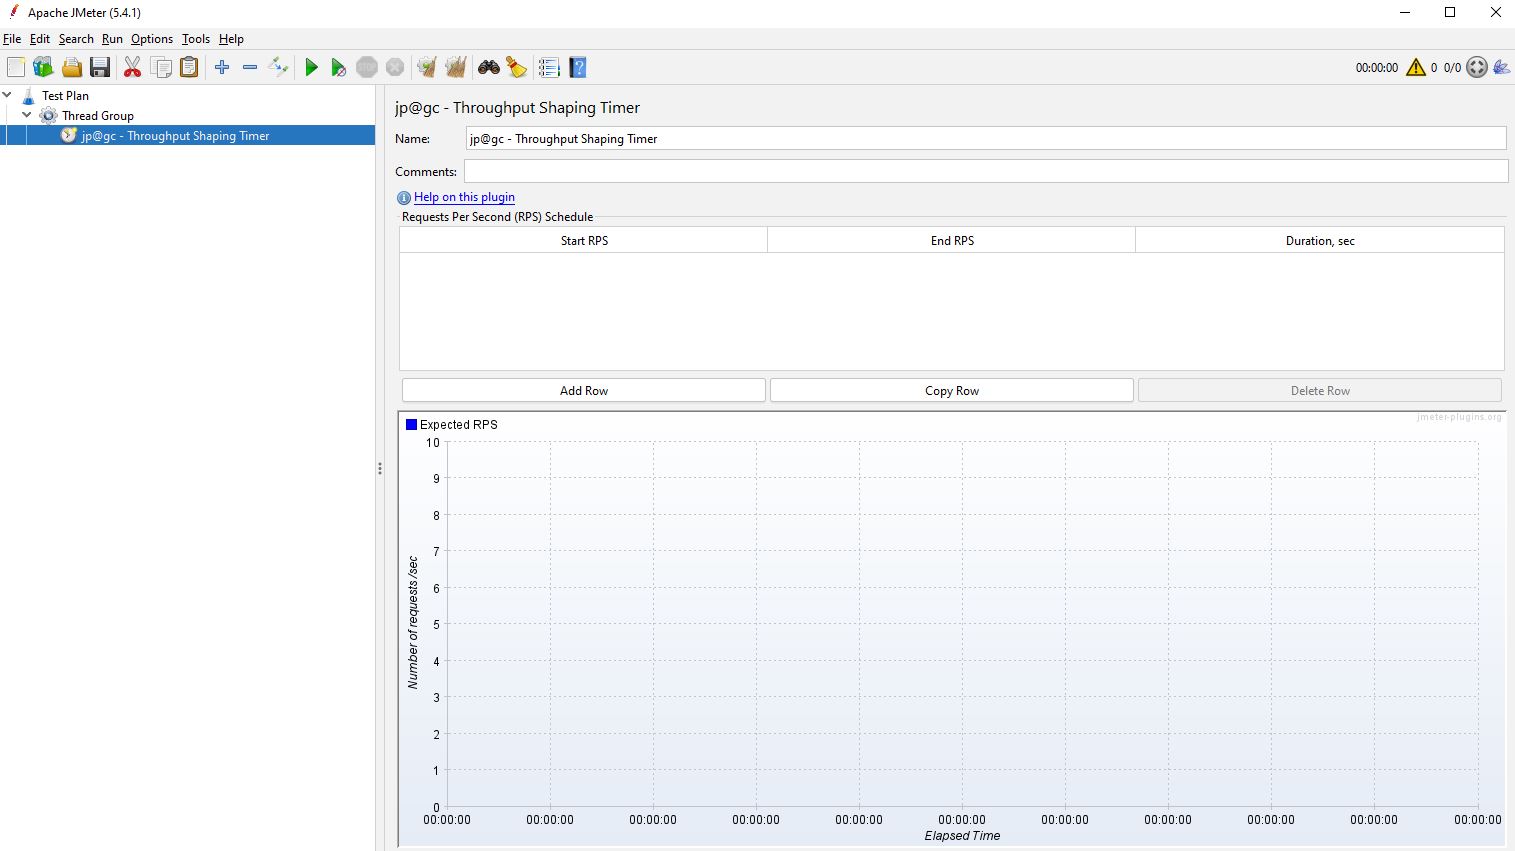
If we take our load profile, we defined earlier in this post.

We can translate this into this Throughput Shaping Timer.
It is always best to have a ramp up period between increments and therefore our timer will look something like this.
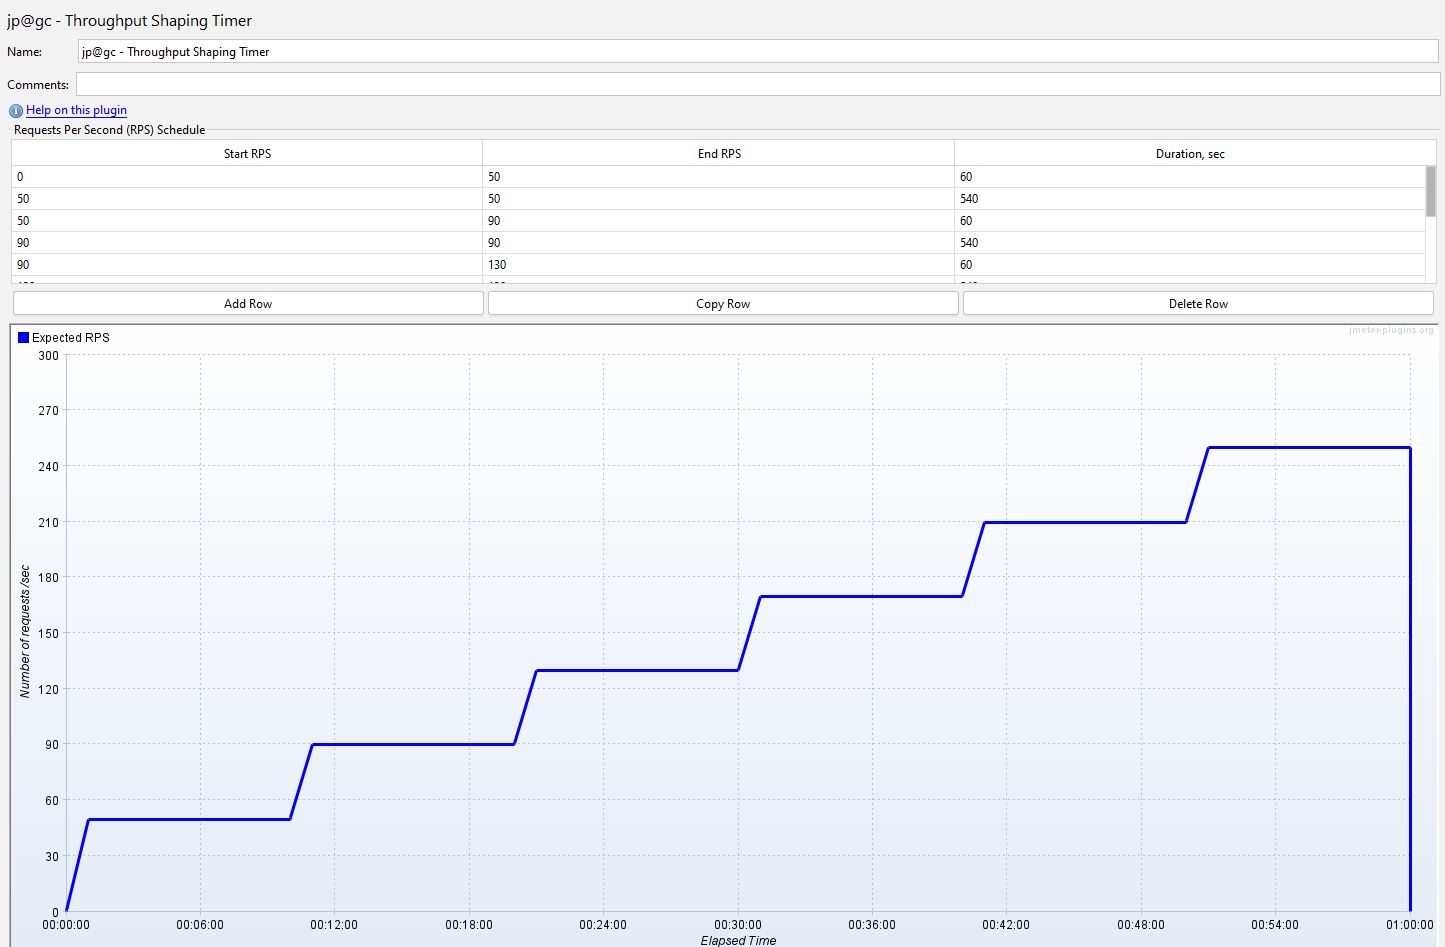
The definition pane at the top is obscured but basically the load is defined like this.
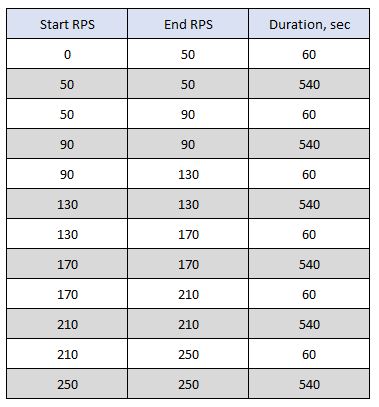
What we are doing is: - starting at 0, - ramping to 50 transactions per second over 60 seconds, - remaining at a steady state for 540 seconds, - ramping from 50 transactions per second to 90 transactions per second, - remaining steady for 540 seconds, This pattern continues throughout the test.
If we add a Dummy Sampler to our test and for the purposes of this test reduce the stable load time from 540 seconds from 54 seconds and reduce the increment time from 60 seconds to 6 seconds.
We will then run the test and check the requests per second.
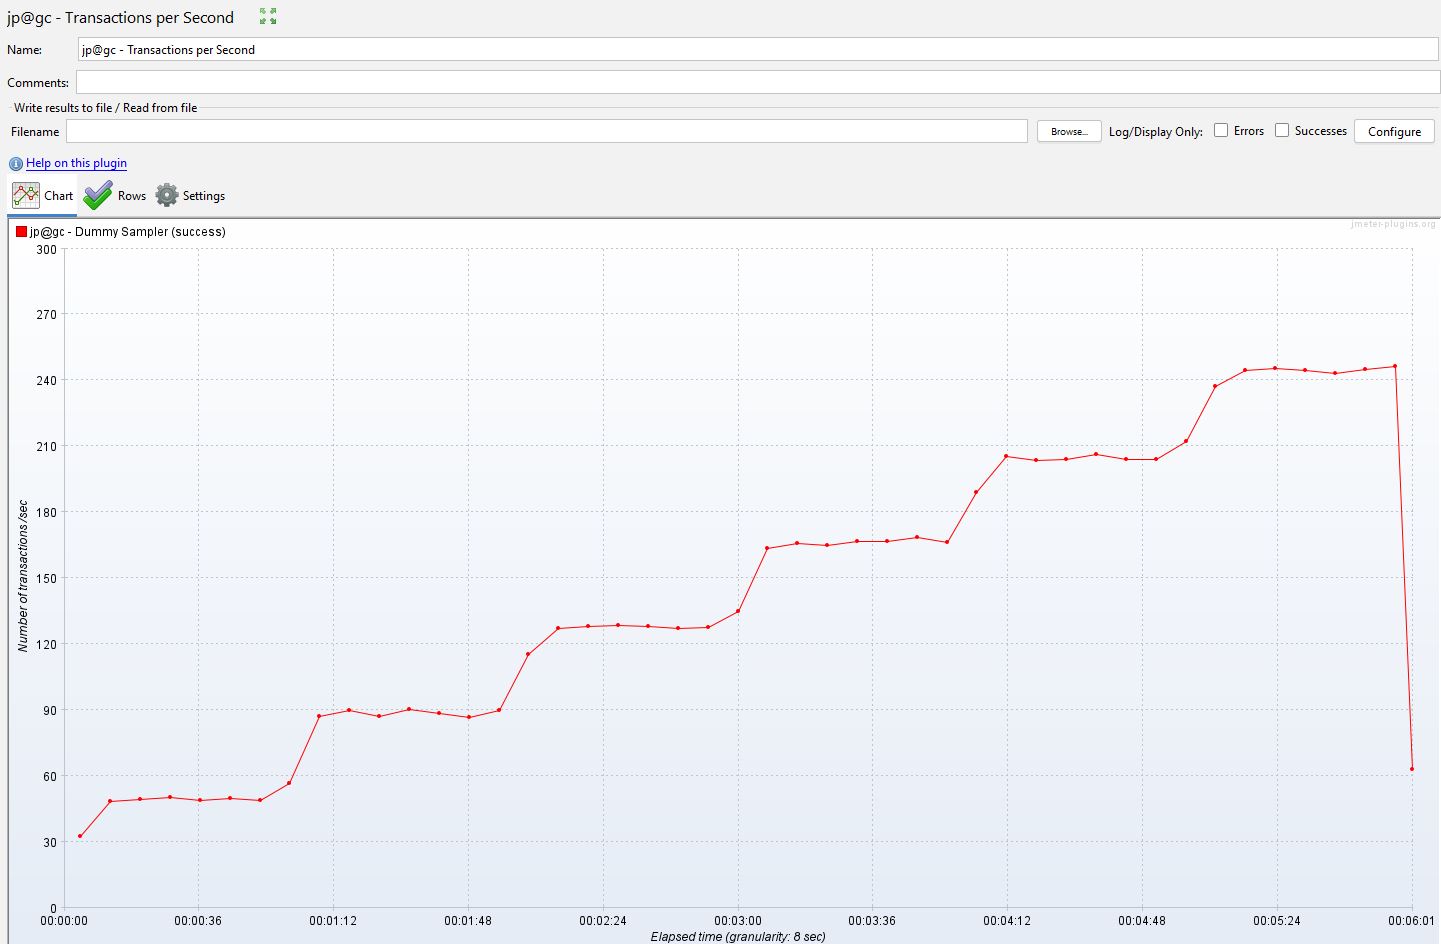
We can see that our profile matches our shaping timer.
There are other ways to alternate load using JSR223 samplers and JMeter Beanshell Server, there is a post on how you can do this here.
Conclusion
Scalability tests are an important part of your performance testing suite and can provide invaluable information on how your application scales and whether you have capacity for any future predicted growth.
Hopefully this post will give you some insight into how you might approach this useful performance testing.
