
Testing Microservices and Distributed Systems with JMeter
This blog post is about testing microservices and distributed systems with JMeter. It will focus on the principles of performance testing applications that are architected this way. We will not look at which JMeter samplers to use in order to generate a load against microservices or how to configure these samplers. This post will consider best practise and consideration in designing your performance testing when faced with these applications. Let’s just remind ourselves what the definition of microservices is, be mindful that there are many definitions that vary, but in principle:
Microservices are smaller, loosely coupled services that you can deploy independently. Here, “services” refer to different functions of an application. In a microservices architecture, an application’s functions are divided into many smaller components serving specific purposes. These components or services are fine-grained and usually have separate technology stacks, data management methods, and databases. They can communicate with other services of the application via REST APIs, message brokers, and streaming. Microservices are a way of structuring an application as a collection of small, independently deployable services that communicate with each other over a network. This is different from the traditional monolithic architecture, where all components of the application are tightly coupled and run as a single unit.
The way microservices are called depends on their implementation, they are commonly scripted in JMeter using a HTTP Sampler or a GraphQL Sampler both of which have OctoPerf blog posts which can be found here and here. If the microservices you are testing are accessed in a different way then you will probably find a post on the protocol on our Blog Post pages, which can be found here. If you are unable to find one, please get in touch and we’ll look at writing one.
An example
We are going to design a very simple distributed system that uses Microservices. We are then going to demonstrate through the remainder of this post how we would approach the performance testing of it.
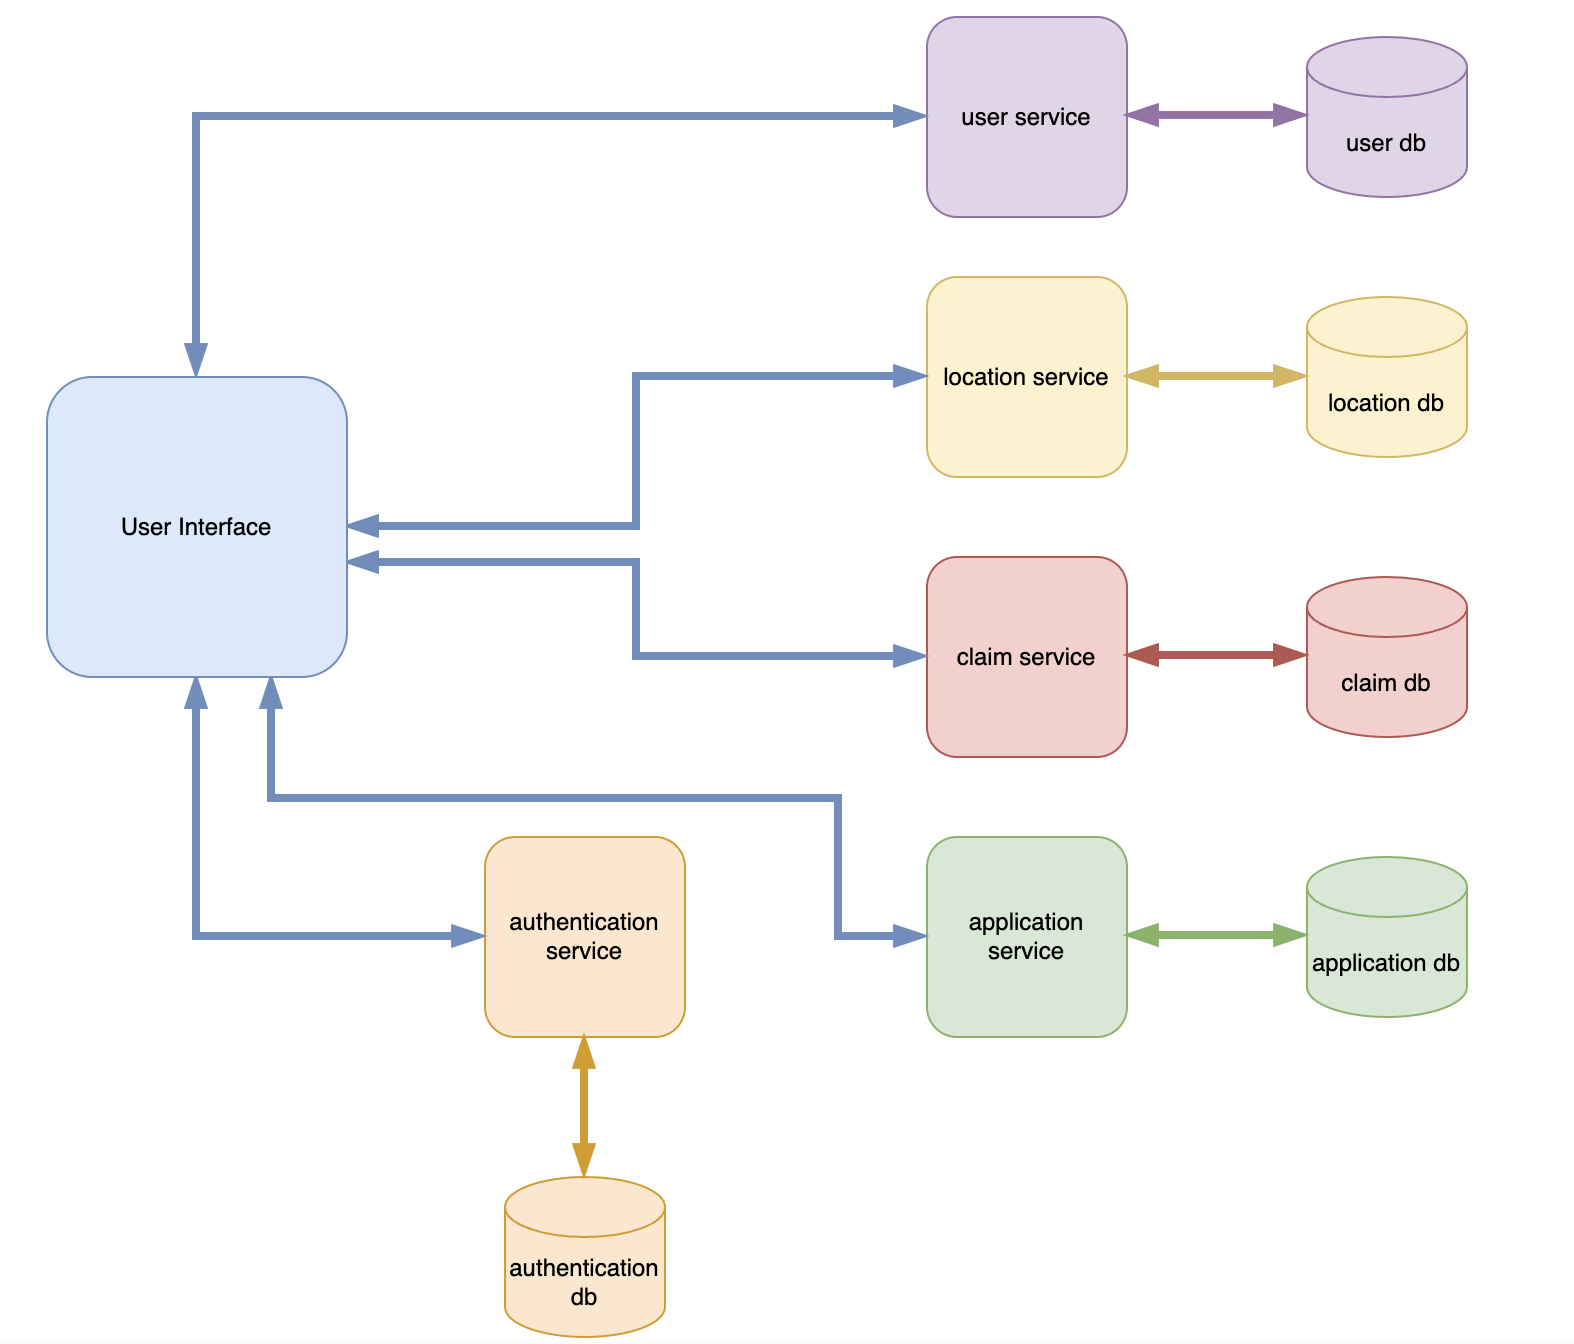
The diagram above represents our dummy application consisting of several microservices. It is very basic, and the reality is that your application will be much more complex and may involve service to service interaction. Regardless of this the principles we are going explore will remain the same and can be used on a distributed system of any complexity.
Simple JMeter Test
To demonstrate some of the principles we are discussing it would be useful to have a JMeter test we can refer to and analyse the results from. Now we do not have a set of microservices that mirror our simple architecture diagram so what we are going to do is use JMeter Dummy Samplers to simulate the requests to these dummy microservices and get a response.
This is the test we have built with a dummy sampler for each endpoint in our dummy architectural diagram:
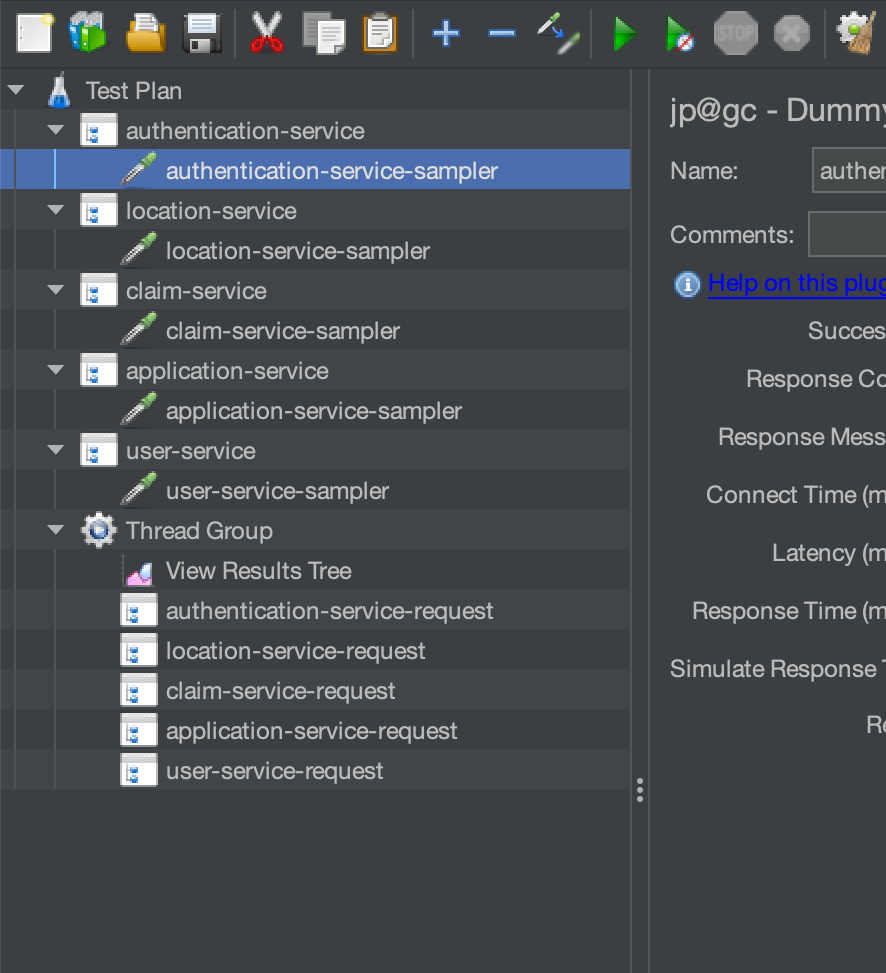
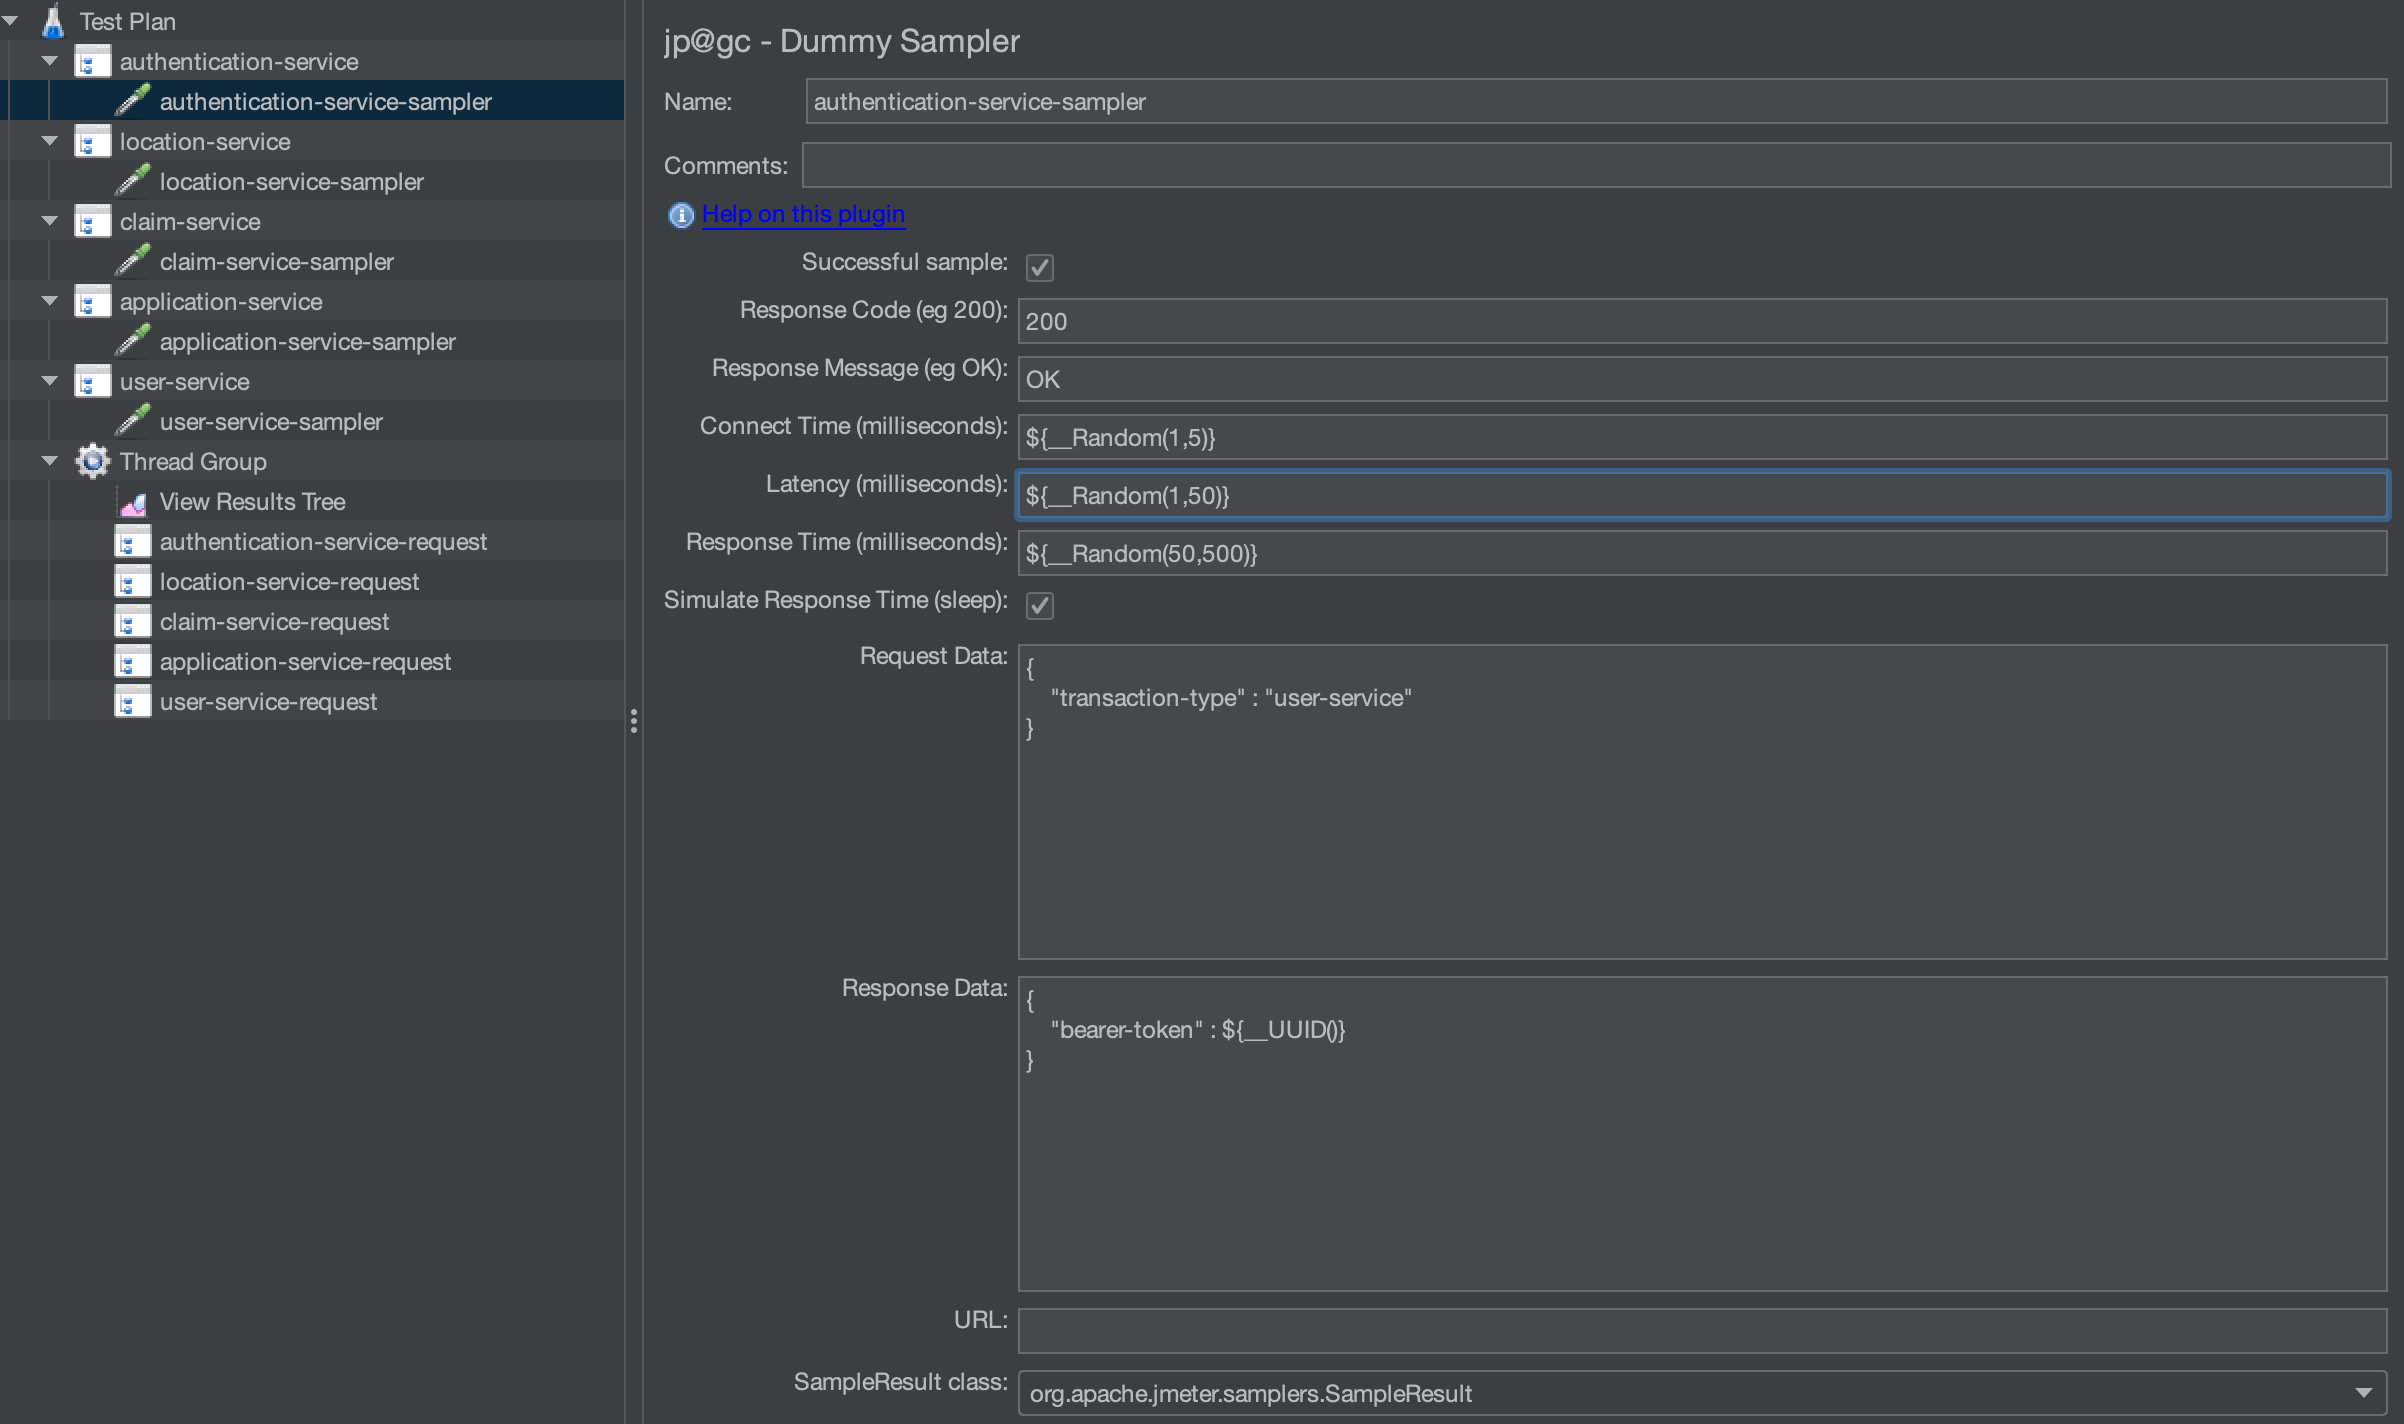
With each sampler having a dummy request and response.
The example below is authentication-service, but they are all similar:
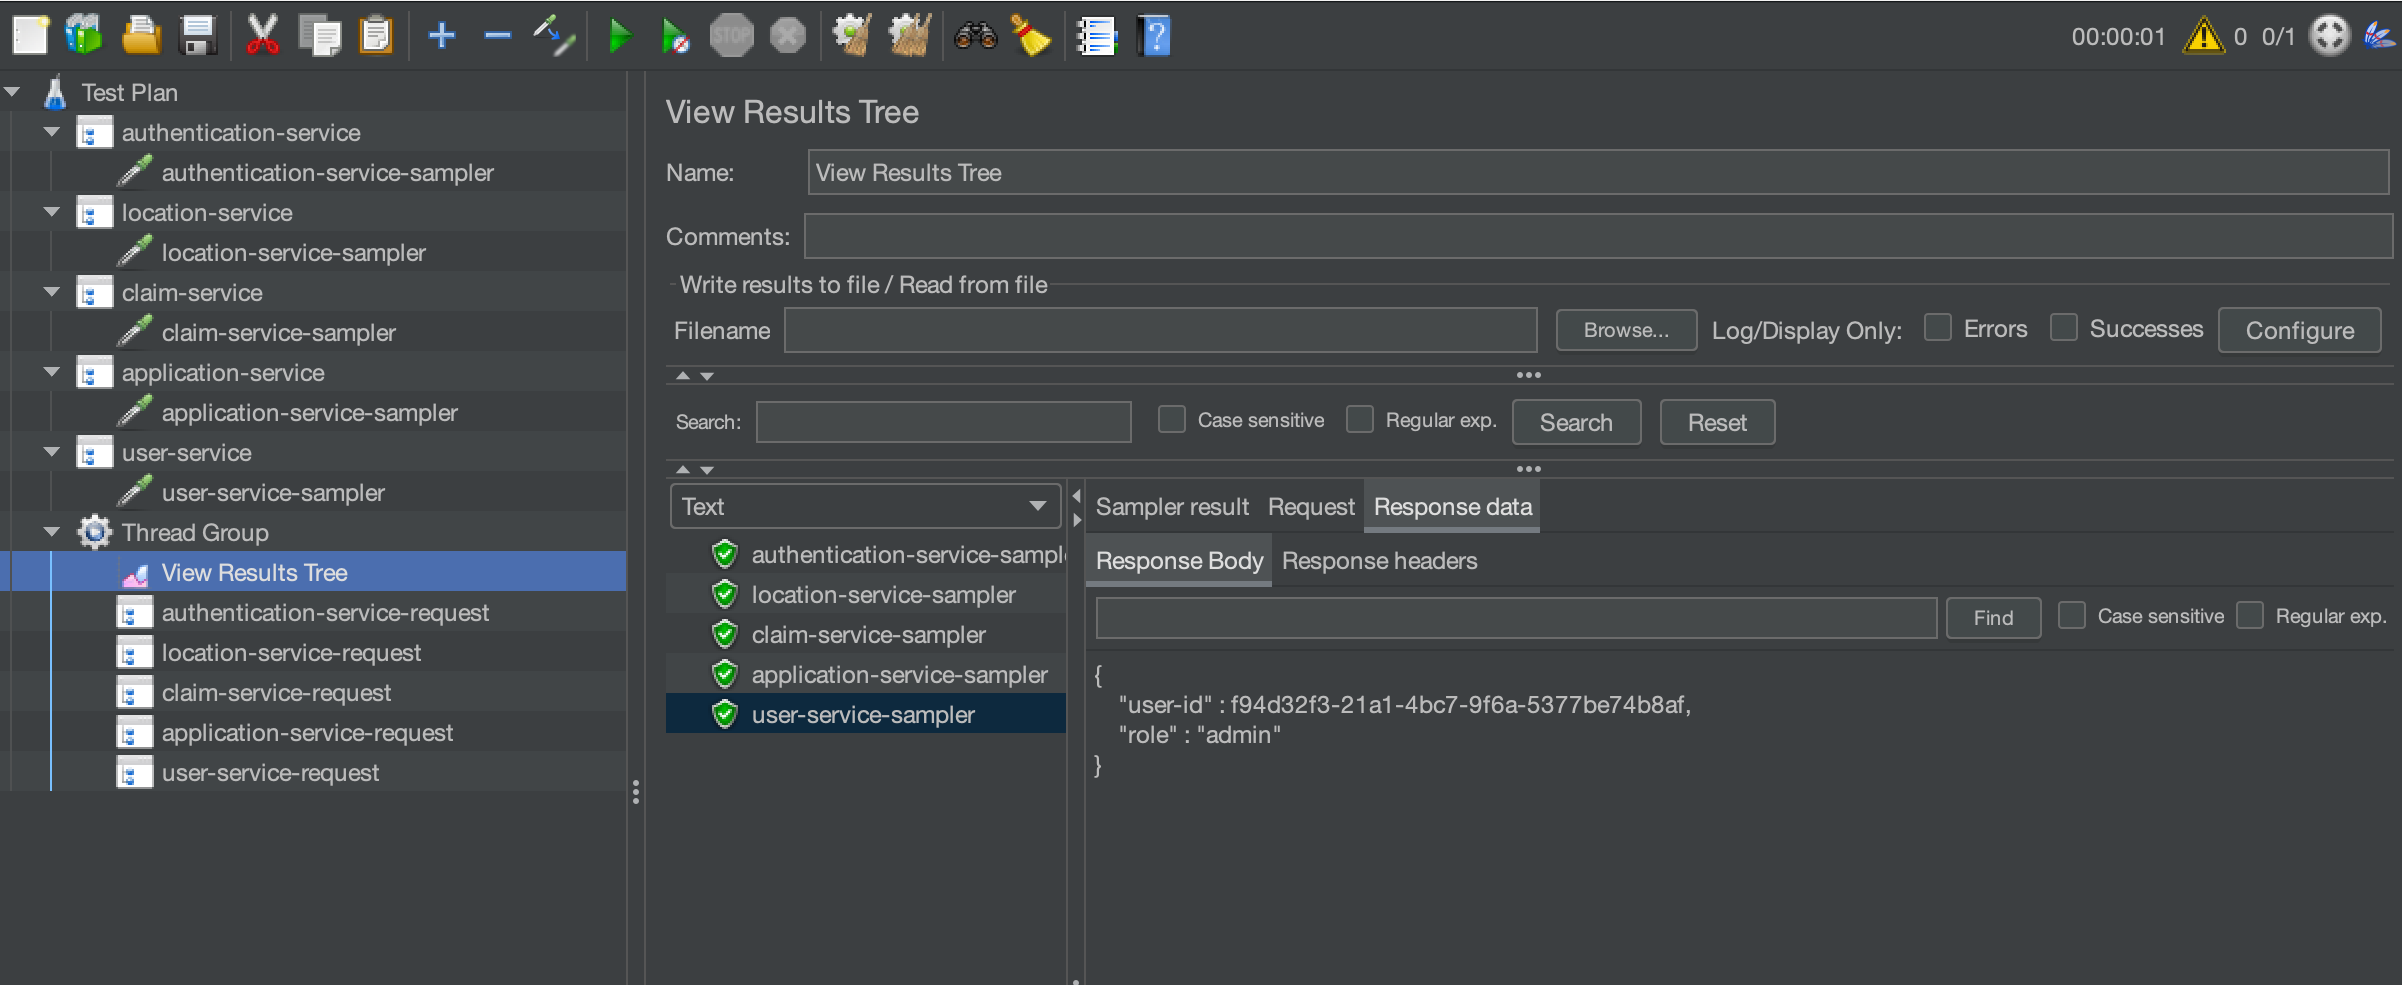
If we add each to a Thread Group and set the execution profile to have 1 user and 1 iteration we can see that all our samplers return a 200 response.
We will use this test later when we start to consider the approach we should use for performance testing microservices.
Define some requirements
You should always define performance testing requirement regardless of the architecture of your application under test. There is a blog post on this subject that you can find here. This post gives a much more detailed view of how performance requirements should be defined and documented to make them testable, for the purposes of this post we will define a small number to help us understand the principles of microservice testing. With microservices you sometimes need to consider the service in isolation rather than as a collective group.
As we have already discussed, microservices are designed to be independent and can be interacted with by a client or other services if you have permissions to do so. Let’s consider how we would define some requirements for our simple architecture, the process of defining requirements should follow the guidelines in the post detailed above as the list below is purely for the purpose of this simple example.
- Authentication service must be able to handle 10 requests a second.
- User service must be able to handle 12 requests a second.
- Location service must be able to handle 14 requests a second.
- Claim service must be able to handle 16 requests a second.
- Application service must be able to handle 18 requests a second.
- All services must respond in 1000 milliseconds at the 95th percentile.
Performance Testing
We have, up until this point, just been outlining what our simple microservice architecture might look like and defined a set of requirements and built a simple test. This section is really the point of the post, a look at how you would proceed with testing microservices and how you should approach this.
Test each service independently
The first thing you should think about when testing microservices is to test each one in isolation. And you test each one for several different scenarios, some examples of this being:
- Peak volumes test
- Scalability test
- Soak test
There is a guide from OctoPerf on the tests you should consider for your testing scenarios that can be found here. You should really ensure that each of your services performs in isolation before starting to build more complex scenarios. If we consider this in the context of our simple test we created, we will set the test up to test each service based on our requirements. So, our first test will be to performance test the authentication service at a rate of 10 requests a second. To accomplish this, our JMeter test would look like this:
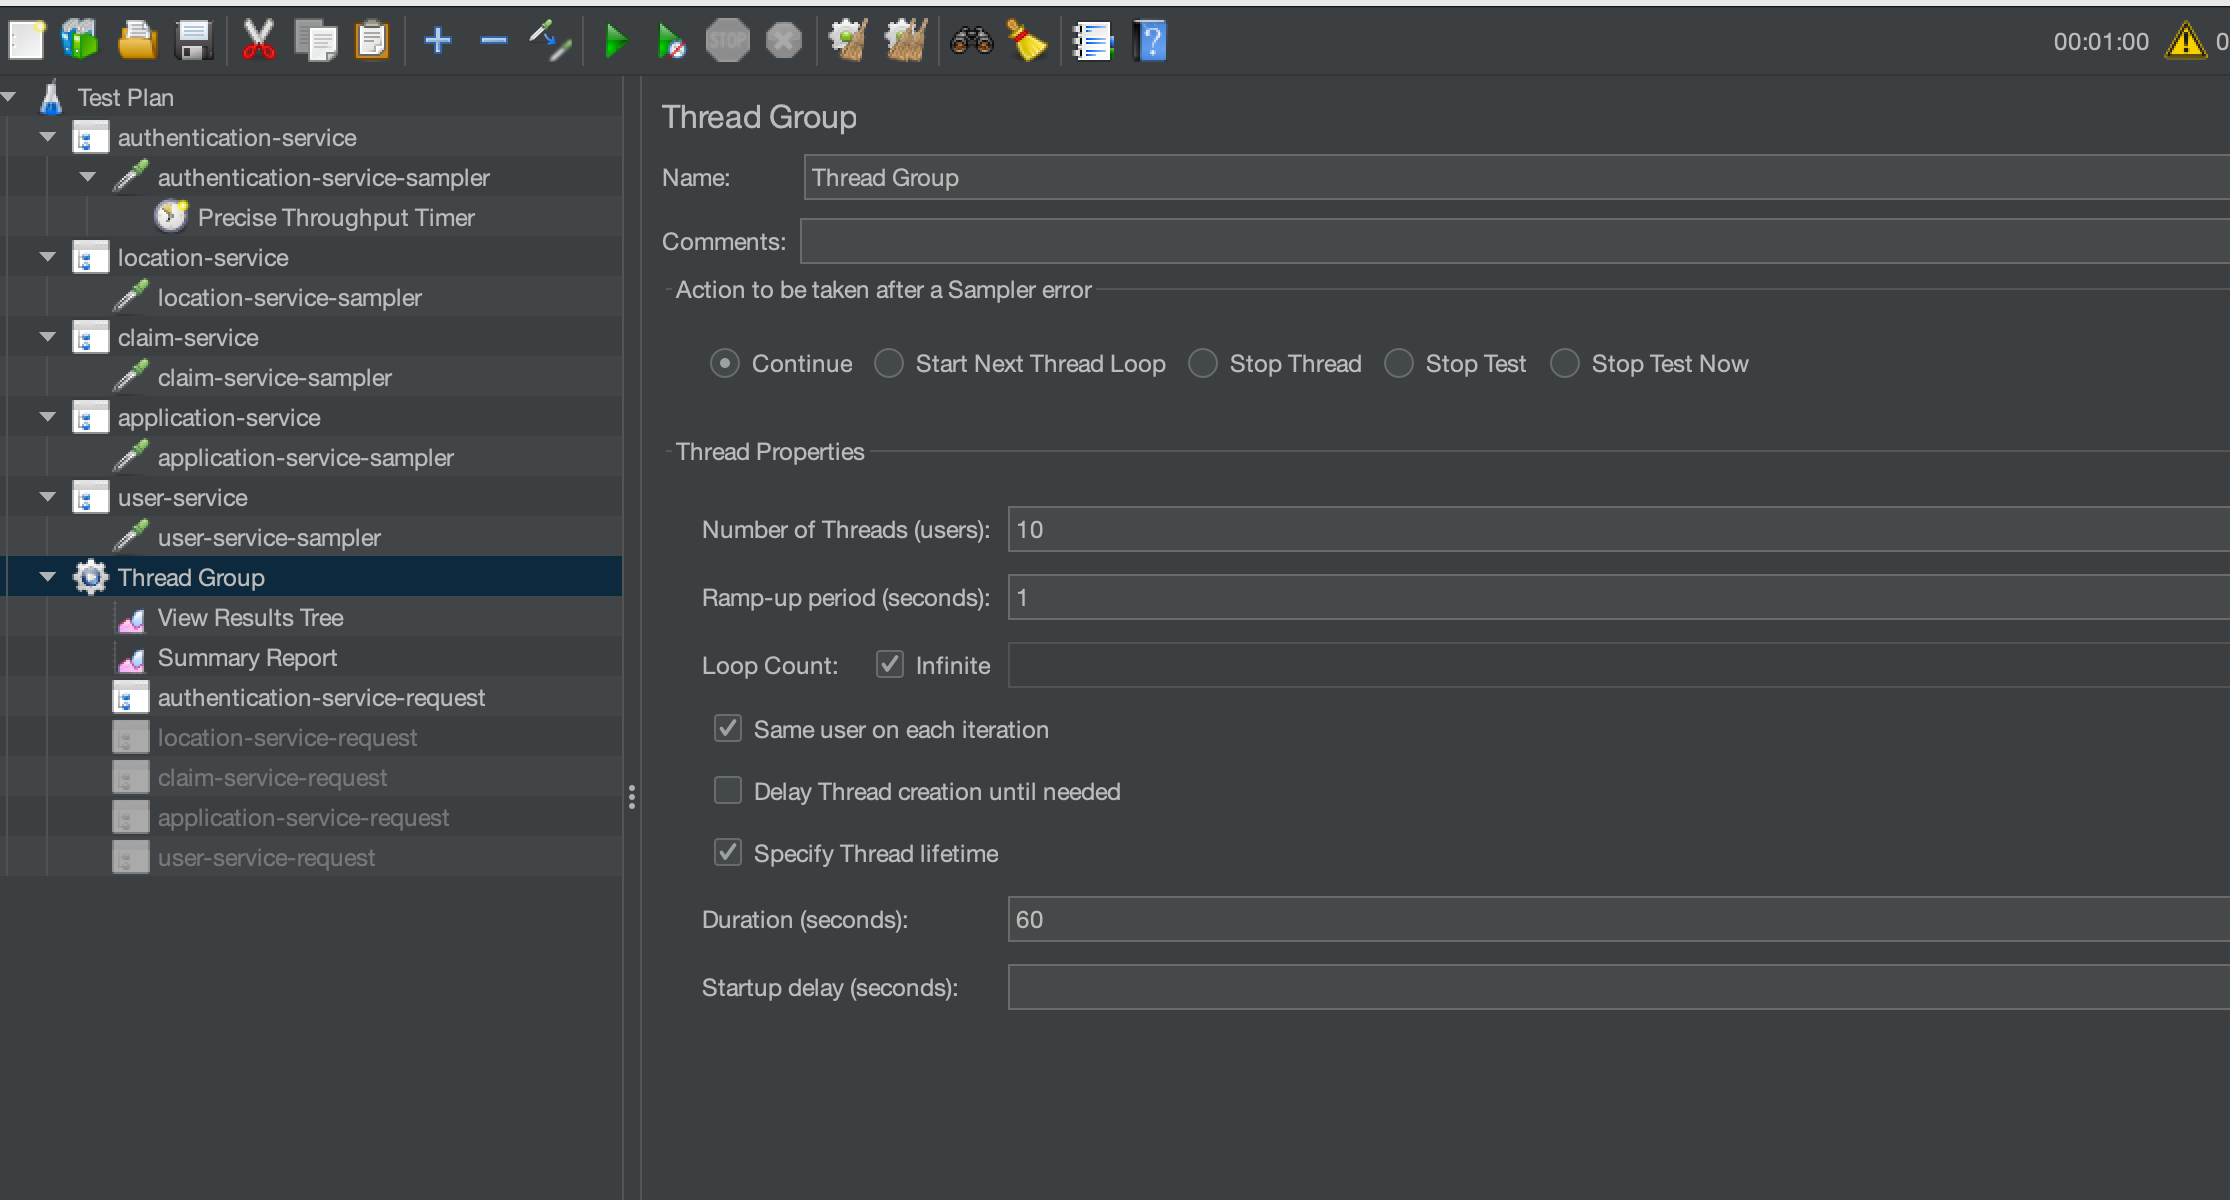
Where we have set up our thread group with 10 threads as we know this will be enough to support 10 transactions a second. We know this will be enough as the dummy sampler responds withing 1 second always so 10 threads is enough to support 10 requests a second.

You will need to manage your thread count depending on number of transactions you are trying to accomplish, and the response times you are seeing from you microservices. We will us a Precise Throughput Timer to manage the load profile.
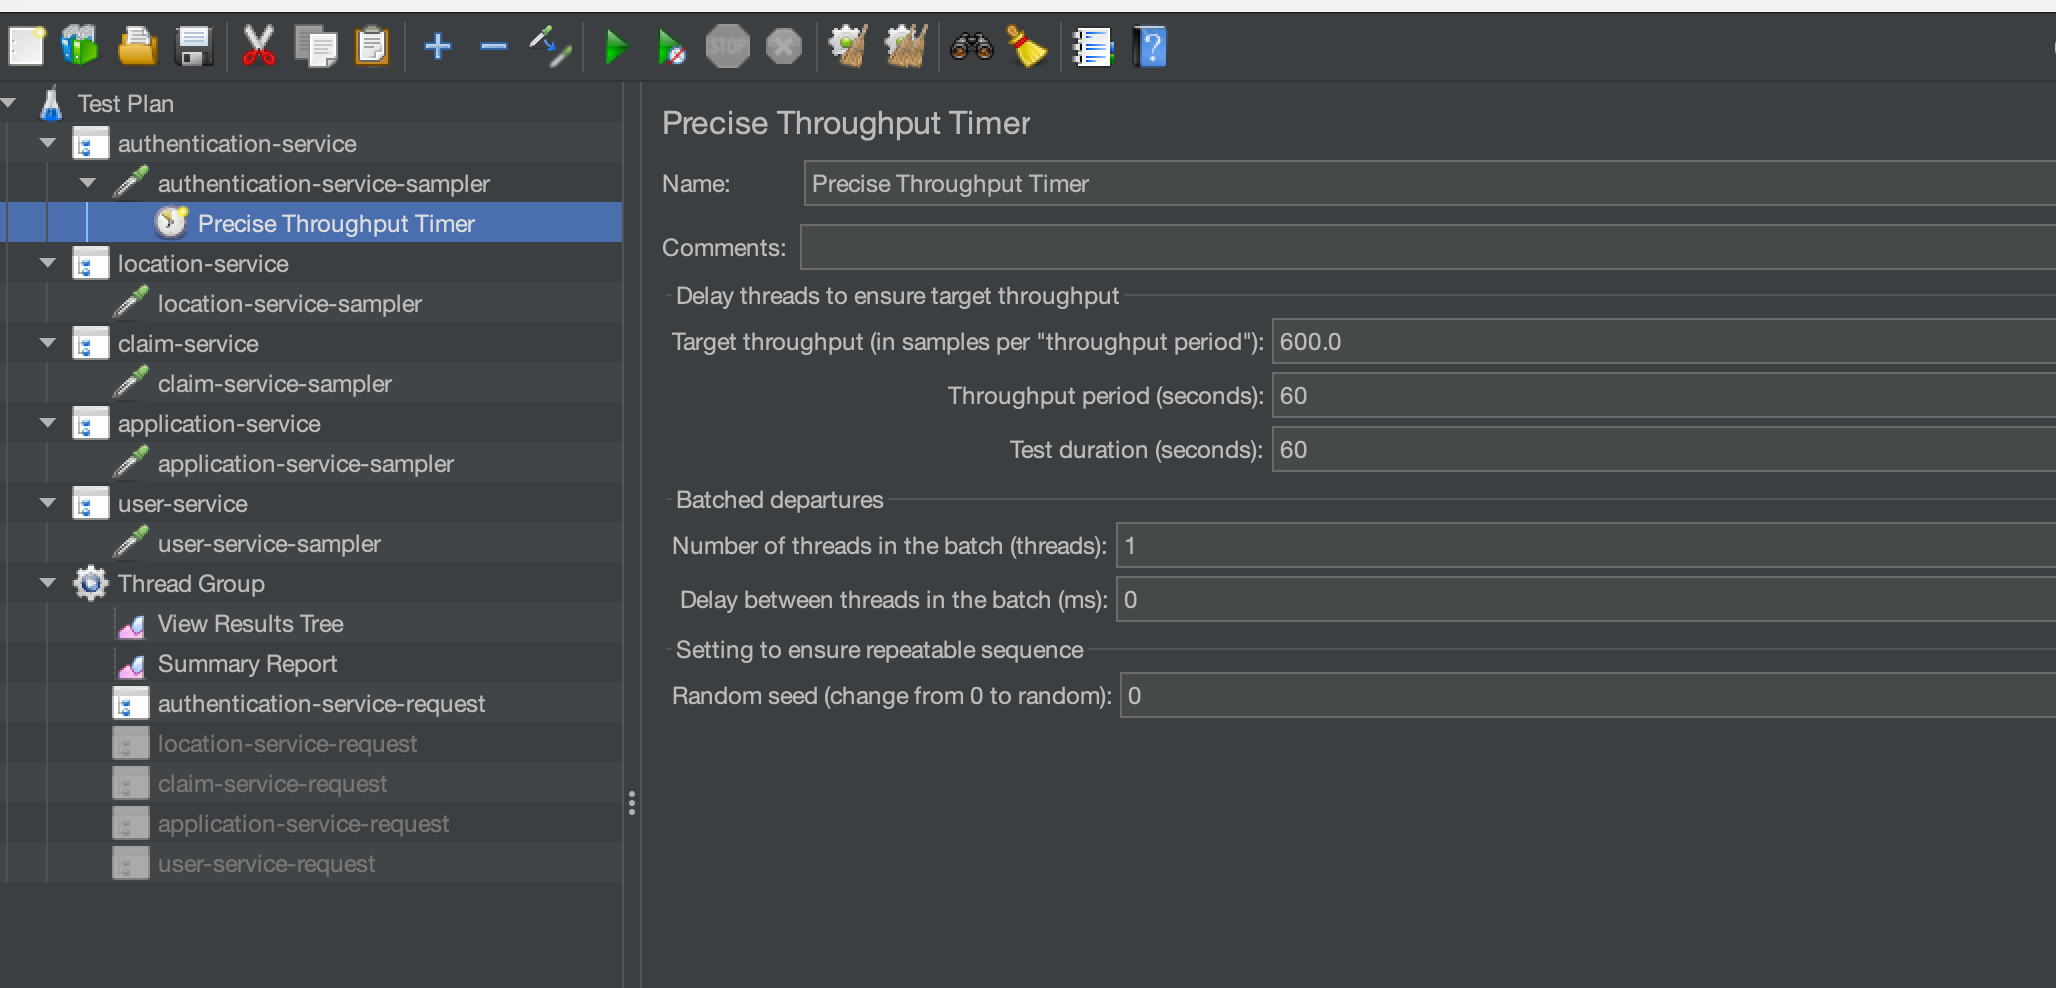
We have set this to execute 600 transactions in 60 seconds which is equivalent to 10 a second. We will add a Simple Data Writer to our test to output the results to a file.
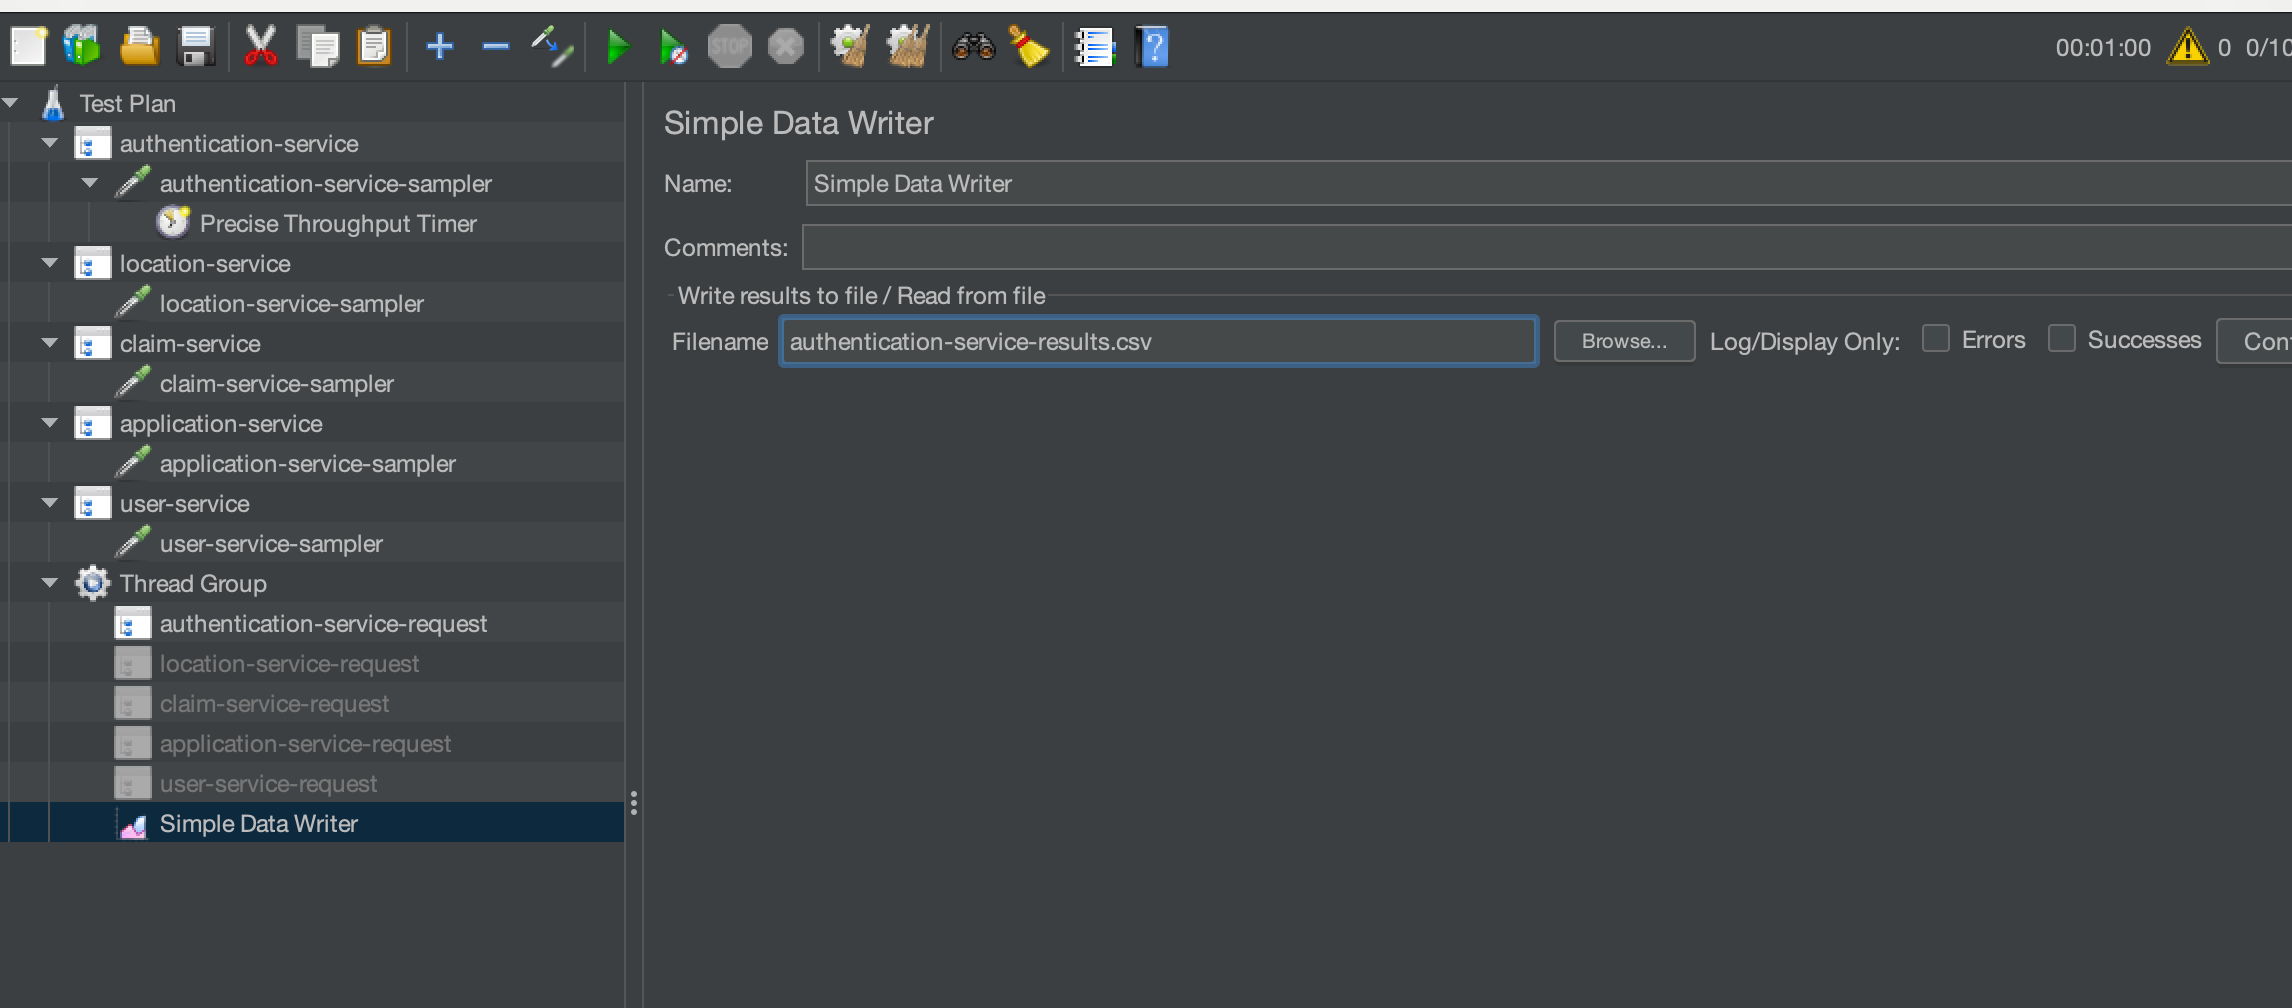
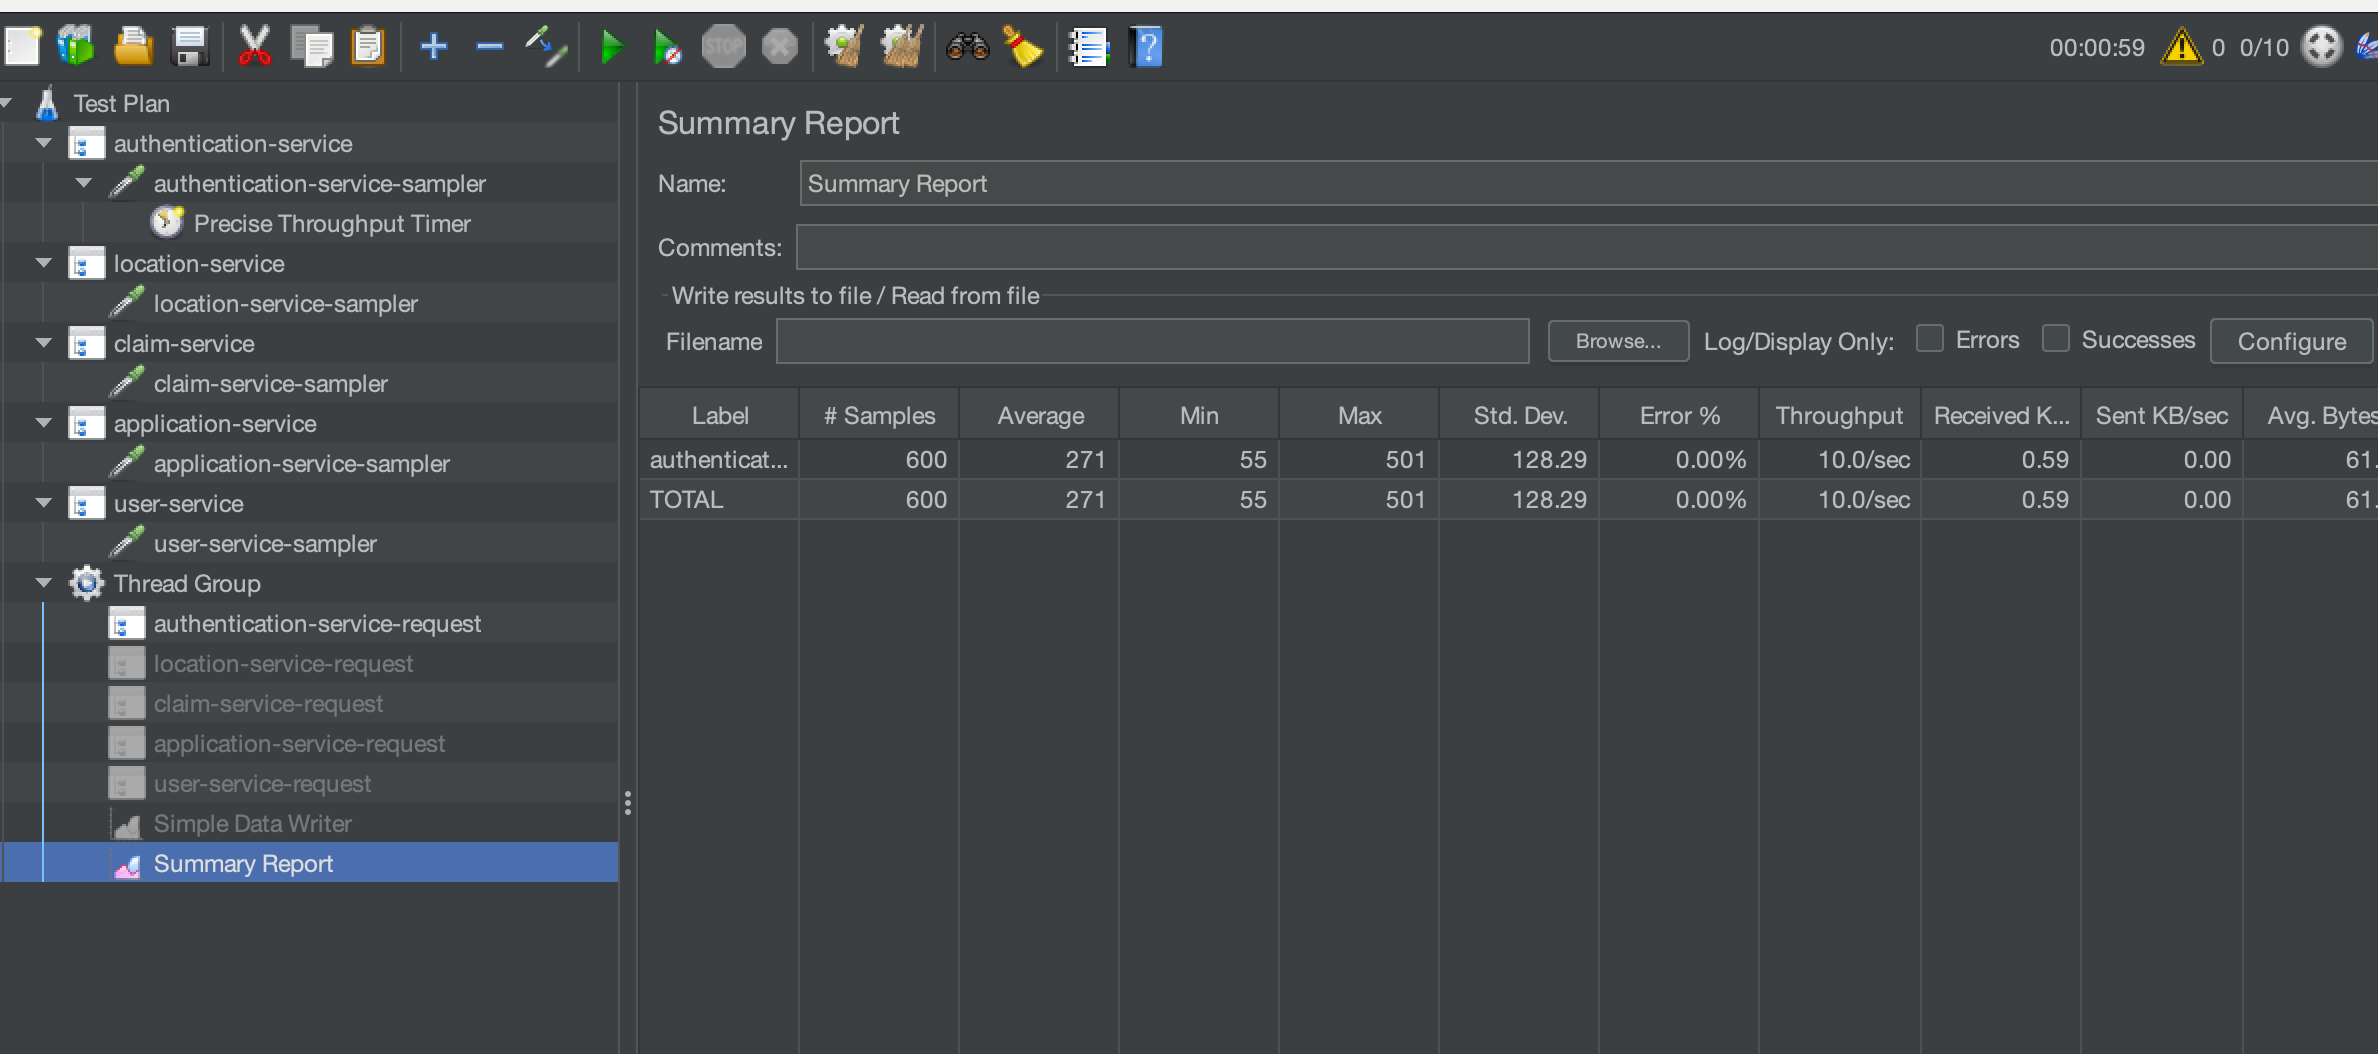
If we run our test, we will then generate an output file which we can then use to analyse response times for this single service. For the purposes of this example, we will add a Summary Report so we can ensure our load is accurate. You would not want to include this in your performance tests because of the overhead on resources.
We have generated a graph from our results to show the response times. This is obviously a dummy test so there is no expectation that the response times would exceed our response time requirement of 1000ms.
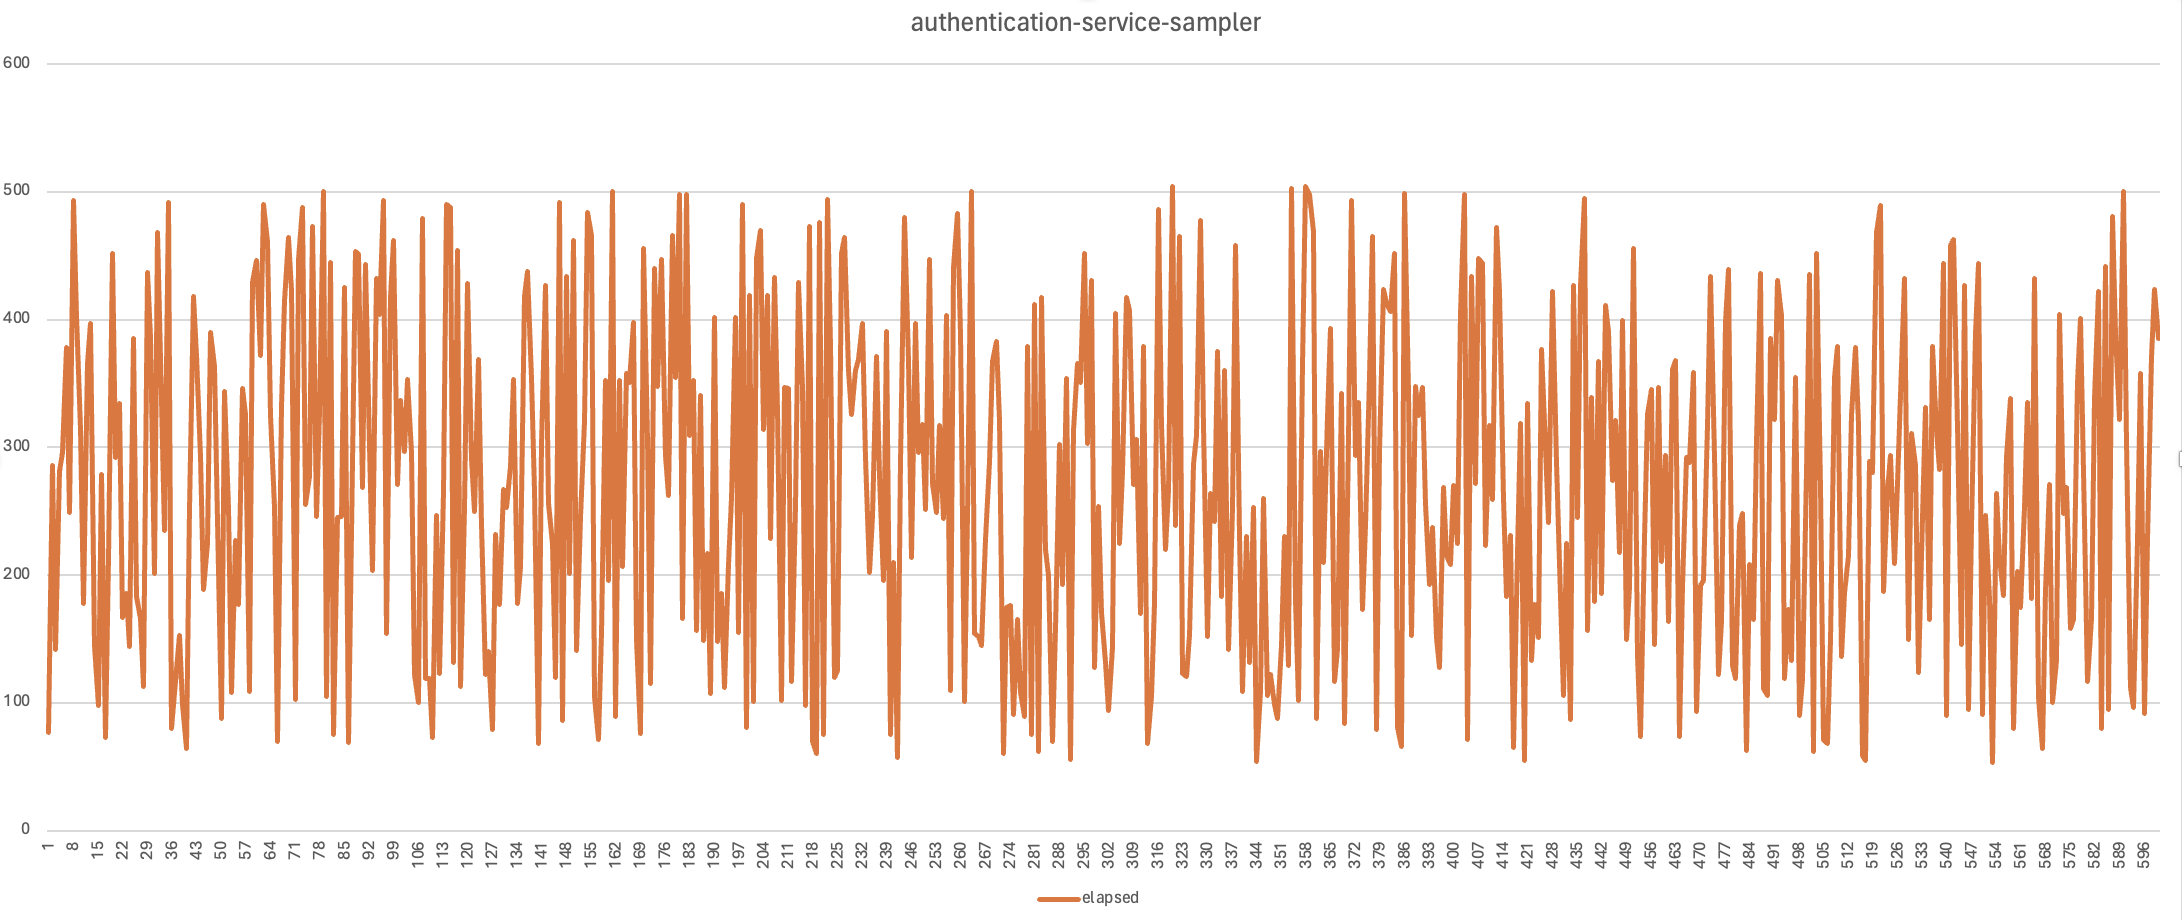
There are clearly many other ways of showing this data and how you want to present this will be up to you and the way your organisation wants to see the results. We would now run all our other scenario types we discussed above against the single microservice. What you now have is a set of performance test results for the authentication service which are measurable against your requirements. You can then work with your development teams to resolve any performance issues you may be facing or look to make improvements based on any analysis you complete against your services under load. You can now repeat this exercise for each of the microservices that make up your application under test. For the purposes of this blog post we will not repeat this for our dummy services. To get this level of understanding of how your microservices perform in isolation is very useful and give you a good baseline set of performance results for the next tests we will discuss.
Test services in parallel
While microservices are designed to be independent they will share a network and may share other aspects of your production estate for example:
- reporting server
- document server
They may even all have an interface with your legacy systems.
This being the case then you will also need to performance test your microservices in parallel. You should repeat all the tests you executed in the isolation test above for the services in parallel.
In our requirements we have defined the number of transactions we need to achieve for each microservice, these volumes are your peak volumes. Is unlikely that all your microservices will be running at peak volumes at the same time, as you will find that the peaks for each will occur at different times of the day or week. It is, however, a good idea to run them all microservices at peak volumes in parallel to really stress any components that they all share or use. What you can do is build a test to do this and then measure the response times of your microservices in parallel against the results produced in the isolation test. This will give you an understanding of whether any shared components are affecting the performance of your microservices. And will help you understand the impact of these microservices on other parts of your infrastructure. Let’s update our dummy test and run all samplers in parallel. We can then discuss how we would compare the results. We will keep the duration of our test the same as the baseline and add Precise Throughput Timers to each sampler. To run our samplers concurrently we will change the test so that each sampler is in their own Thread Group:
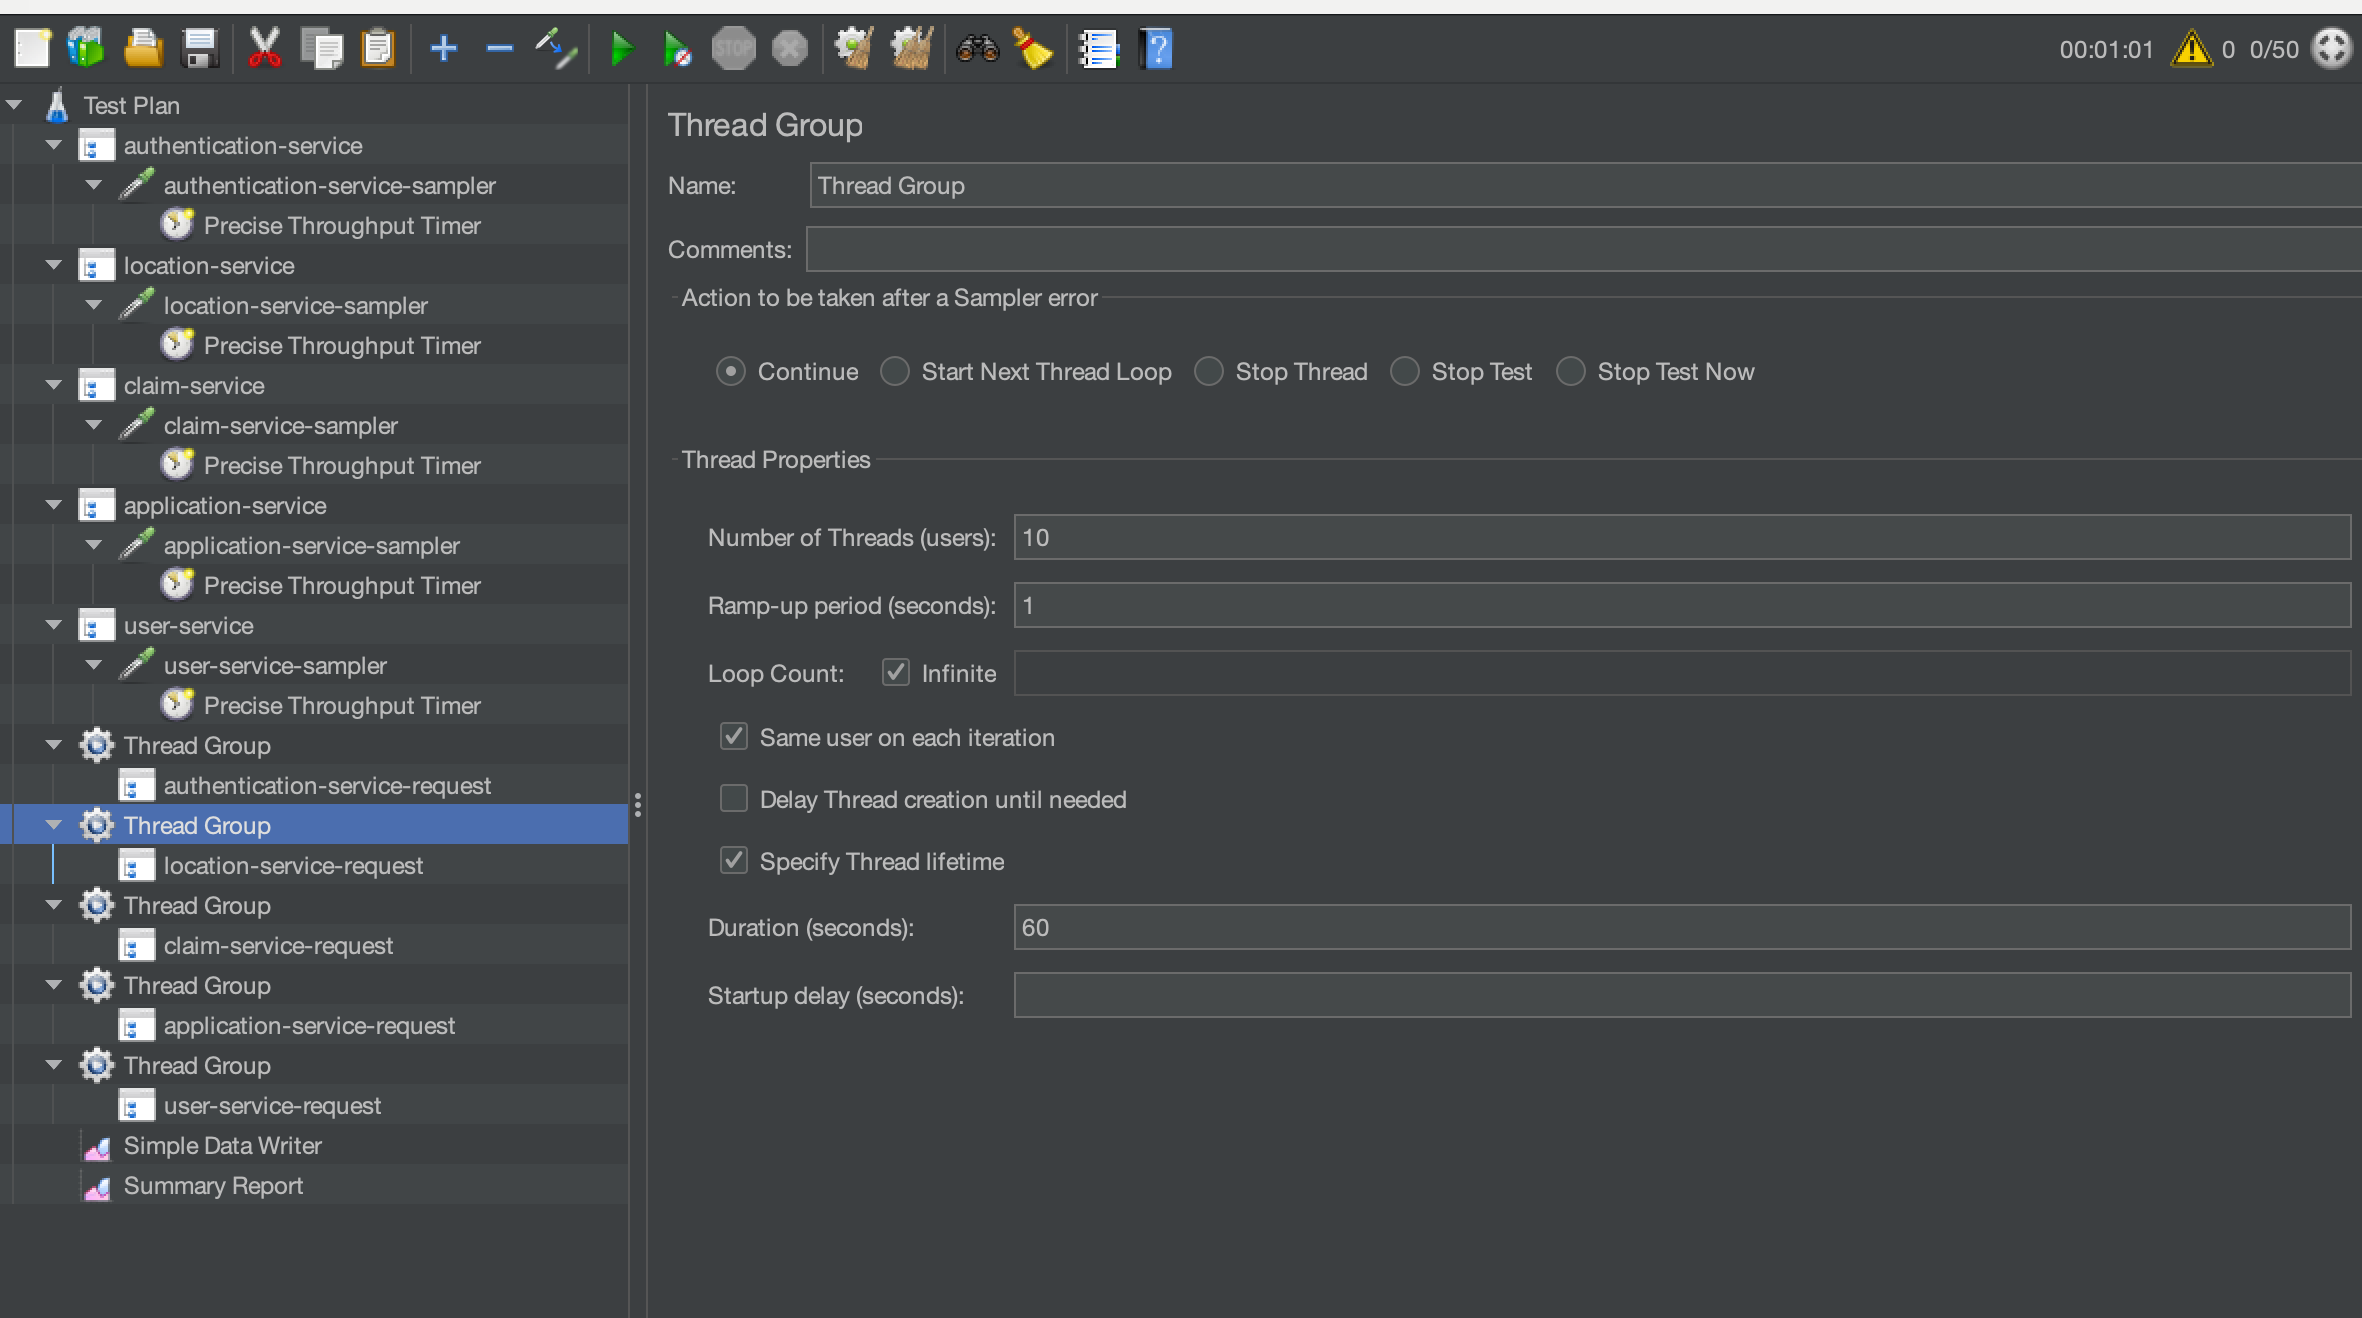
Each Thread group is identical for the purposes of this test with the exception of the authentication service Thread Group that will require more threads now we have increased the dummy response time:
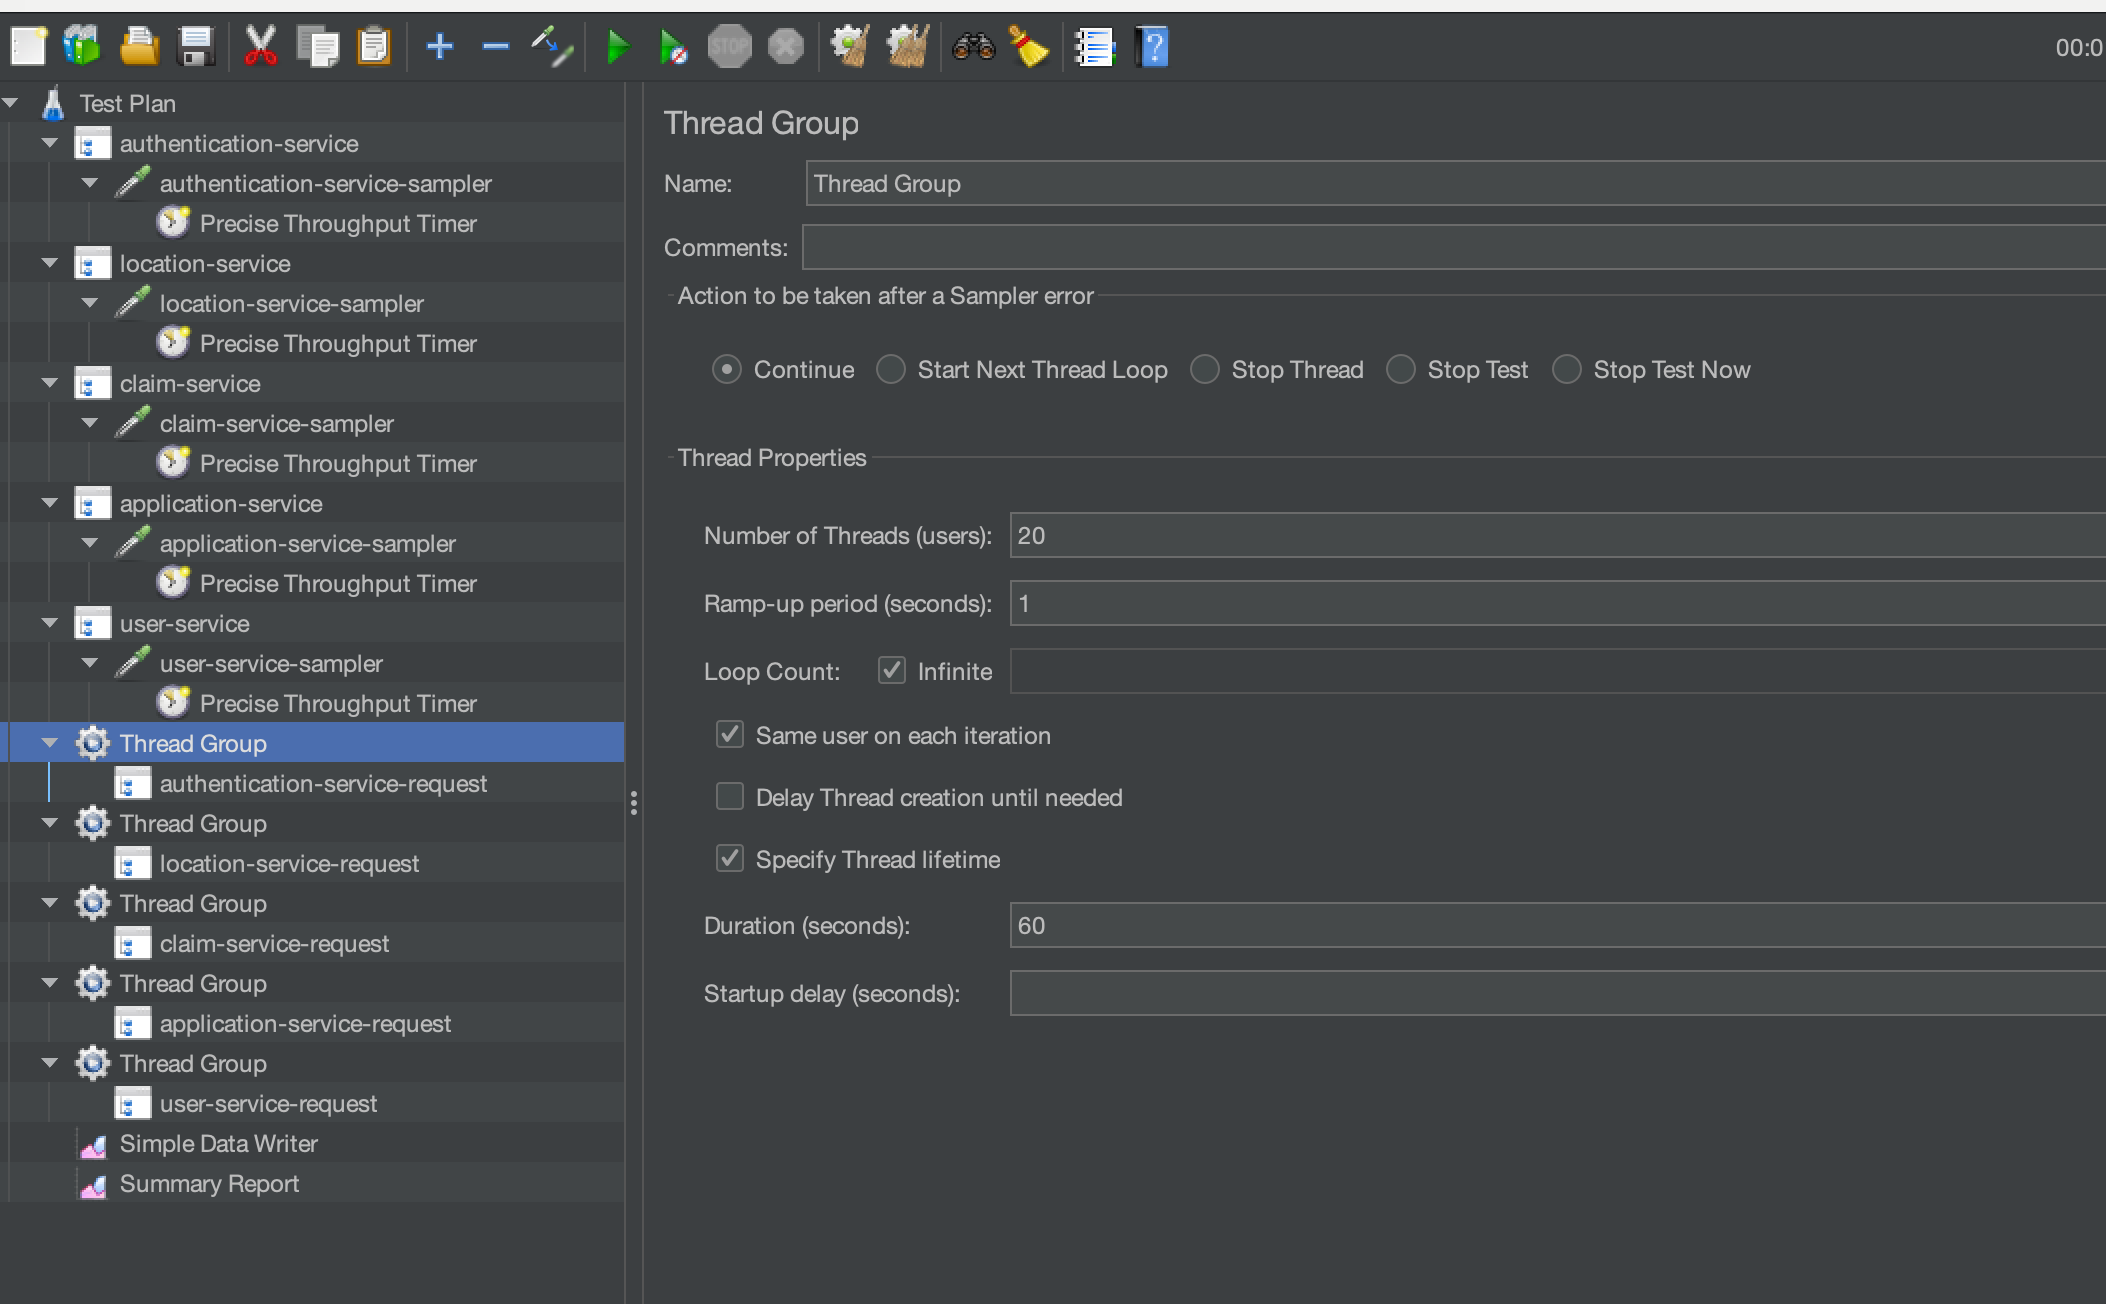
We will now be generating a load of:
- 600 authentication requests (10 requests a second x 60 seconds)
- 840 location requests (14 requests a second x 60 seconds)
- 960 claim requests (16 requests a second x 60 seconds)
- 1080 application requests (18 requests a second x 60 seconds)
- 720 user requests (12 requests a second x 60 seconds)
To show how response times may vary we will increase the response times defined in the dummy sampler for the authentication service only.

This sampler is the only one we have a baseline for so we will use this as our comparison. We will run our test with all samplers running concurrently and for the purposes of this post we will keep our Summary Report.
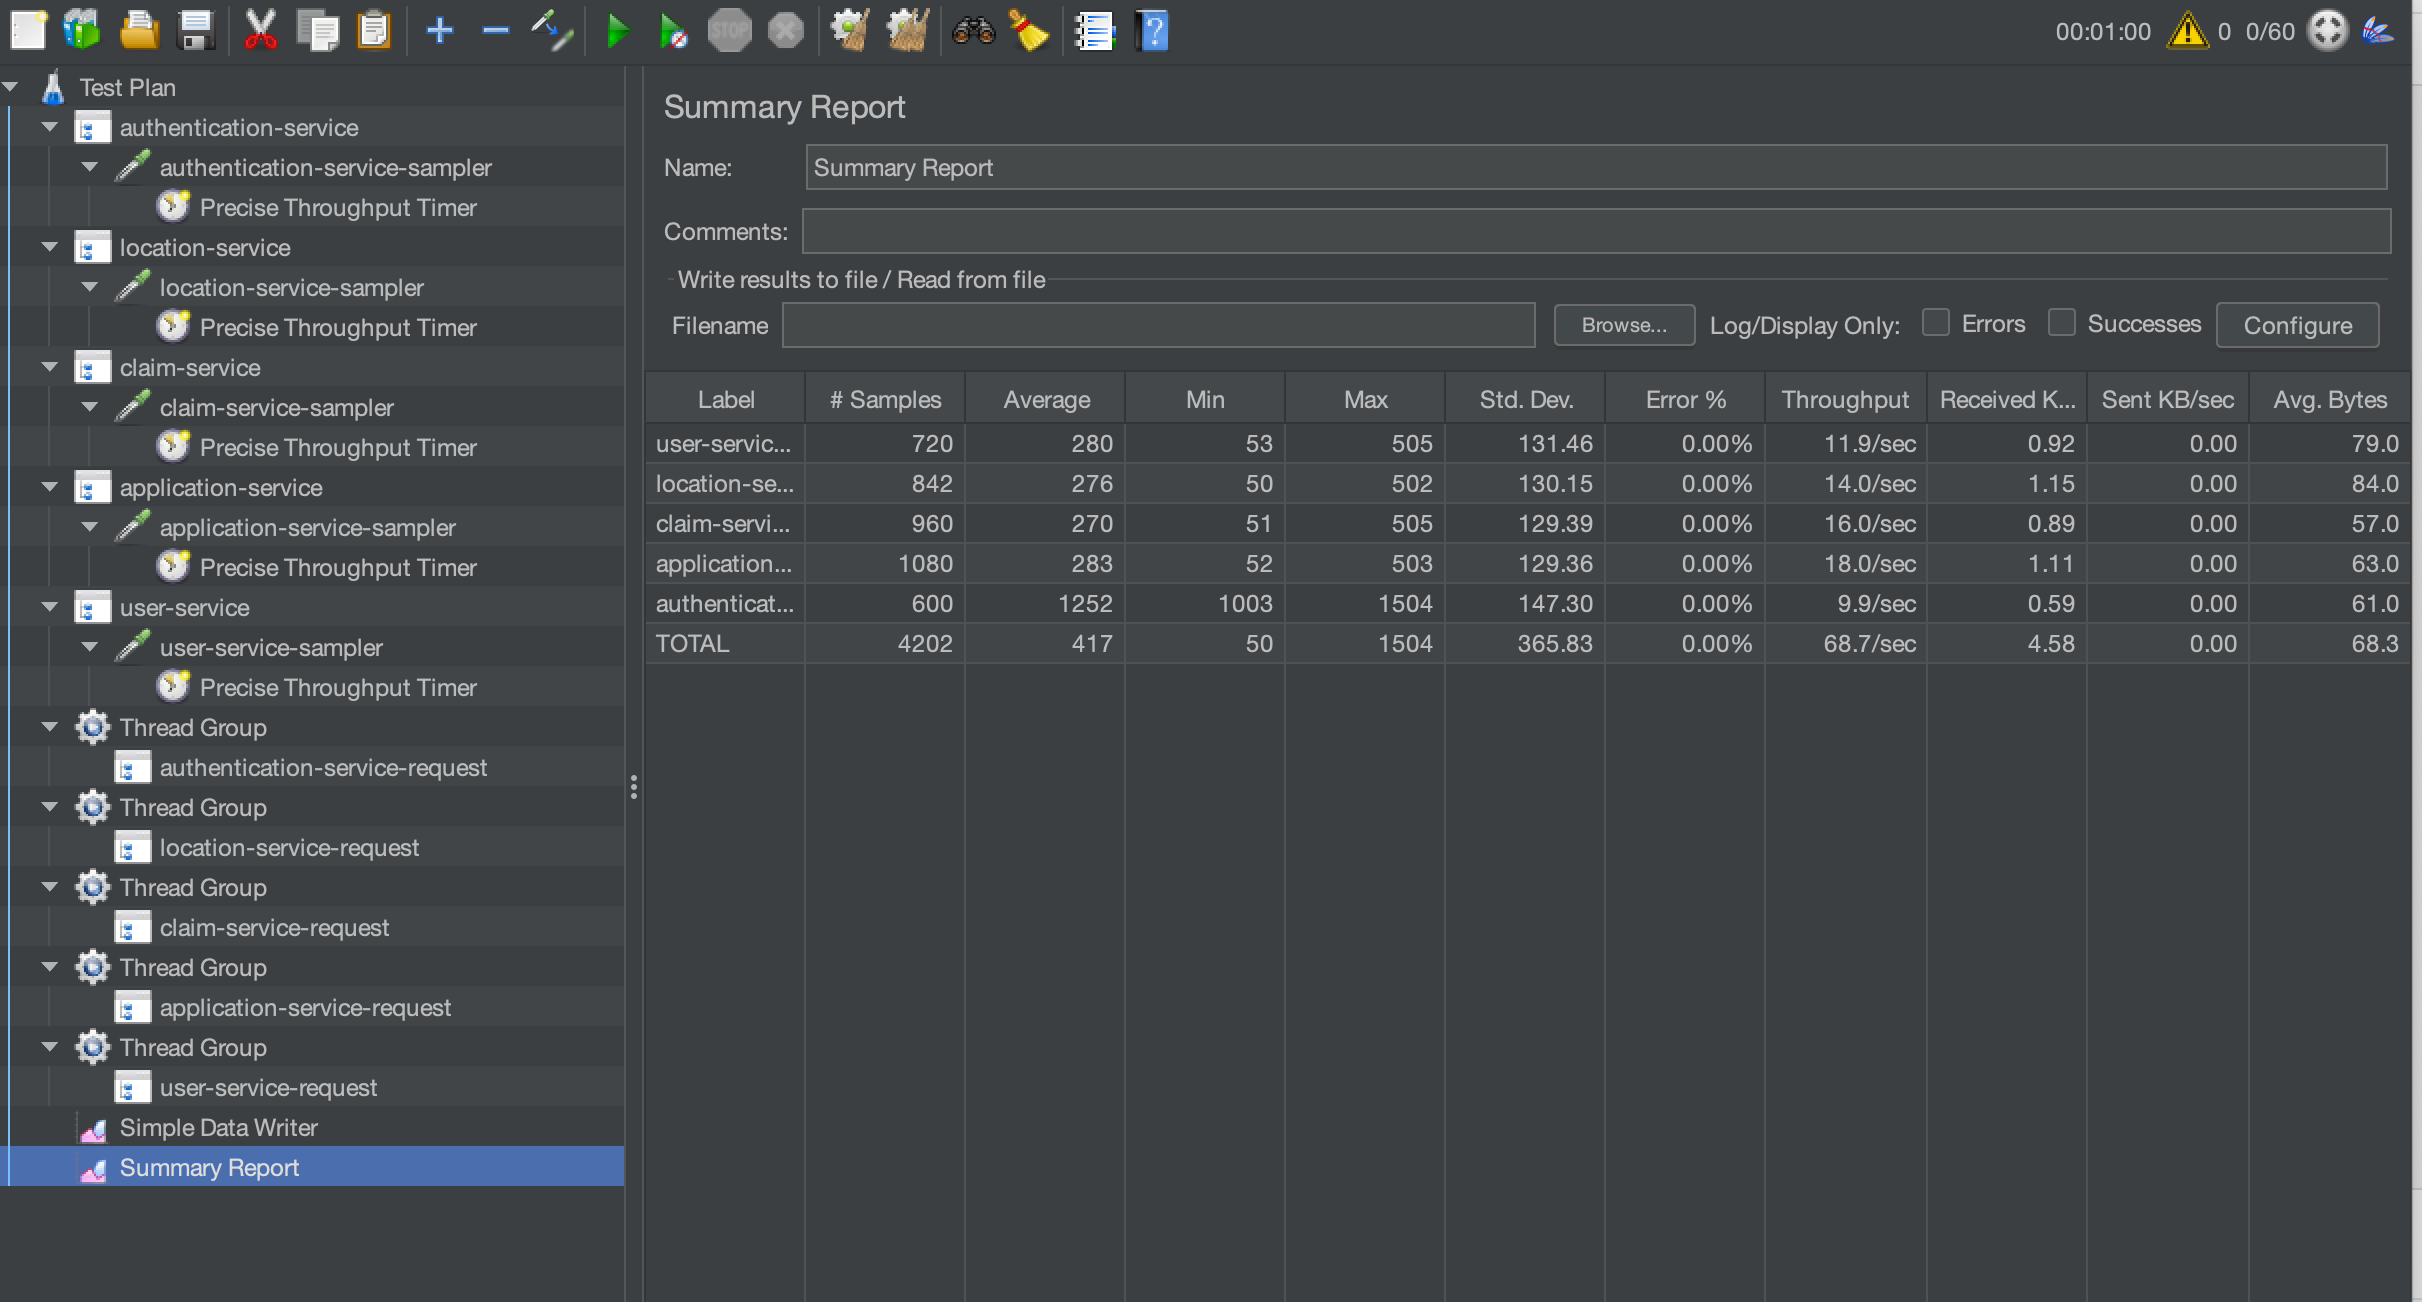
We can see that we have achieved our throughput requirement. If we pick out the authentication service from our results and graph it alongside our baseline.
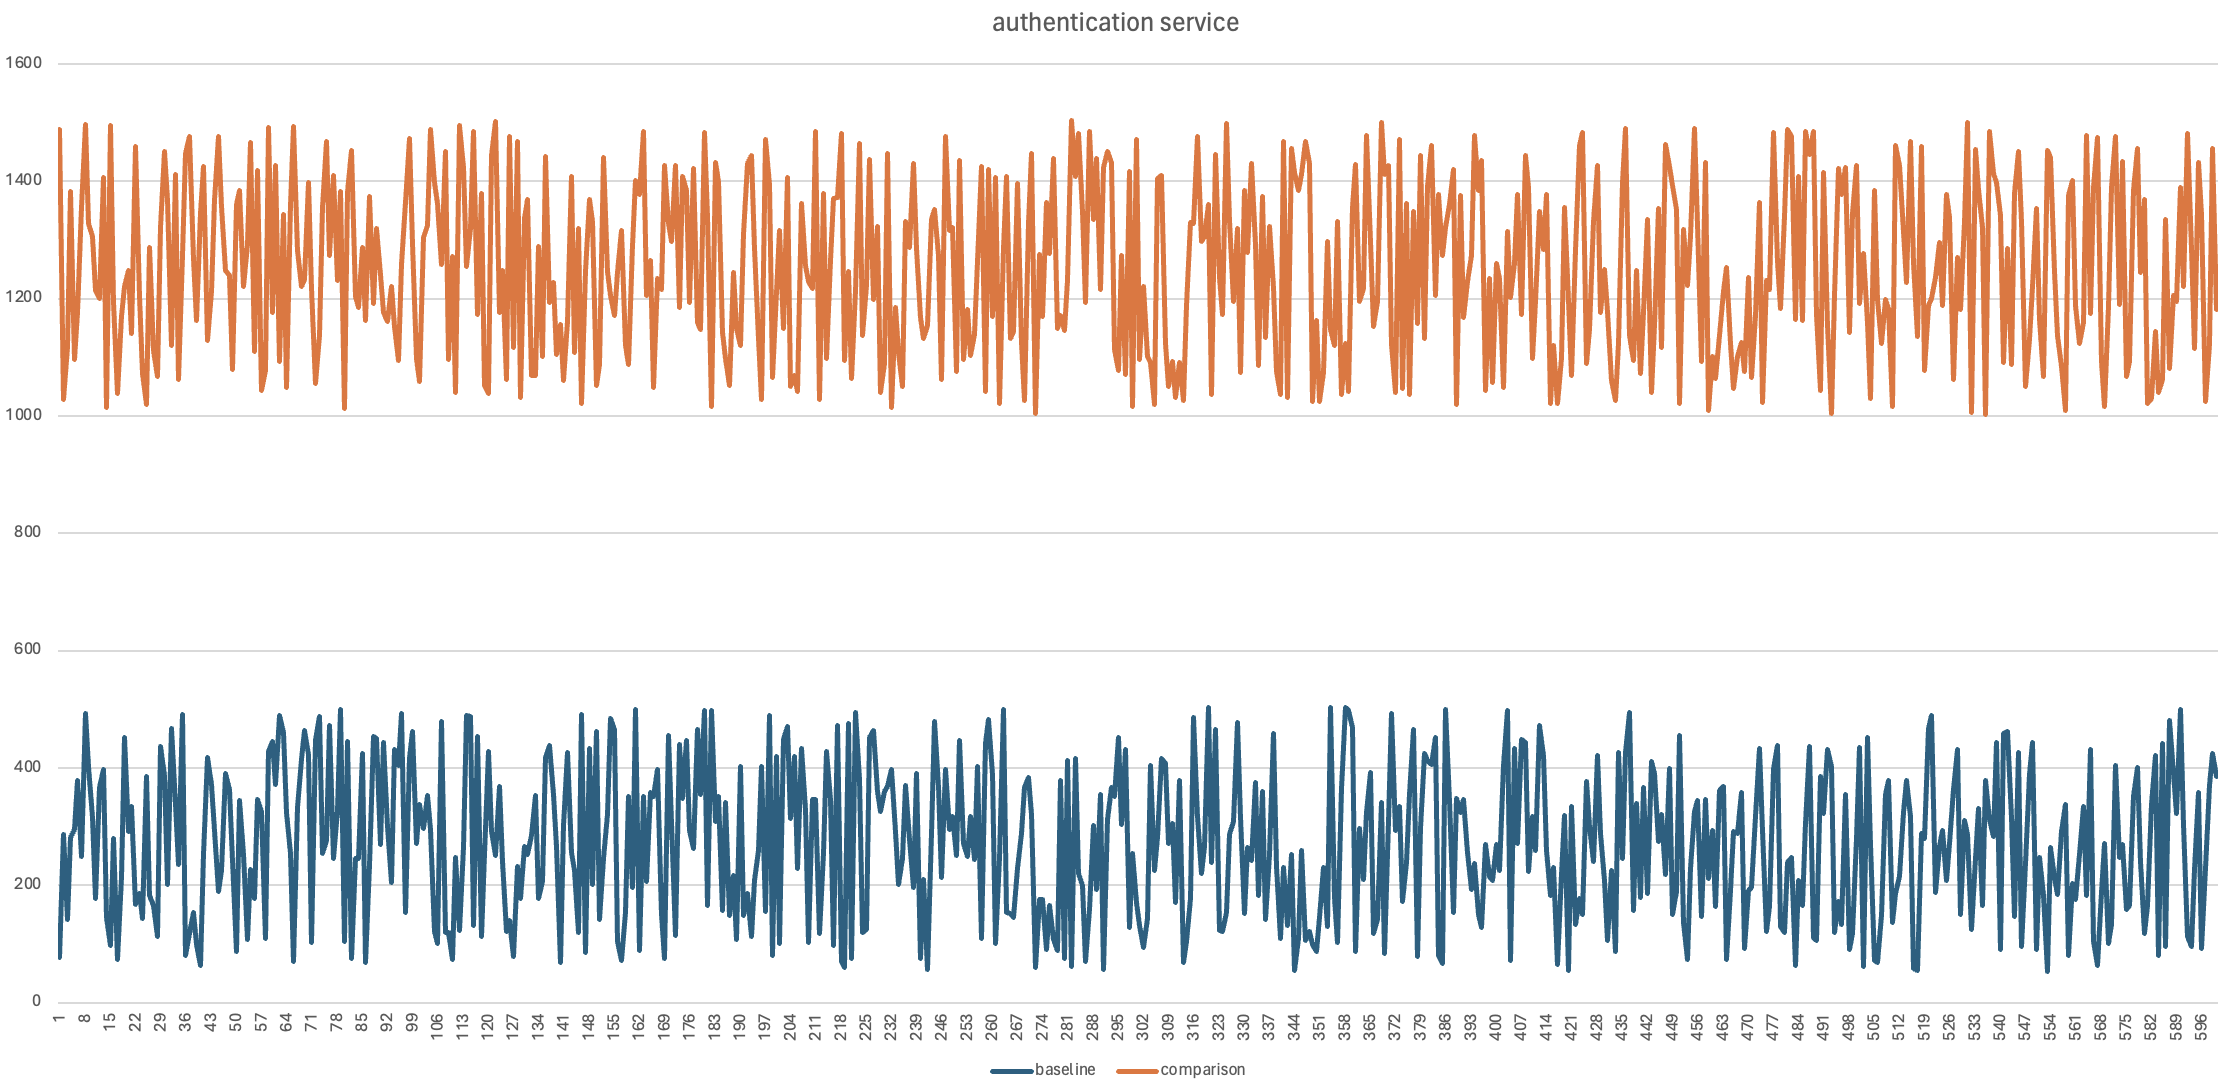
Now this is very much artificially manipulated to give us this outcome but it’s just an example of how you might contrast results from different tests and demonstrate regression.
Test services sequentially
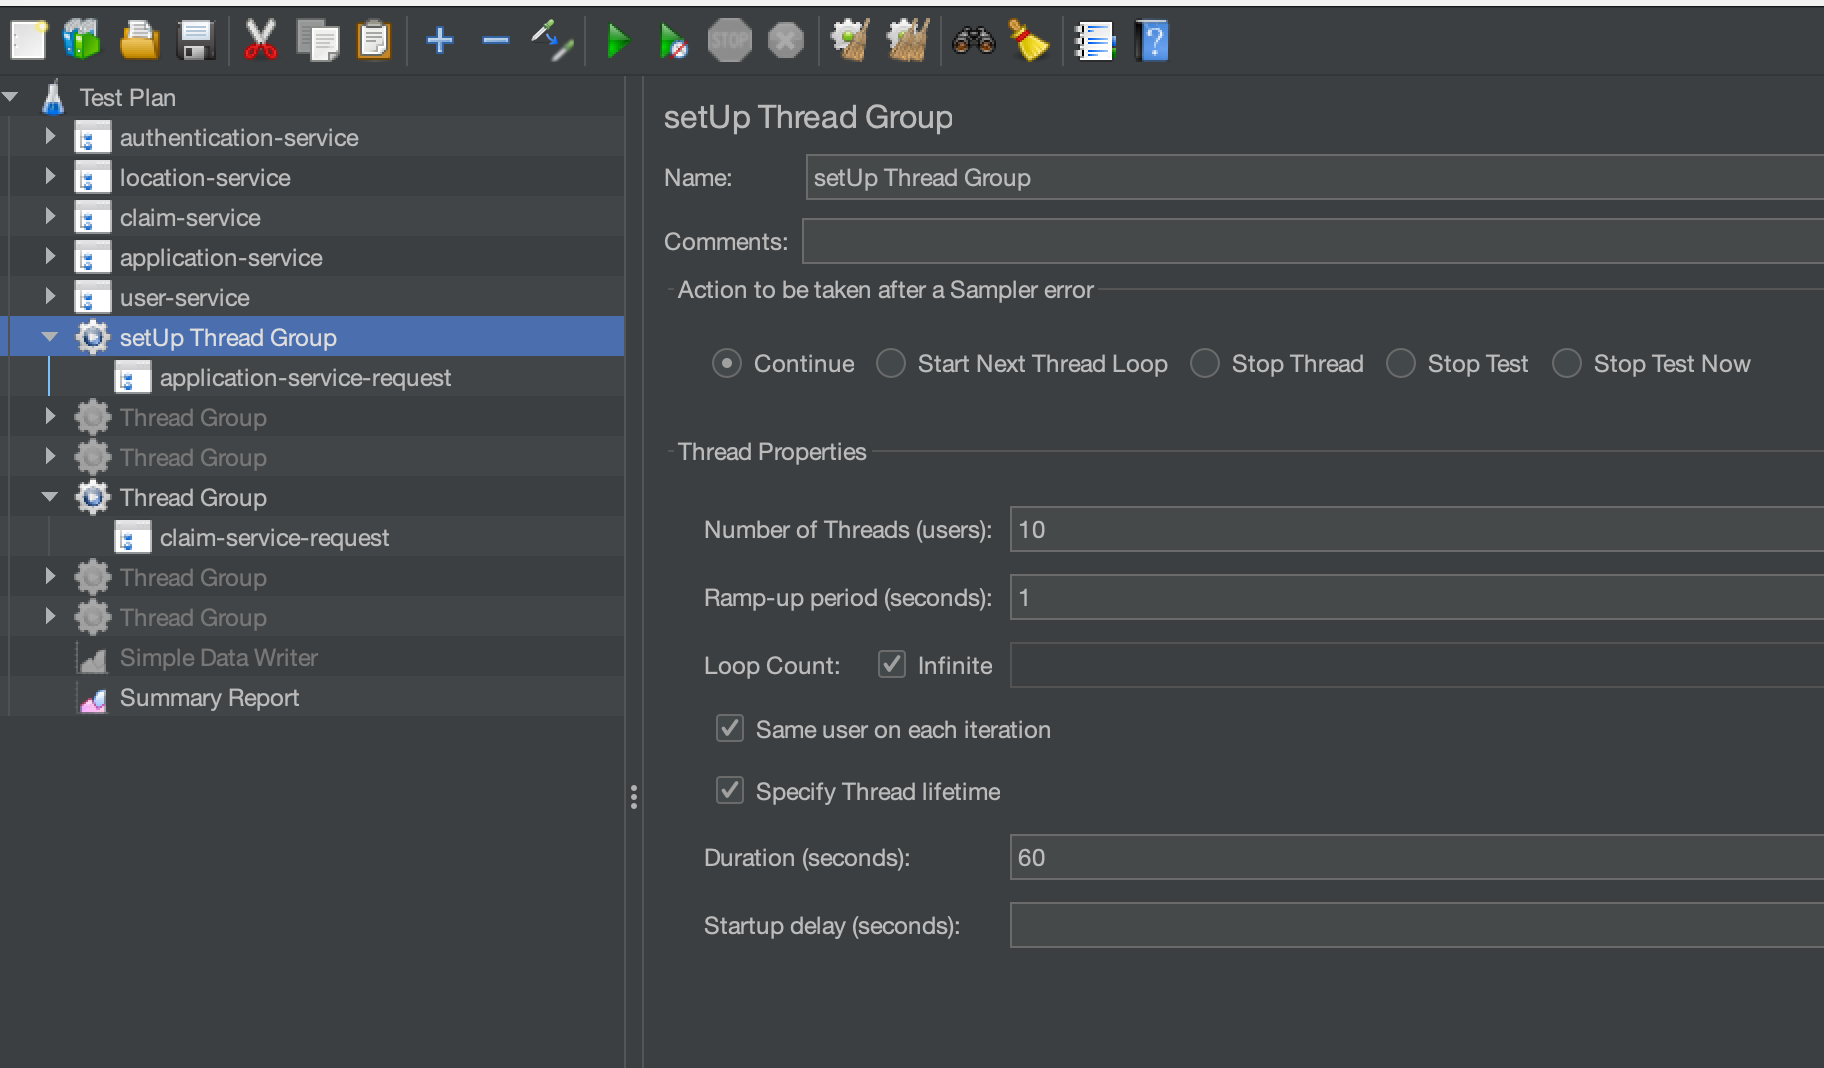
It is possible that you may need to run your tests sequentially. An example may be if the data created by one microservice test creates data for the use in another microservice test. Let’s use our dummy microservices to consider an example. To performance test the claim service, we may need a large number of applications created to create a claim against. We therefore would need to run the application service first and then the claim service after. You will find that this is probably the case for many applications that use microservices, that you can use them for data set-up to support your testing. We will update our dummy tests to provide an example of how we could do this. Firstly, we will create a setUp Thread Group. We will add the application service to this setup Thread Group. We will leave the claim service as it is in its own Thread group:
We need to make some changes to our samplers to support how they are used.
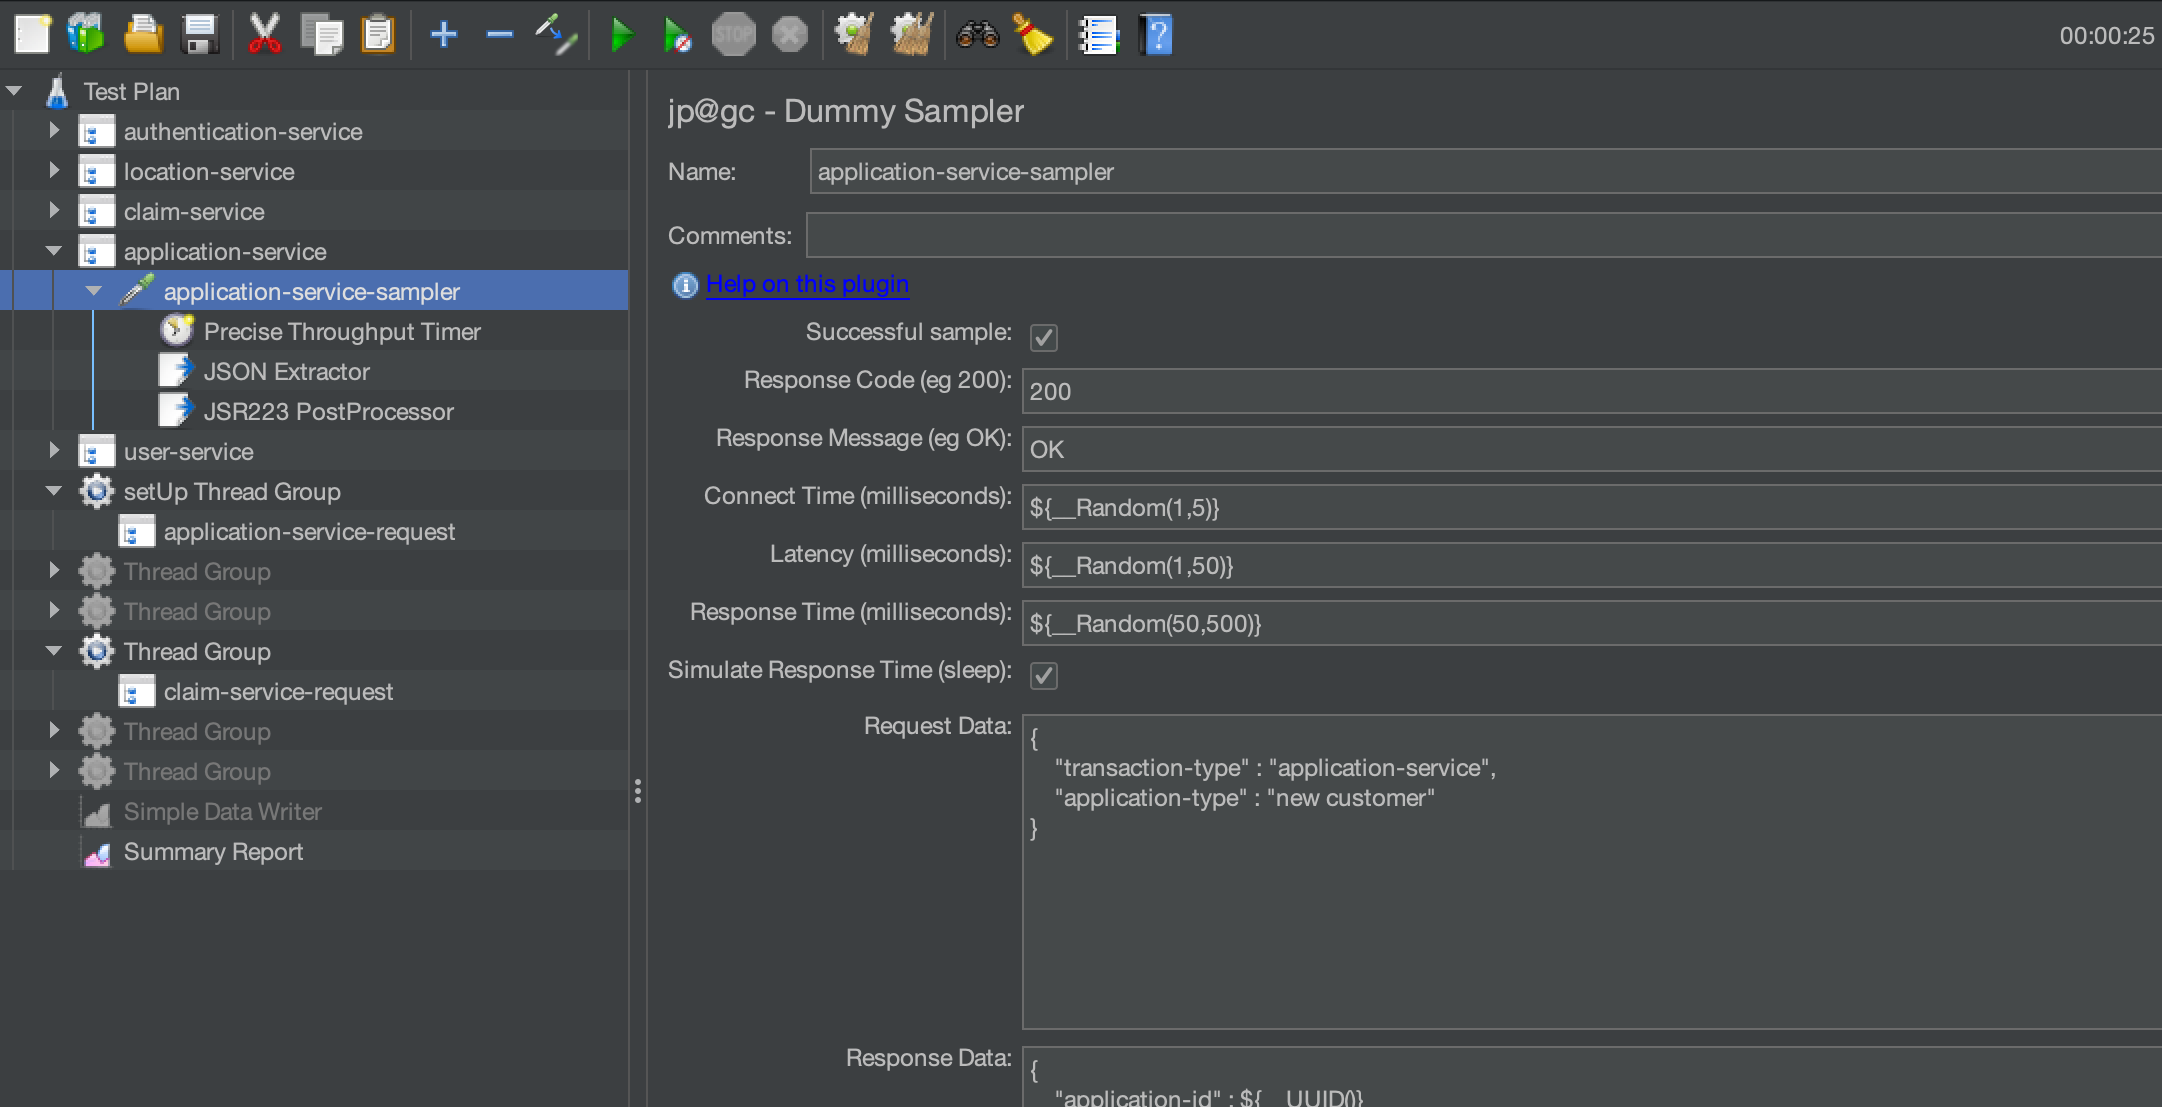
You can see that we output an application-id from the application dummy sampler. We have added a JSON Extractor and a JSR223 Post Processor to our sampler. Our JSON Extractor gets the application-id from the sampler response.

And our JSR223 Post Processor writes this value to a file.
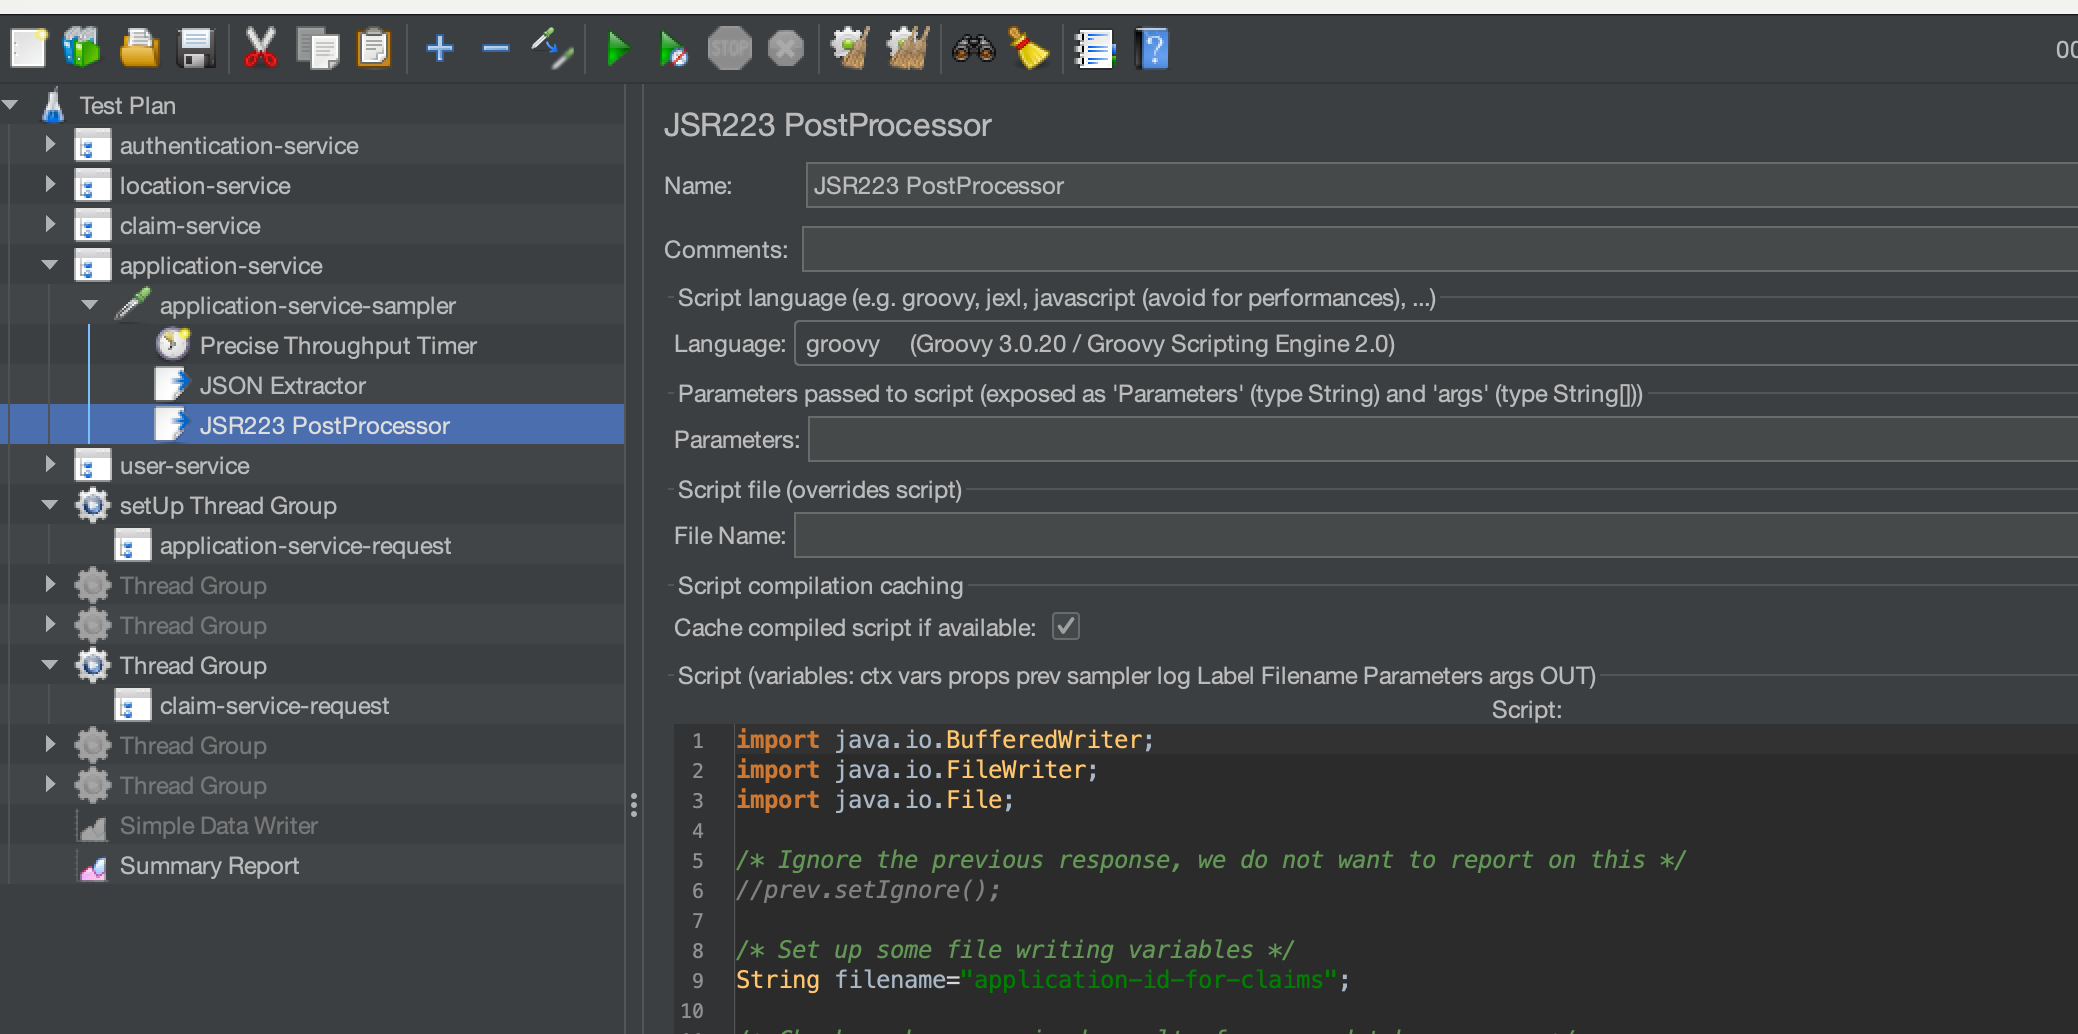
The code in full for our JSR223 Post Processor is:
import java.io.BufferedWriter;
import java.io.FileWriter;
import java.io.File;

/* Ignore the previous response, we do not want to report on this */
//prev.setIgnore();

/* Set up some file writing variables */
String filename="application-id-for-claims";

/* Check we have received results from our database query */
if(vars.get("application-id") != null) {

    /* Write the database values to a flat file to use in the vehicle-search-by-id thread group */
    File file = new File(filename);

    /* If file does not exists, then create it */
    if (!file.exists()) {
      file.createNewFile();
    }

    /* Create the data writers */
    fw = new FileWriter(file.getAbsoluteFile(), true);
    bw = new BufferedWriter(fw);

    /* Write the vehicle item id */
    bw.write(vars.get("application-id") + "\n");

    /* Close the file handlers */
    bw.close();

    /* Close the file */
    fw.close();
}
Where we output the application-id to a file called application-id-for-claim. We add a CSV Data Set Config to our claim service which will read the file we create in the setup Thread Group.
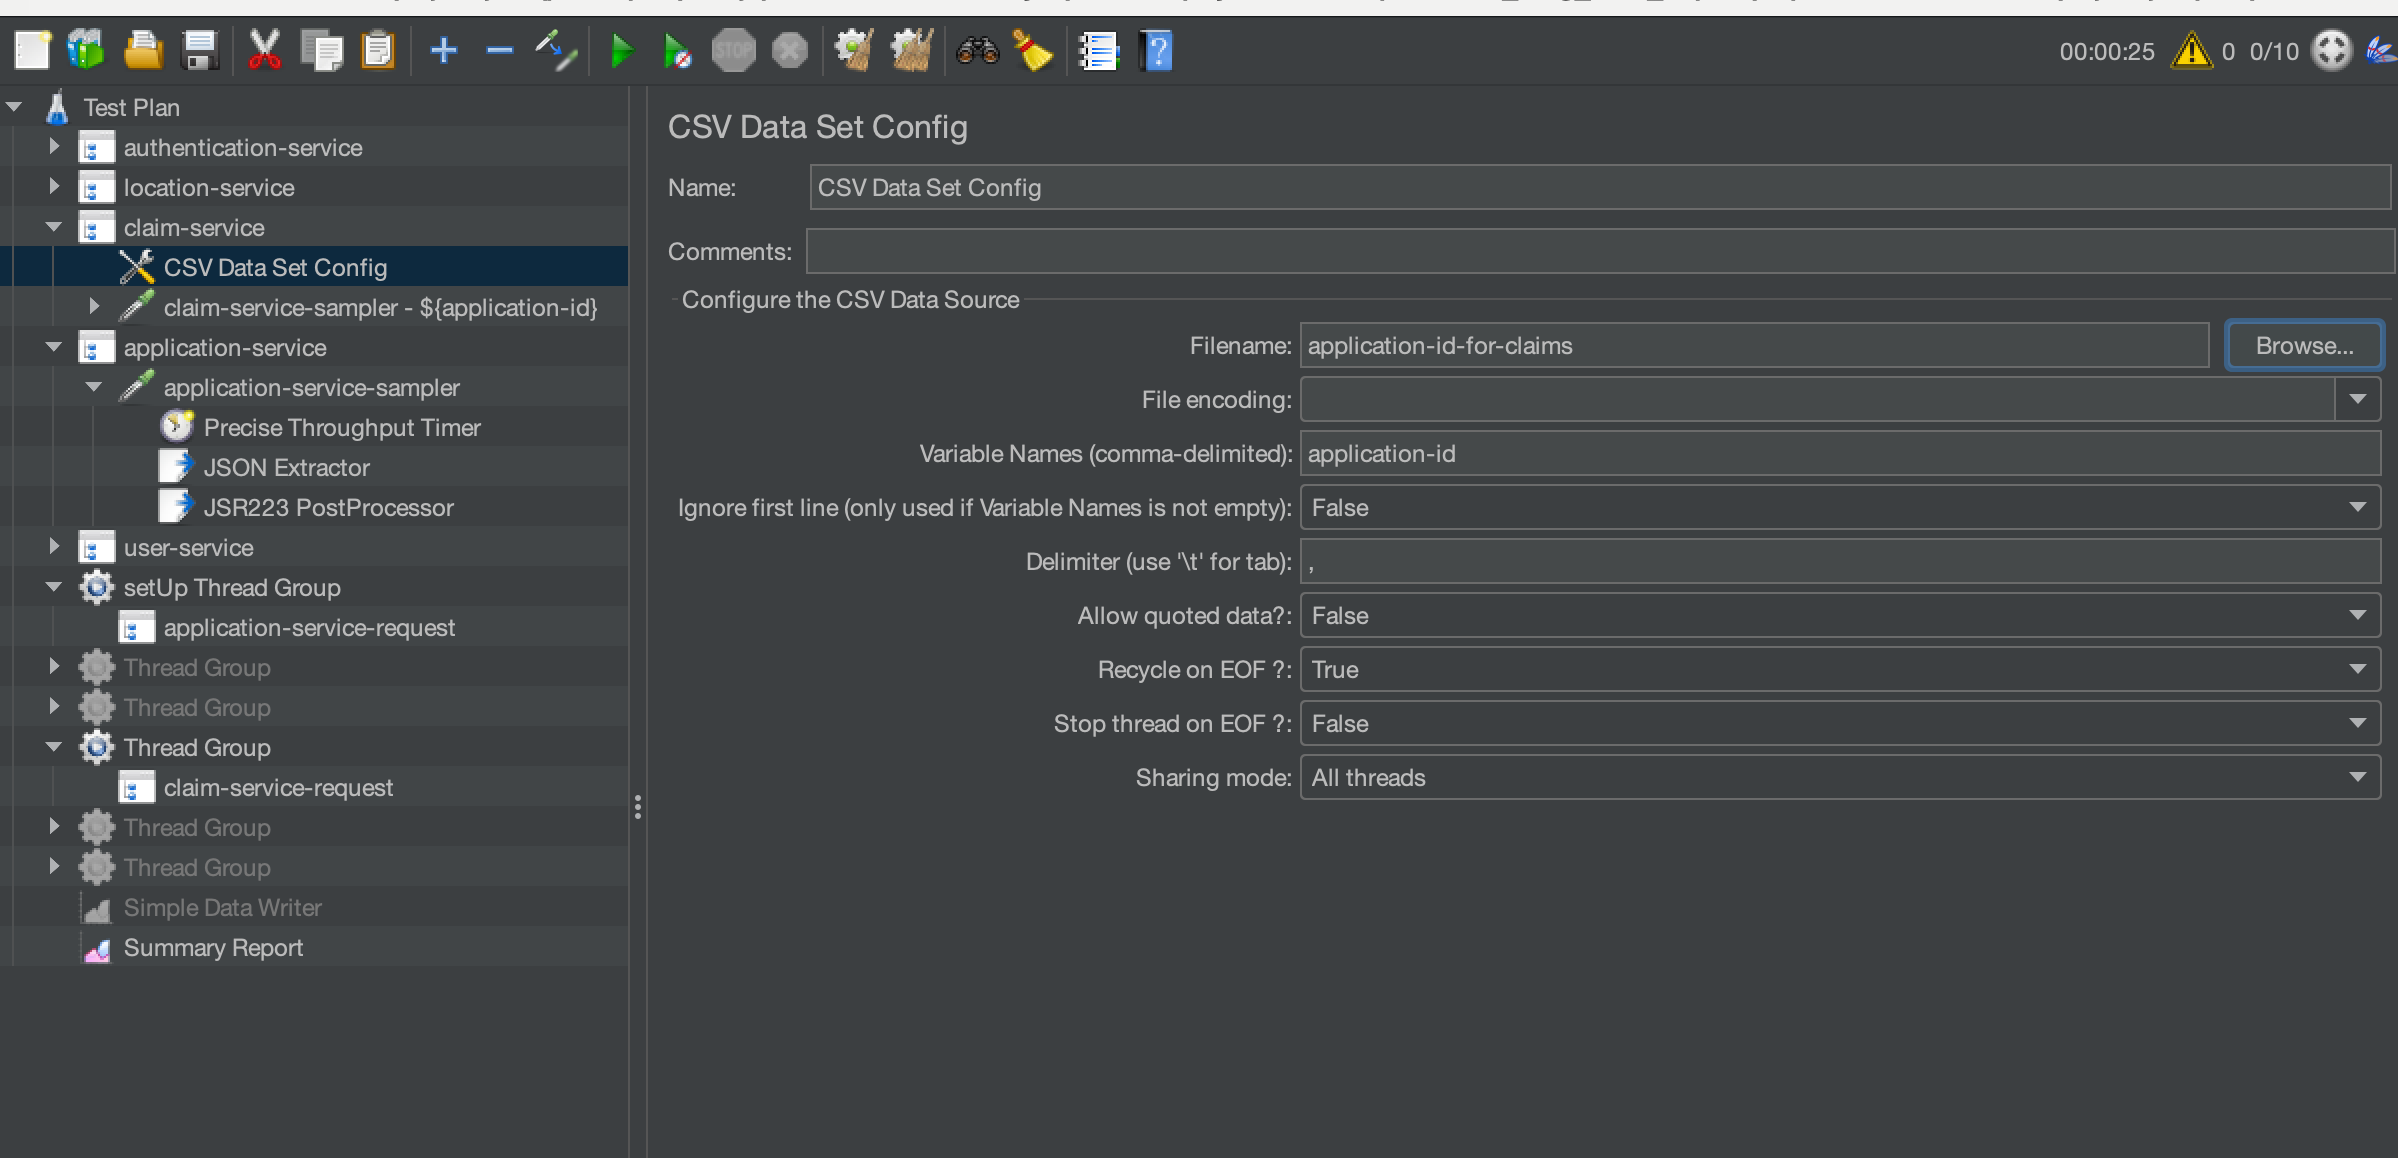
Finally, for the purposes of the post we will append the application-id to the dummy sampler’s name for the claim service as a simple way of showing we are picking up the values.

Once the test has been executed, we can see that the claim service entry in the Summary Report has a different value for the application-id variable we added to the sampler name.
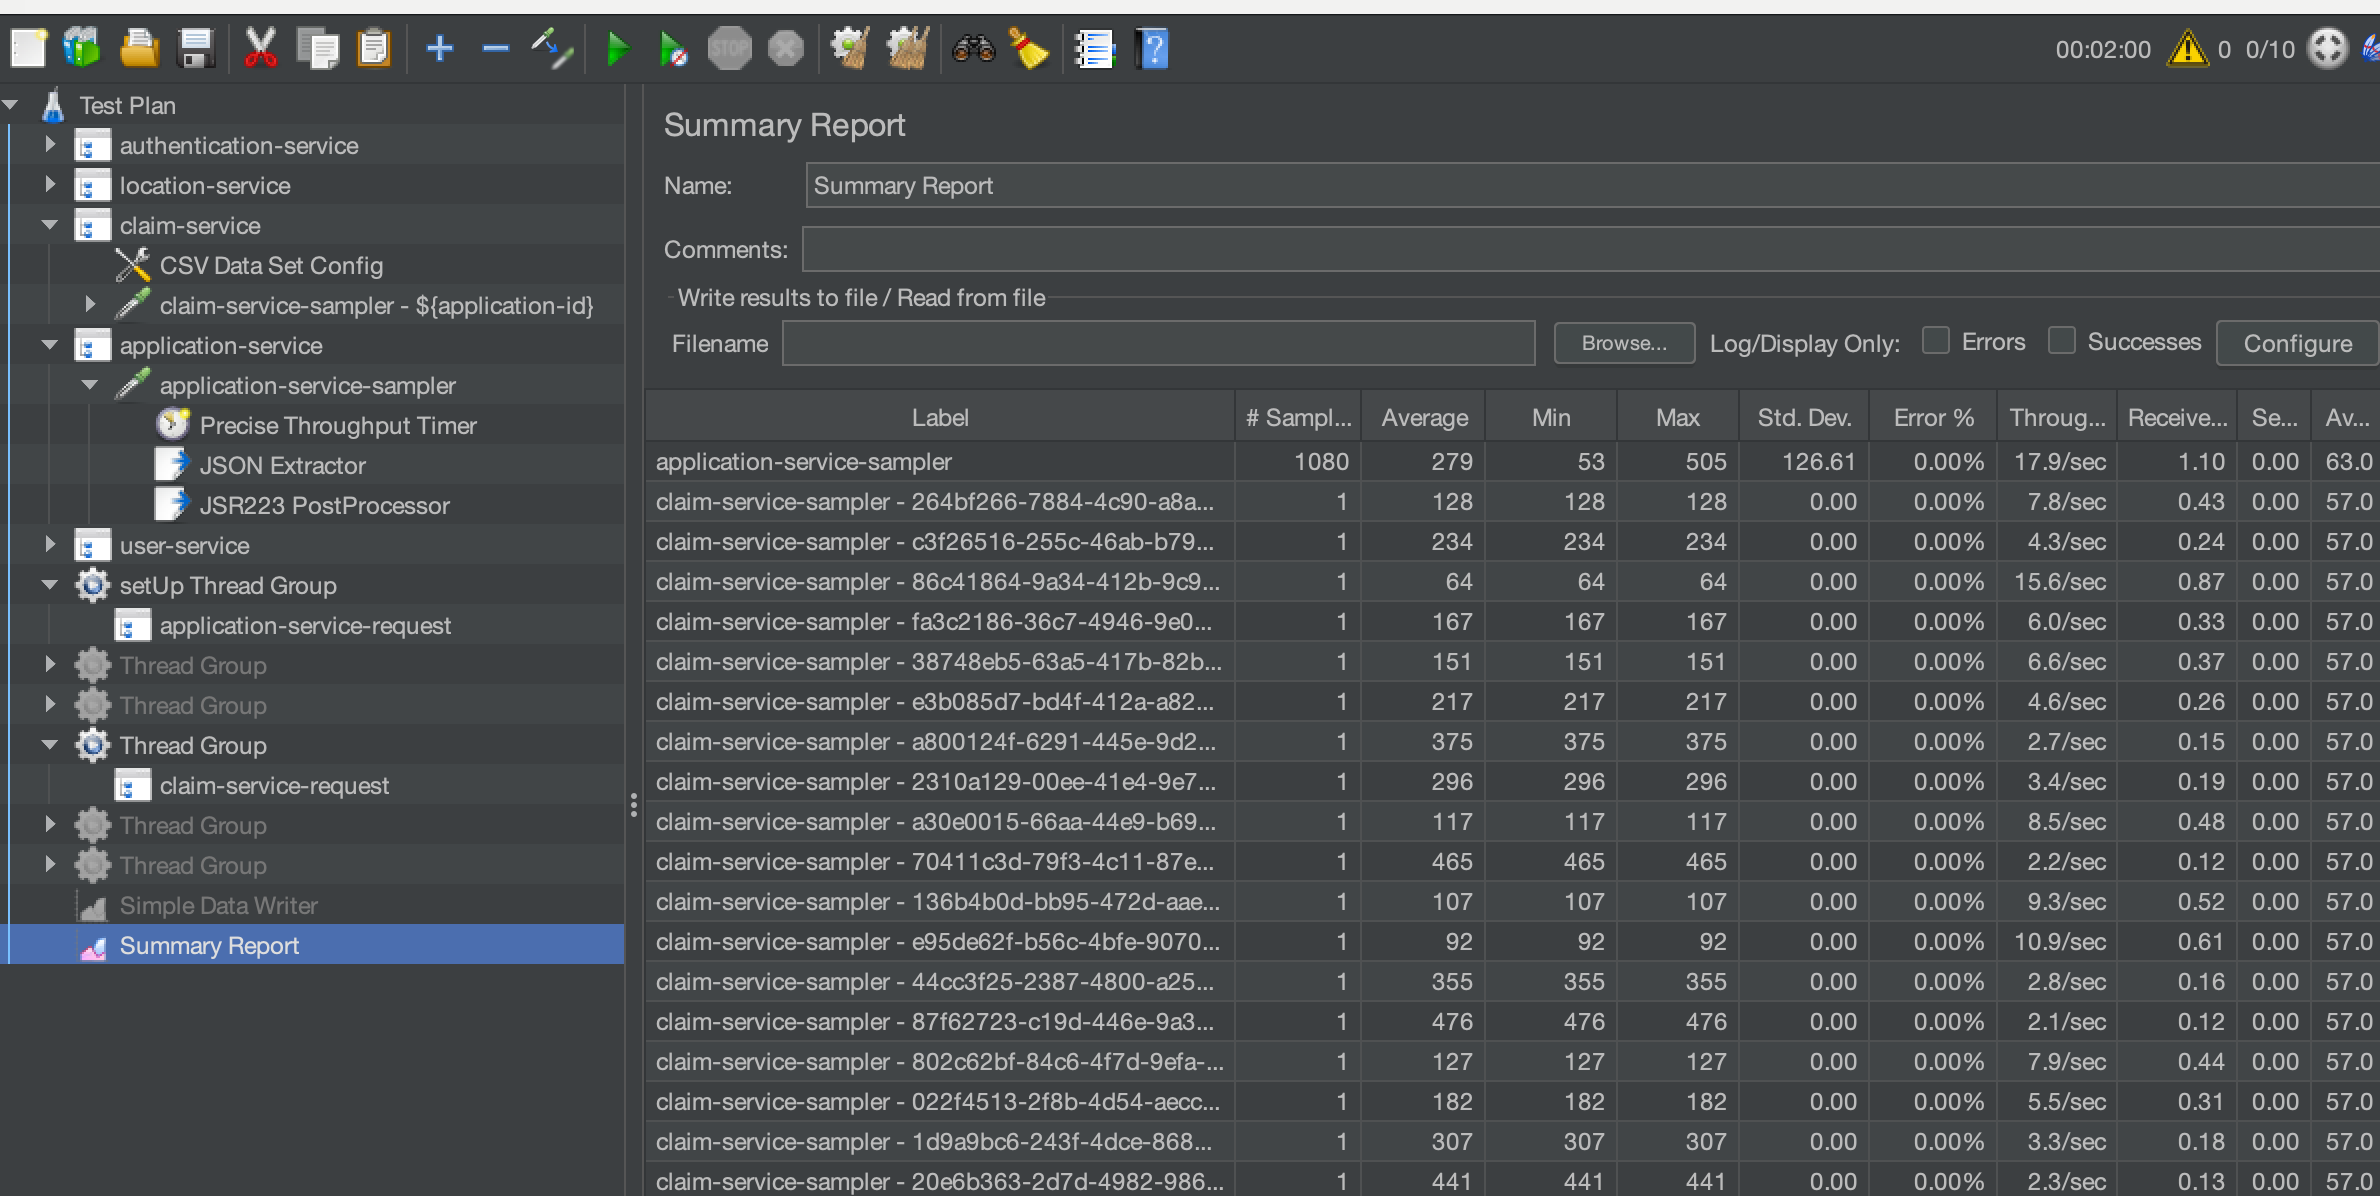
This is a very simple example of chaining microservice requests and one that will undoubtedly prove useful as your performance tests increase in complexity.
Conclusion
We have looked at ways to approach microservices performance testing, hopefully these examples will help you in get started with the performance testing of microservices and distributed systems. The JMeter script used in this blog post can be downloaded here.
