Troubleshoot your tests
Article Summary
Reliable load tests require solid preparation, controlled smoke testing, and structured error analysis.
Validation and smoke tests help detect script issues early and establish trustworthy baseline response times.
The guide explains how to identify common problems such as missing agents, premature test stops, and overloaded load generators.
It details how to distinguish script errors from server-side failures using response codes, error rates, and logs.
Clear troubleshooting patterns make it easier to isolate root causes and avoid misleading performance conclusions.
Table of Contents
Introduction
Preparing resilient tests can be a challenging process when you do not know where to start. We will cover this in this guide, from the virtual user validation to smoke testing. And then analyzing the most common errors and how to fix them. Note that we also recommend reading this other guide, it can greatly help understand the analysis and report engine of OctoPerf.
As a final note before we start, as much as you might want to jump to the relevant section of this guide, I strongly recommend you take a few minutes to read the next section since proper test preparation is essential to a strong error analysis later.
Test your tests
Validation
The first step toward resilience is to test your virtual users before moving to a real load test.
That is the purpose of the Virtual user validation :

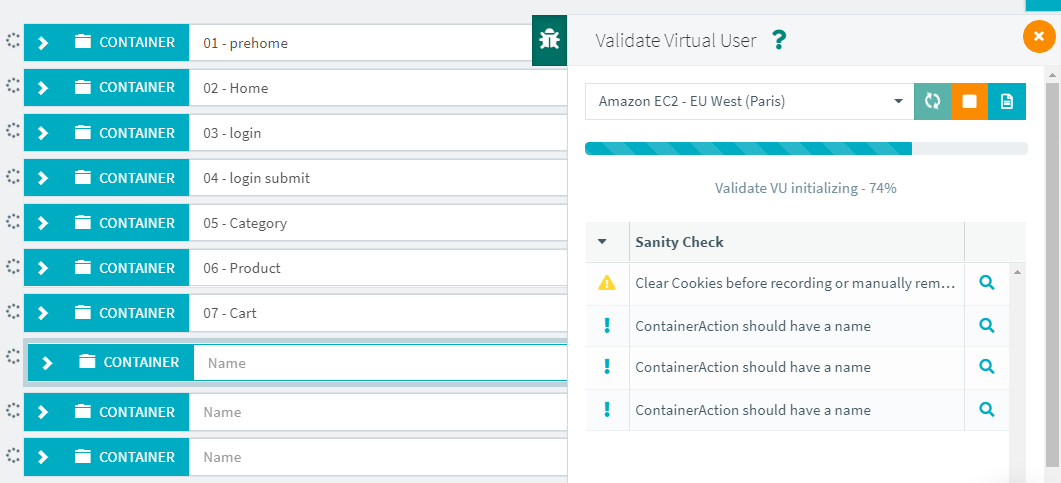
Each validation will run a real test but with only one user and one iteration only. You can also select the load generator location, in particular if you need to select an on-premise or dedicated IP agent.
Sanity check
The first important thing about the validation is the Sanity check section. As you can see on the screenshot above, we have a few messages in this section.
Here are the various alerts you can get:
- Critical: The Virtual user cannot run because a critical element is missing or misnamed. These alerts must be fixed before any test can be launched because they might lead to incorrect behavior otherwise (JMeter crash on startup, test stopping too early, etc...),
- Warning: An important message, yet it may not be necessary to fix it. In the example above we have not cleared the cookies when recording the HAR file, this may cause issues since some of the cookies will be reused (mostly on PHP applications), but most applications will tolerate it without any issue (or just invalidate the cookies anyway).
- Info: This message is just for information purpose and no action is required. In our example some containers have empty names, it's not a big issue but it can make the report harder to read.
In any case, the best thing you can do at this stage is read the message and click on the magnifying glass icon on the right to see where the issue can be fixed.
Validation results
Once the validation is complete you will get results as colored dots on the left:

First, it is important to understand that when hovering your pointer on the dot you see the number of executions of each node (including its children), the absence of a dot indicates that this node wasn't executed last time (because it was added in the meantime or a condition wasn't met).
There are several colors possible:
- Green means the response code is
2XXor3XXand identical to the recorded response, - Orange means the response code is either different or a
4XX5XXcode, - Yellow means partial failure, in particular when only one request inside a container/loop has failed.
You can check the error matrix from our documentation if you want more details.
Note that during a test, JMeter will only consider 4XX and 5XX response codes as failed.
We handle things differently during the validation to highlight all the potential issues.
For example getting a 200 code instead of a 302 redirect may not seem like a big deal, but a lot of applications react this way when a login is failed.
The goal at this stage is to highlight such behaviors so that you can investigate. In our example we need to look closer at the /favicon.ico:

We can clearly see that the recorded (left hand) response and the validation one (right hand) are both 404. This means there's no favicon.ico on this website and we will get a 100% error rate on this step if we leave it in our tests. Understanding this we now have two paths:
- Deactivate this request so that we do not get a 100% error rate later,
- Ignore this 404 using a response assertion but keep the request.
Validation logs
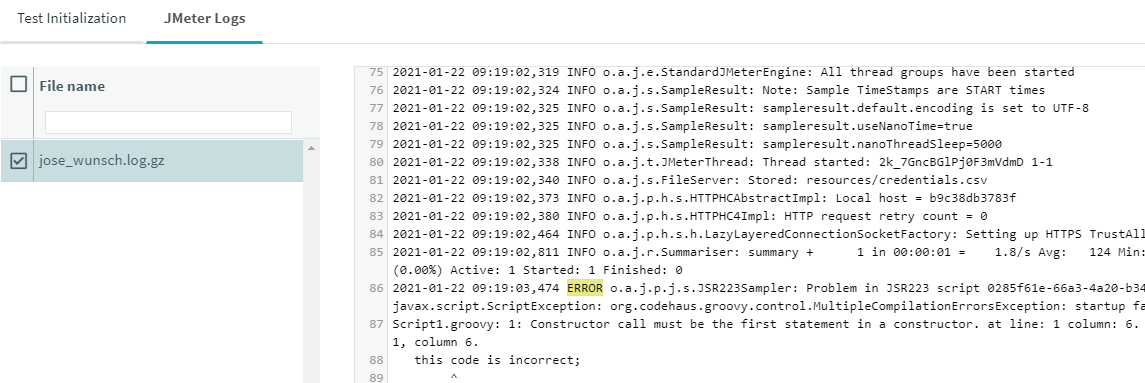
In case you experience a weird behavior or there's something you don't understand, checking the JMeter log can help. You can access the log panel by clicking on the blue button next to start/stop validation. In there, check the JMeter log panel and you can use CTRL+F to search for ERROR, the log should not contain any error message but if it does you should pay attention to it. For example here a JSR script failed:

Be aware that the logs are short-lived and if you leave the page, the logs will be purged. That could explain why you cannot find the logs button later.
Smoke test
Setup
Now that we know one user and one iteration is fine we can step up a bit. And before going for a full fledged load test it is very important to run a smoke test first.
Here the idea is to run one or a few users (<10) for each virtual user profile and have them loop/iterate 10 or 20 times. The purpose is to get the best possible response times by running as few users as possible but to also get average values that make sense by running them in a loop for at least 10 or 20 iterations.
To that end we will configure a runtime profile like this:

The important settings are:
- Load policy: Only one concurrent user, no ramp up,
- Duration: 20 minutes to give enough time for:
- Iterations limit: 20, just enough for a 95 percentile to start having some relevance, you can adapt this to your need obviously,
- Think time: Set to 0 since pacing the execution doesn't matter for a smoke test.
Other settings can be adjusted (Error policy, cache, etc...) but they are less important on such a test.
Analysis
Now what matters first is the errors and error rate for each step. You want to use the result tree to get a good feel of what's going on in that regard. Ideally you want to fix any issue and re-run this test until it is 100% passed. We will cover detailed error analysis later on in this guide.
The other good reason to execute a smoke test is that you now have response times that can be compared with your load tests later. That will highlight how the added load reflected on your application.
Common issues
My test didn't start
The test startup process goes through different stages called test status. There's only one reason for a test that doesn't start and it is when there's no load generator to run it. This doesn't happen with cloud load generators since we start them on demand but when selecting an on-premise location you may not have enough agents running to execute your test:

You can easily fix this by adding more agents or changing the configuration of your provider to allow more users per agent.
My test ended too soon
There's plenty of test-ending events that can come into play. We have listed them in our documentation along with how to spot them, but here's a short list:
- CSV configured with
Stop VUend of file policy, - Error policy on
Stop VUorStop test, - Thread (virtual user) finished because of large delays making him inactive until the end of planned duration.
These events can stop your test entirely or just stop users. Once all users are stopped, the test is also stopped. The best way to understand which one of these is responsible for stopping your test is to look at the test JMeter logs.
Load generator issues
Identification
To guarantee that load generators are not the root cause of any issue, we automatically monitor them. If any of the automatic thresholds is passed, you will be warned with an alert in the upper right panel during the test and when you open the report later:

If you click on this alert, it will lead you to the threshold table (or you can go there manually):

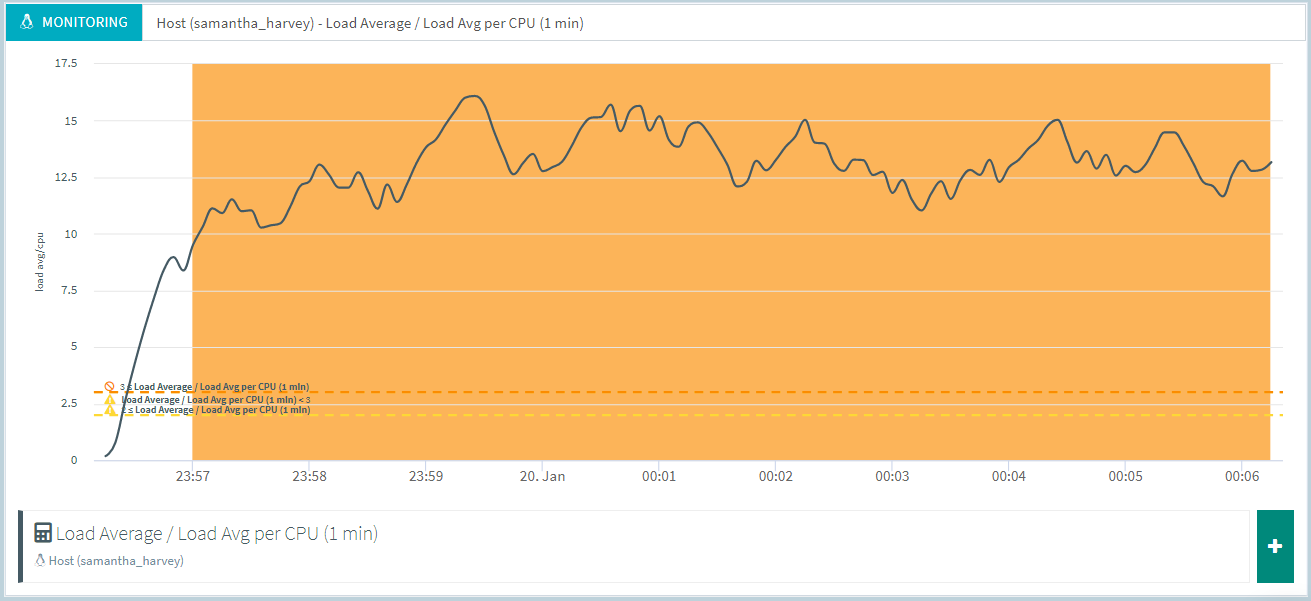
In this case we can see we have several alerts on the CPU of our load generator. Load average is also going high, which is often a consequence of high CPU usage. The alert duration tells us this was not only a spike, it lasted for a few minute. If more details are needed, a click on the icon on the right will display a detailed graph:

Clearly there was a CPU overload for the entire test and this must not be ignored because when the CPU is overloaded the response times computation can be wrong. Meaning the response time is probably smaller than the one being displayed in the report.
Solutions
First it is necessary to understand that even though OctoPerf provides a large amount of hardware per virtual user, it is still possible to do anything you want with JMeter and end up overloading the load generator anyway.
The main reasons for a load generator being overloaded are:
- Large tests (>100 virtual users) with no delay, think time or pacing. Because of this the load generators has to handle a lot of threads that are trying to go as fast as they possibly can and quickly ends up being overloaded. In this case it is important to use some delay in each virtual user and assess what is a suitable rate per user that doesn't overload the load generator. A small think time per request is usually enough, but it is even better to use a throughput limit or pacing.
- Heavy virtual users with either a lot of JSR scripts, post processors or the download resource option activated on a lot of requests. In that case we recommend increasing the memory requirement per user, so that OctoPerf provides more hardware per virtual user.
- Unnecessary logging, samplers or debug information can also become a problem. Try to check the test logs and see what their size is. You should not generate more than a few megabytes of log per test. Otherwise, it could cause a disk I/O issue and slow down the rest of your test.
- The server hosting your on-premise load agent could have performance issues. This might happen if you installed the load agent on a mutualized server, where other heavy processes could run during your load test.
Of course the answer can reside in a combination of these factors, make sure to investigate each topic.
Error analysis
Errors will appear in your report in several places:
- As the overall count/percent inside the Statistics report item,
- As a per second count/percent inside a line chart,
- As a response code percentage inside a pie chart or area chart,
- As a detailed error with request and response inside the error table.
We will be using some of these tools to further analyze errors later in this guide.
Understanding what kind of error you are dealing with is the first step toward fixing it. We've already written a quick guide on this subject in our documentation but today we'll dive into more details for each case.
General tips
Before we take examples, let's see a few tips you can use in any situation to assess if an error is related to your test scripts, the server or other issues.
Error rate
First you can make use of your earlier smoke test and for any error you got, check the error rate:

Of course, you must not make meaningful changes in your virtual user between the two tests or this comparison doesn't make sense anymore.
As you can see in the comparison, the error rate is identical on the first step, that indicates the issue here is not related to the level of load but rather something happening all the time or an issue with your virtual user that you should have fixed (here a 404 on a resource that we can ignore).
On the other hand, the login submit container has an increased error rate under load and that indicates that this issue is not related to the virtual user but rather related to the level of load. That strongly indicates an issue with the login service and should be investigated before conducting further tests.
Response codes
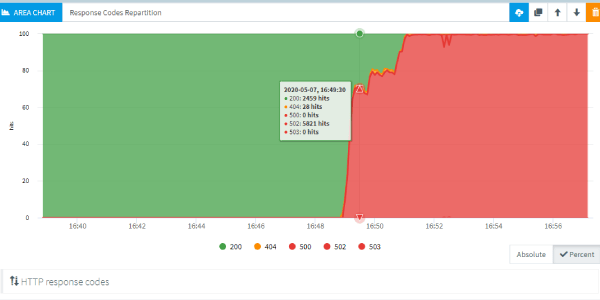
Another big help is the response codes over time:

This way we can quickly tell that something went wrong after a while. Looking at the global error rate may not be so obvious because the number of errors could be low (in particular if there are timeouts) but seeing that all request fail tells a different story.
This could also be caused by a DDOS protection or a similar mechanism that would have to be deactivated during your tests. (You could also purchase and whitelist a couple of IP addresses to bypass it).
Assertion failed
This is the most straightforward one since assertions are user-defined. In OctoPerf you can tell them apart from the result table since they will have an exclamation mark:

On the other hand there's no standard way to analyze these since they can fail for any reason, mostly depending on the application but also on the assertion itself.
The best way to find out is to try to reproduce the issue in the application itself, which is why it's very important to put assertions on key steps like login for instance. This way, using the error details you can see which login was used and try manually.
404 Not Found
This code means the server has not found anything matching this URL. It could be because of a variable that is not properly evaluated (earlier processor failed to extract, variable not defined, etc...). Or simply because this URL doesn't exist anymore or never existed in the first place.
It can be fixed by correcting your virtual user, for example if you changed the hostname of the request, make sure to change the host header to match it as well.
If the 404 also exists on the real application, report it and consider deactivating the request to make the test results easier to read.
Server error 5XX
All the 5XX codes share a common topic, they are server errors. As such they can usually be explained in two ways:
- Invalid request sent (for instance because of failed correlation, or earlier step with extractor failed),
- Server overloaded.
The best course of action is to check the details to see if the request sent seems correct, if it does then you know the server is probably getting too much load. And that means you need monitoring to understand the issue better.
503 Service Unavailable
This specific code generally falls under the same category of error than all the 5XX codes. Most of the time it is used to notify that the service is overloaded.
But sometimes when it comes to login, applications will use this code to notify you that your login is incorrect usually along with a message like "unauthorized". In this case, you either missed a correlation for the session identifier or the login used by this virtual user was incorrect.
504 Gateway Timeout
This is the most straightforward of all codes, it can only indicate a timeout. In this case the server is clearly overloaded.
It sometimes pairs with 502 Bad Gateway that could mean one of the network component on the way is also failing to forward the traffic.
JMeter error
When the underlying JMeter encounters an error he cannot handle you will get a response code like this:
HTTP/1.1 -1 - UNKNOWN
It can have several explanations, some linked to your virtual user like:
java.net.URISyntaxException: Illegal character in path at index 39: https://petstore.octoperf.com/actions/${path}
We can clearly see that a variable failed to evaluate and that resulted in invalid chars in the URL. Of course here, you should investigate why this variable didn't evaluate properly, but different use cases can have different explanations.
Timeouts
The most common cause for a JMeter error are timeouts. They can occur either because the response timeout was reached or because the remote host closed the connection. These errors are not related to JMeter, but rather a sign that the remote server doesn't answer properly:
javax.net.ssl.SSLException: Connection resetjava.net.SocketTimeoutException: Read timed outjavax.net.ssl.SSLHandshakeException: Remote host terminated the handshakeorg.apache.http.NoHttpResponseException: XXXXX failed to respondorg.apache.http.conn.HttpHostConnectException: Connect to XXXXX failed: Connection timed out
Note that one of the main cause for timeouts is usually DDOS protection or mitigation systems that prevent load coming from a few number of IPs. As stated earlier, that can be addressed through dedicated IPs.
No route to host
This one is very specific since it only occurs when the remote host is not reachable. Most of the time this happens when you try to test an application that cannot be reached from our cloud load generators but if you only get in under load it means your application went down:
java.net.NoRouteToHostException: No route to host
Final words
We've also covered a lot of best practices around error analysis in our documentation, the best final advice we can give you is to go check it out as well.
Remember that any error that you didn't see during your smoke tests is very likely to be related to the load itself. Or at least, the fact that it did not occur with a low level of load is a strong indication that it's not a virtual user configuration issue. Using the above tips you should be able to pinpoint the origin of any issue, but feel free to leave us a message in the chat if you want our expertise on a particular use case.
