
5+ Ways to Debug a JMeter Script
If you ever have designed JMeter scripts, I bet you have been stuck at least one time figuring out why a Json Extractor is not working. Guess what? I've been there!
Do you know why best JMeter Performance Engineers almost always find solutions to their problems? They master JMeter Script Debugging.
That's why I have compiled the best JMeter Debug Practices into a huge single post covering:
- How to use the Debug Sampler (and get the best out of it),
- Leverage View Results Tree secret features: Regex Tester, Json Path Tester and Regex Tester (and never fail a variable correlation again),
- How to use Dummy Sampler to generate fake requests to try things (without hitting a real server!),
- And many other tips like How to view JMeter Logs.
Let's see them in greater details.
Debug Components
Mastering very specific JMeter Components is the key to properly debug a JMeter script execution and fix the issues.
View Results Tree
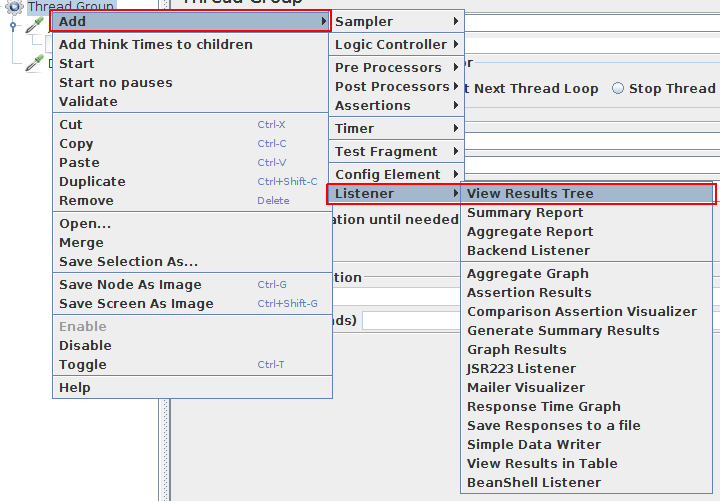
The View Results Tree component is possibly the most important one. It can be added to your JMeter script through right-click menu: Add > Listener > View Results Tree. And there is a reason why it's the most important listener!
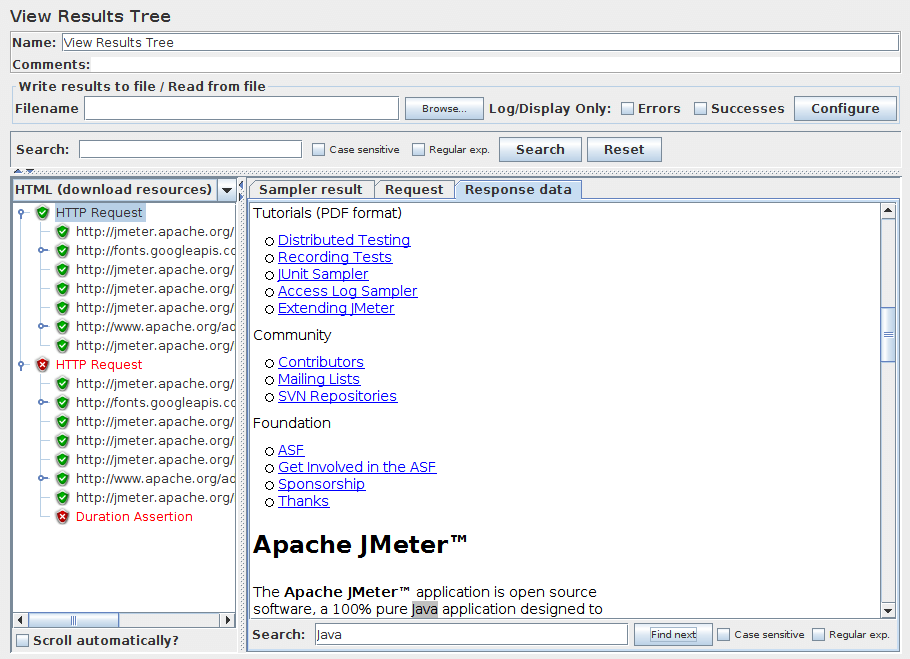
It allows to see numerous information like:
- Played request: the request sent by JMeter,
- Received server response: the responses sent by the remote server,
- And test Regexps, Json Paths, XPath expressions and more.
You are probably going to use Regex Extractors, JsonPath Extractors or even CSS JQuery Extractors to extract variables from responses. I'm not going to lie: they rarely work the first time.
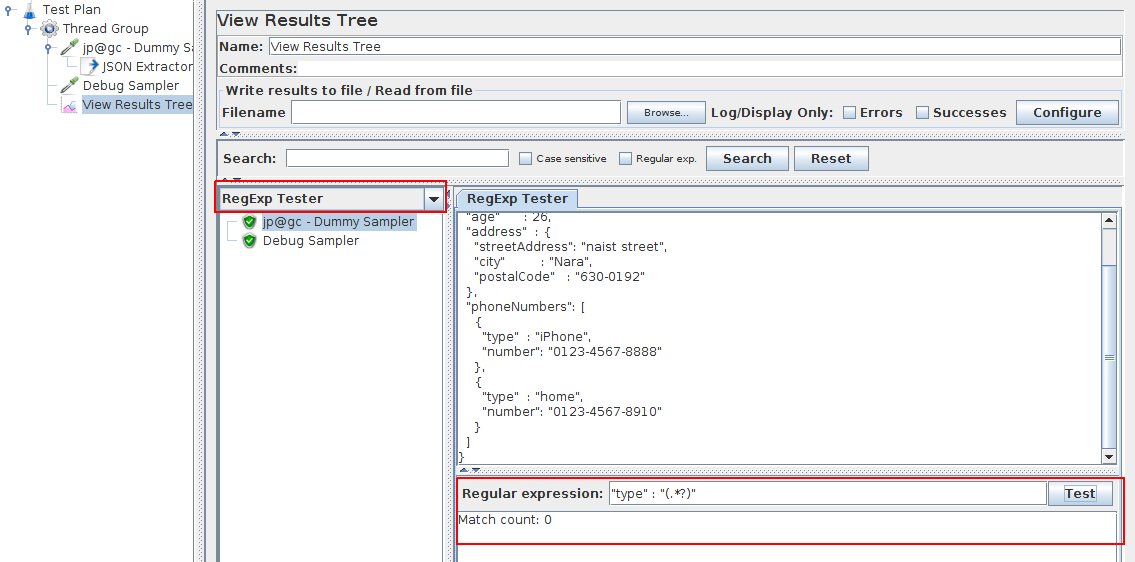
The Regex Tester is quite a bit hidden! It's accessible from the Dropdown menu right on top of the requests being played, within the View Result Tree panel. It allows you to try various Regular Expressions on the server response and displays the results.
It's much more efficient than:
- modifying an existing Regex Extractor,
- then re-running the entire script only to find out the extractor doesn't work properly.
And you know the best? It also provides testers for nearly every variable extractor available like the JsonPath Tester.
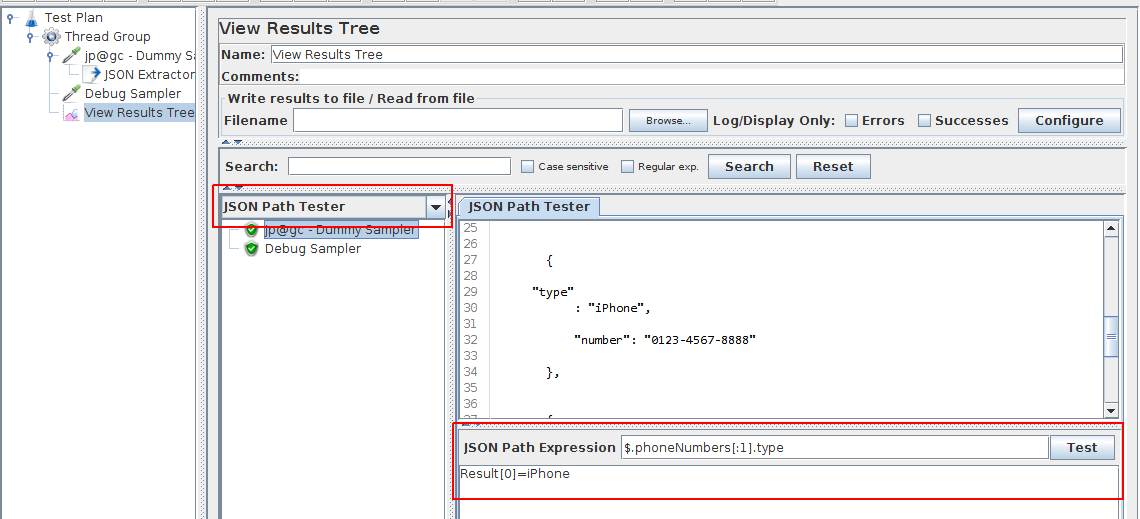
In the example above, i'm trying to extract the first phone number type by using JsonPath $.phoneNumbers[:1].type. It matches the iPhone value in the sample document:
{
  "firstName": "John",
  "lastName" : "doe",
  "age"      : 26,
  "phoneNumbers": [
    {
      "type"  : "iPhone",
      "number": "0123-4567-8888"
    },
    {
      "type"  : "home",
      "number": "0123-4567-8910"
    }
  ]
}
That's in fact the same example as on JsonPath Evaluator. Need to test Boundary Extractor? No problem: there is a Boundary Extractor Tester.
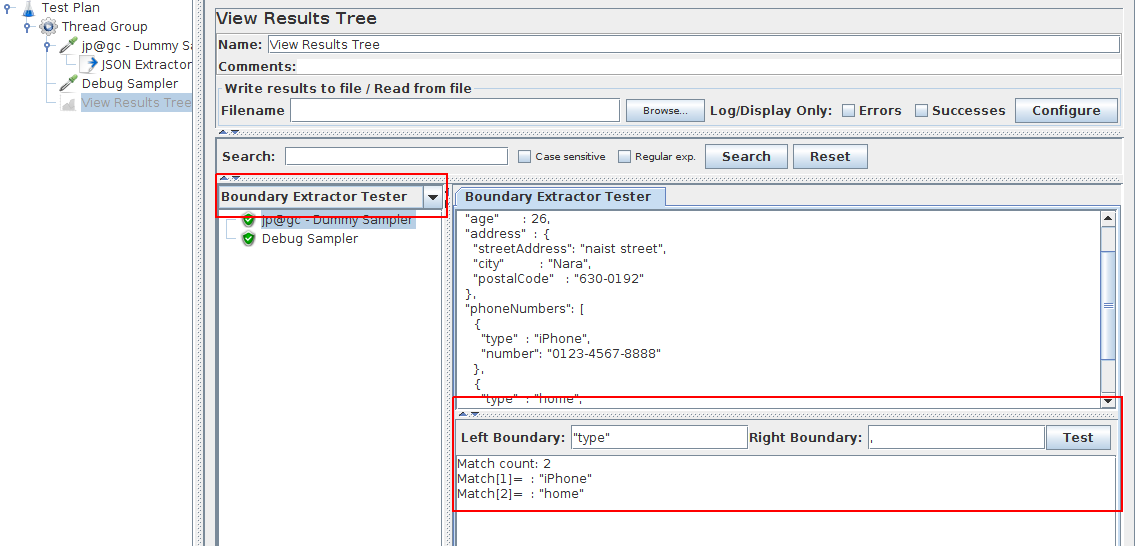
In the example above, i'm using the Boundary Extractor Tester. I'm trying to extract the phone number type using "type" left boundary and , right boundary. and it works surprisingly well!
Match count: 2
Match[1]=  : "iPhone"
Match[2]=  : "home"
Now that I have working boundaries, I can setup a corresponding Boundary Extractor on that request to extract the content I want.
I'm not going to cover extensively all possible testers but just let you know them:
- Xpath tester: test XPath expressions against an XML response,
- CSS/JQuery Tester: Test CSS JQuery selectors on the response,
- HTML, JSON, XML response parsers.
It even supports rendering the response within an embedded web browser when selecting Browser from the dropdown.
Debug Sampler
The Debug Sampler is the single most useful sampler you'll find in JMeter. If you have never used it before, I stronly encourage you to try it!
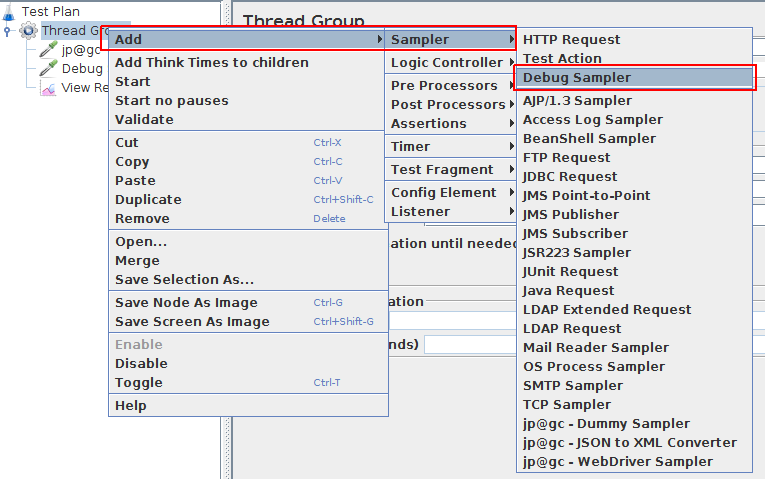
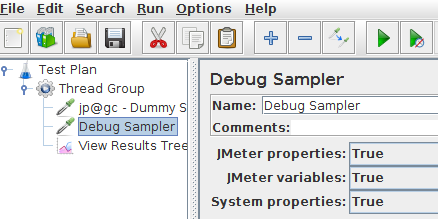
The Debug Sampler can be easily added through JMeter's right-click menu: Add > Sampler > Debug Sampler. It has the following settings:
- JMeter Properties: set to
trueto print JMeter Properties, - JMeter Variables: set to
trueto print JMeter Variables like${foo}(all variables set so far in the script), - System Properties: set to
trueto print Java System Properties.
You will most likely enable JMeter Variables output, as it's by far the most useful. So, What can this sampler be used for? Print useful information on each execution. Typically, you want to know if a variable extractor (like the Regex Extractor) has worked properly.
When used in conjunction with the View Results Tree, it can do wonders!
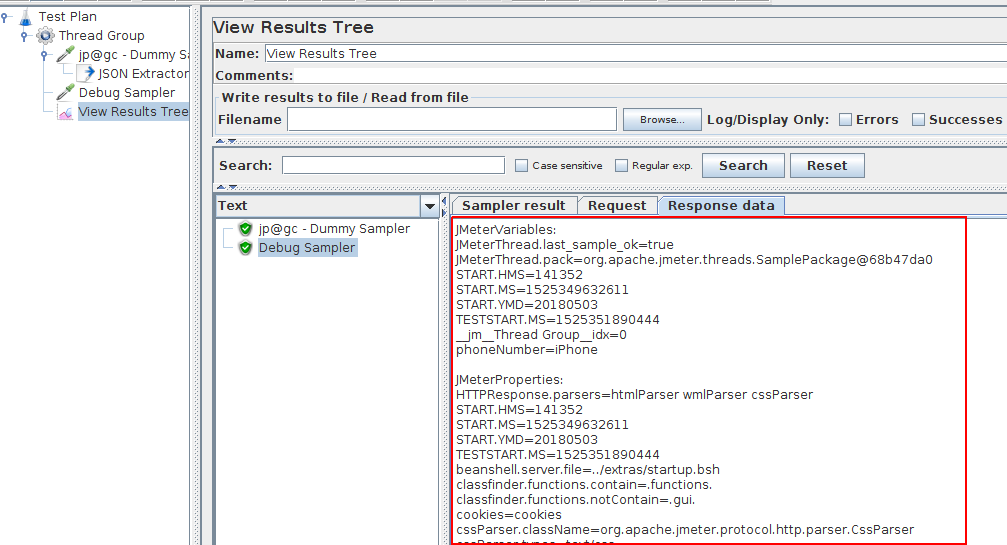
The example above shows the output printed by the Debug Sampler when configured to print basically everything. It looks like:
JMeterVariables:
JMeterThread.last_sample_ok=true
JMeterThread.pack=org.apache.jmeter.threads.SamplePackage@10702a2
START.HMS=141352
START.MS=1525349632611
START.YMD=20180503
TESTSTART.MS=1525354461536
__jm__Thread Group__idx=0
__jmeter.USER_TOKEN__=Thread Group 1-1
phoneNumber=iPhone

JMeterProperties:
HTTPResponse.parsers=htmlParser wmlParser cssParser
...
Here we can see that variable named phoneNumber has the value iPhone.
JMeter Logs Viewer
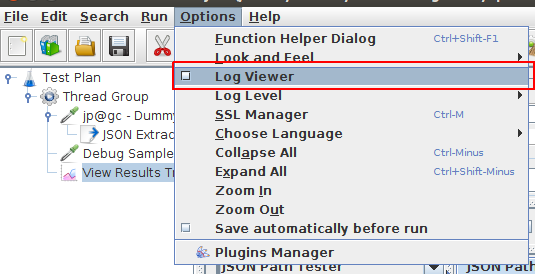
JMeter Logs viewer can be activated by clicking on top menu Options > Log Viewer. Need to disable it? Repeat the same operation. JMeter outputs a lot of information within logs.
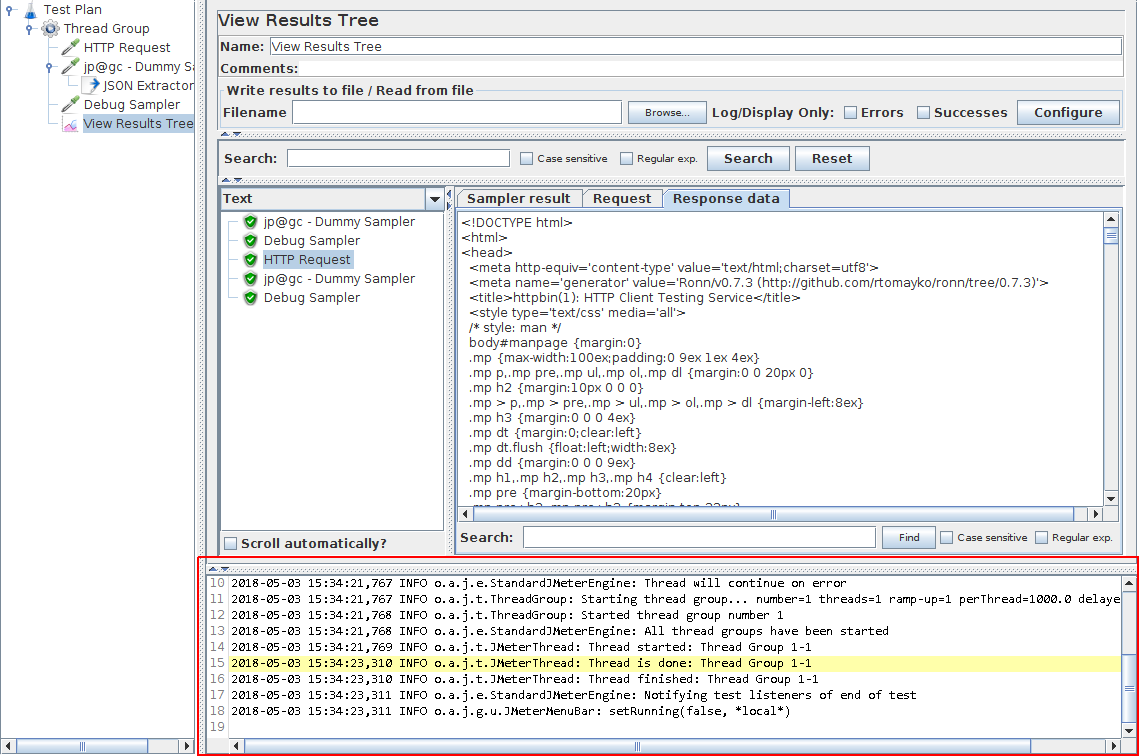
The Logs Viewer appears at the bottom of the right panel. It displays all the recent JMeter logs. Logs look like the following:
2018-05-03 15:34:21,768 INFO o.a.j.t.ThreadGroup: Started thread group number 1
2018-05-03 15:34:21,768 INFO o.a.j.e.StandardJMeterEngine: All thread groups have been started
2018-05-03 15:34:21,769 INFO o.a.j.t.JMeterThread: Thread started: Thread Group 1-1
2018-05-03 15:34:23,310 INFO o.a.j.t.JMeterThread: Thread is done: Thread Group 1-1
2018-05-03 15:34:23,310 INFO o.a.j.t.JMeterThread: Thread finished: Thread Group 1-1
2018-05-03 15:34:23,311 INFO o.a.j.e.StandardJMeterEngine: Notifying test listeners of end of test
2018-05-03 15:34:23,311 INFO o.a.j.g.u.JMeterMenuBar: setRunning(false, *local*)
It's especially useful to track ERROR logs. Those logs typically happen when something is not configured properly. I strongly suggest keeping an eye on logs all the time when debugging the script for this reason.
It can be annoying to have to open the Log Viewer each time. There is a workaround for this:
- Open
JMETER_HOME/bin/jmeter.properties, - Find the line starting with
#jmeter.loggerpanel.display, - Replace it with the line
jmeter.loggerpanel.display=true.
Debug output can be tweaked for each sampler:
- Select a sampler you want to debug,
- Click on top menu
Options > Enable Debug, - You should see something like this in JMeter Log Viewer:
2018-05-03 16:45:40,500 INFO o.a.j.g.a.What: Log level set to DEBUG for org.apache.jmeter.protocol.http.sampler.HTTPSamplerProxy
In this case, I've enabled debug logs on the Http Request sampler. But, it's not finished yet: by default, JMeter displays only INFO level logs. It means DEBUG logs must be enabled.
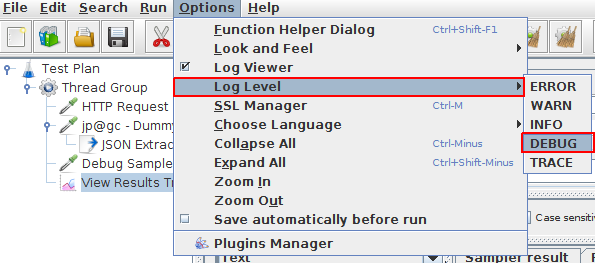
Select menu Options > Log Level > DEBUG. Now you should be able to see DEBUG logs within the Logs Viewer.
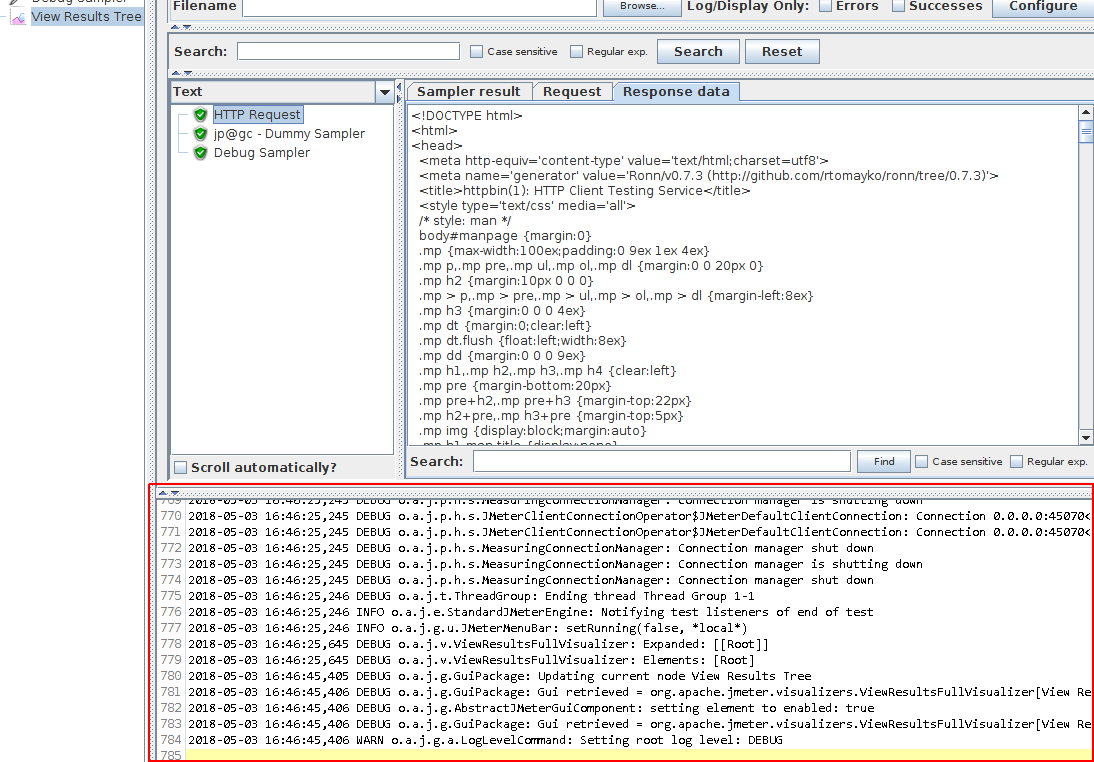
Here is an example DEBUG logs output:
2018-05-03 16:46:25,245 DEBUG o.a.j.p.h.s.MeasuringConnectionManager: Connection manager is shutting down
2018-05-03 16:46:25,245 DEBUG o.a.j.p.h.s.JMeterClientConnectionOperator$JMeterDefaultClientConnection: Connection 0.0.0.0:45070<->54.221.212.171:443 closed
2018-05-03 16:46:25,245 DEBUG o.a.j.p.h.s.JMeterClientConnectionOperator$JMeterDefaultClientConnection: Connection 0.0.0.0:45070<->54.221.212.171:443 closed
2018-05-03 16:46:25,245 DEBUG o.a.j.p.h.s.MeasuringConnectionManager: Connection manager shut down
2018-05-03 16:46:25,245 DEBUG o.a.j.p.h.s.MeasuringConnectionManager: Connection manager is shutting down
2018-05-03 16:46:25,245 DEBUG o.a.j.p.h.s.MeasuringConnectionManager: Connection manager shut down
This output is generated by the HTTP Request Sampler.
Dummy Sampler
The Dummy Sampler is a powerful sampler: it can generate fake results with the content you want. You may already have noticed I've used it several times already in this tutorial.
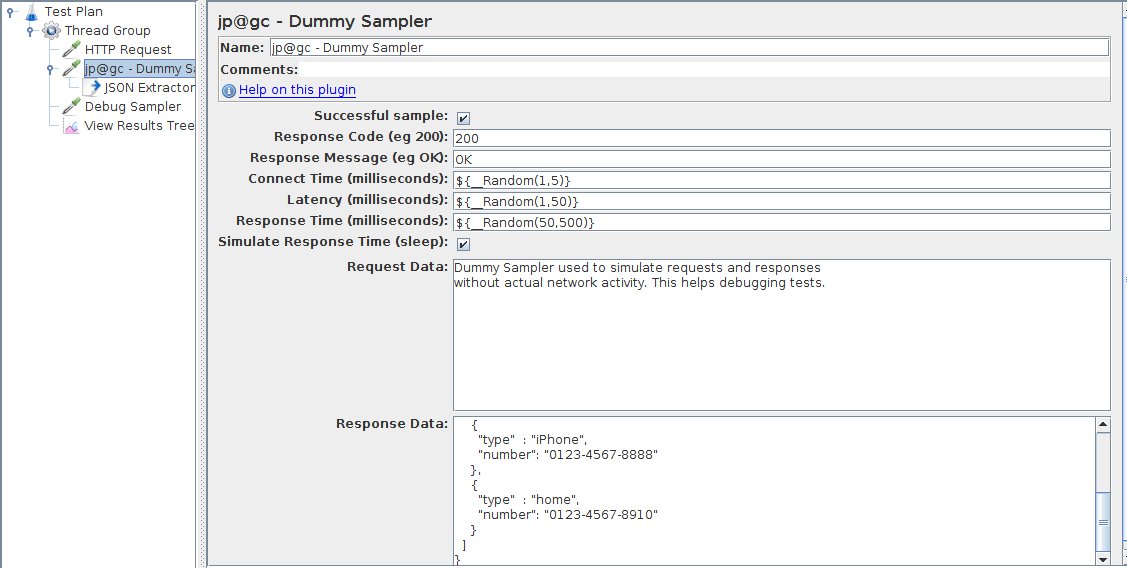
Dummy Sampler is not integrated into JMeter by default: it's part of JMeter Plugins. We have written a guide explaining How to install JMeter Plugins: it explains how plugins work and how to install them.
The Dummy Sampler is incredibly useful when you need to generate a server response with a specific content. It can sometimes be difficult when the tested application content is constantly changing.
Let's now see the ultimate way to debug any JMeter issue (given you have some programming skills)
Debugging JVM
As you know, JMeter is a Java Program: you can debug them remotely using an IDE like Eclipse or Intellij IDEA:
- Open a command-line and run
cd JMETER_HOME, (whereJMETER_HOMEis the location where JMeter is installed) -
Set the
JVM_ARGSprior to launching JMeter: -
On Mac or Linux:
export JVM_ARGS=-agentlib:jdwp=transport=dt_socket,server=y,address=8000
- On Windows:
set JVM_ARGS=-agentlib:jdwp=transport=dt_socket,server=y,address=8000
- If port
8000is not available, change to another value, -
Start JMeter with command:
-
on Mac or Linux:
./bin/jmeter, -
on Windows:
bin\jmeter.bat. -
You should see the line
Listening for transport dt_socket at address: 8000printed during JMeter startup. JMeter may not start until the remote debug launcher is started within IDE, - Create a Remote launcher within Intellij with same port as above (
8000in our case),
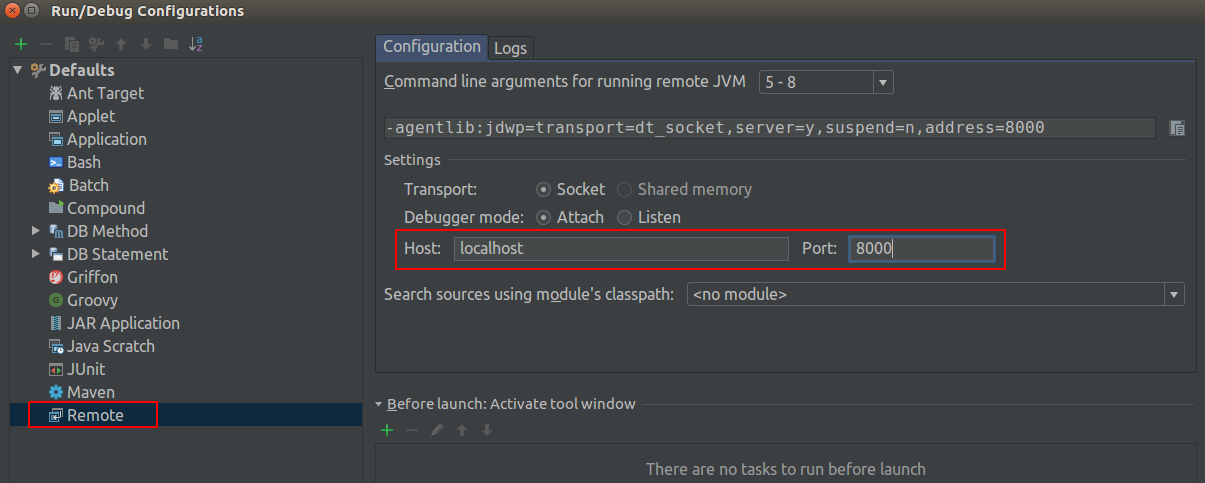
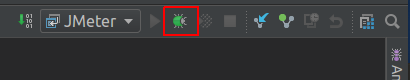
- Finally, launch remote debug.
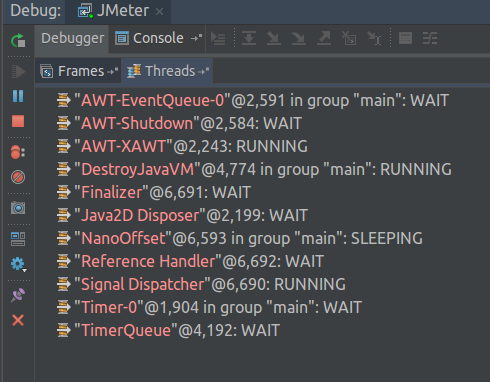
You should see JMeter launch and JMeter's JVM threads appear within the IDE debug panel.
Fiddler Proxy
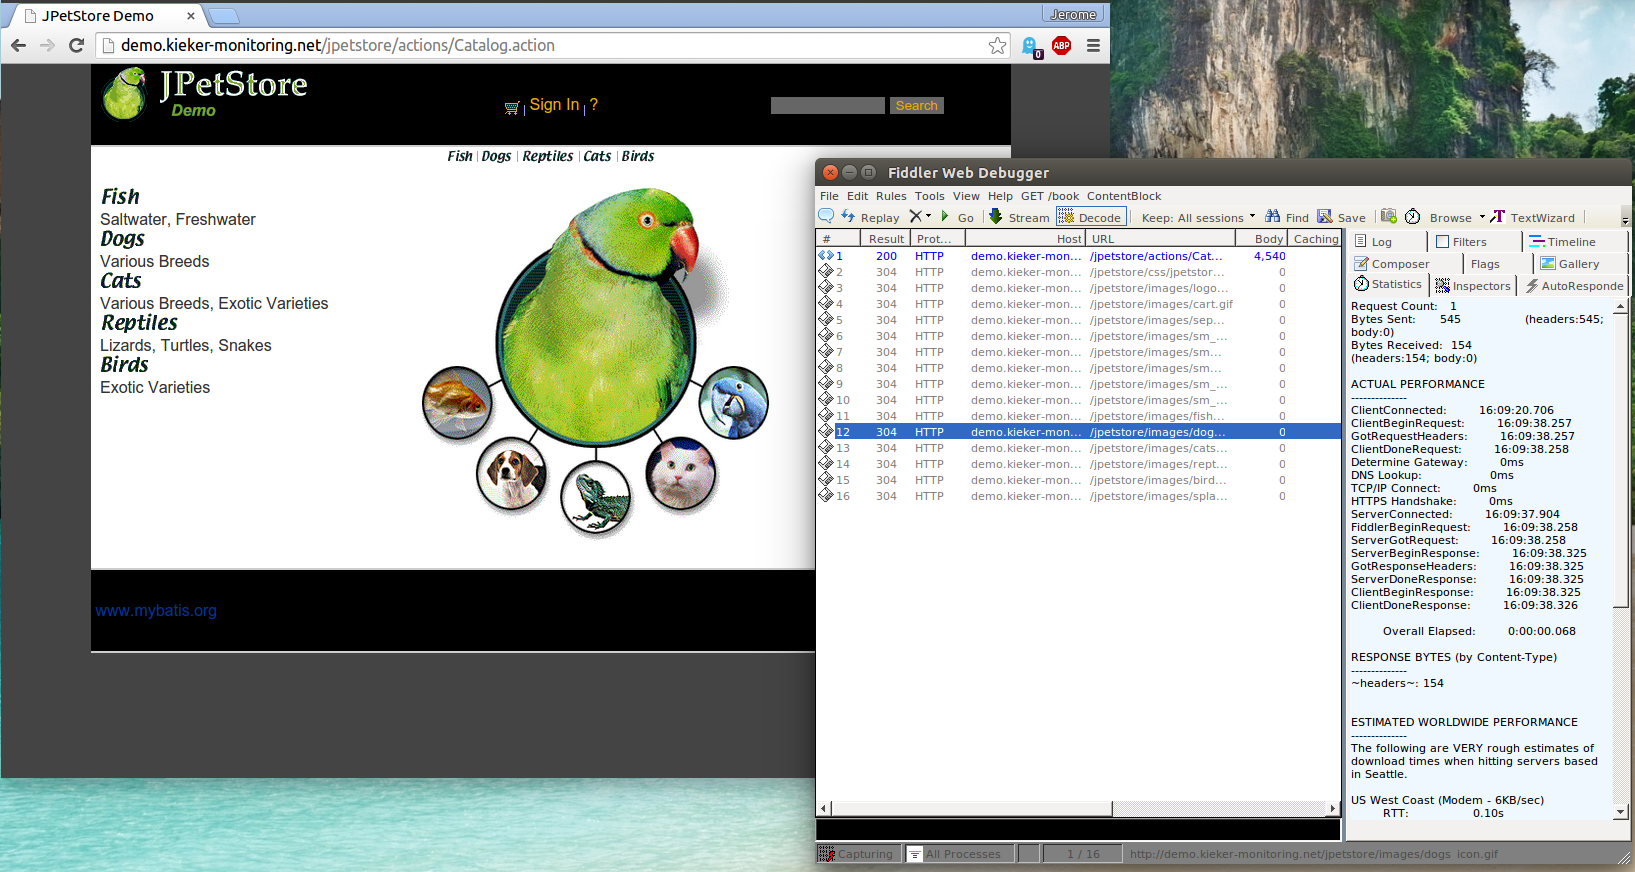
When you need to debug an HTTP script which fails to run properly, there is another option: Fiddler Proxy. Fiddler is a free web debugging proxy: you can record any HTTP traffic between your browser and the internet.

How can we use Fiddler to debug a JMeter Script? By setting Fiddler proxy on HTTP Requests. By default, Fiddler runs on hostname localhost with port 8888.
The easiest way to configure JMeter to use Fiddler's proxy is through command-line: JMETER_HOME/bin/jmeter -H 127.0.0.1 -P 8888. That way, any executed HTTP Request will go through the proxy. You will see the requests sent by JMeter within Fiddler.
This is useful when you suspect what you see in JMeter is not what is being sent. It can happen when there is a Bug in JMeter.
Final Words
As we have seen, there are many different debugging strategies. Choosing the right one really depends on the issue you are facing:
- View Results Tree: works best when you need to test variable extractors, search for dynamic values within responses,
- Debug Sampler: useful when you need to see variable values during the test run,
- JMeter Logs: when your script is failing for an unknown reason, logs may help to find why JMeter is not executing properly, (especially when facing Out Of Memory)
- Dummy Sampler: best when you need to simulate a request/response and run pre or post processors against them. Especially useful when the application responses are constantly changing,
- JVM Debugging and Fiddler Proxy Debugging: experience some weird JMeter behavior? You may have encountered a JMeter Bug. In that case, you may need to debug JMeter step-by-step to find what's going wrong.
And you, how do you debug your JMeter Scripts?