
Best Tools for the seasoned JMeter Tester
As a professional JMeter tester, i'm sure you've always dreamt about knowing what other seasoned JMeter QA tools use. The following list describes the most interesting tools to go along with JMeter.
Fiddler
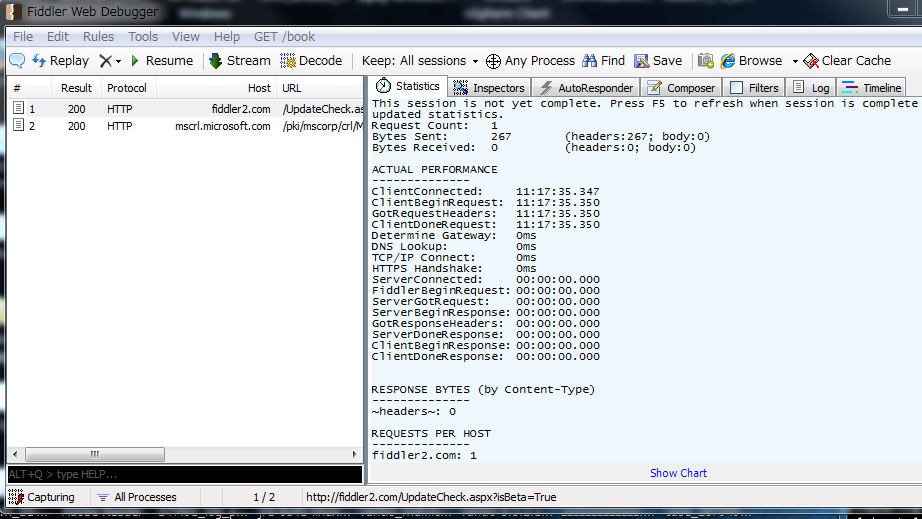
Telerik Fiddler is a free web debugging tool which logs all HTTP(S) traffic between your computer and the Internet. Inspect traffic, set breakpoints, and fiddle with http requests.
Fiddler is really useful to record the http requests between your browser and the remote HTTP servers. It can also be used to debug http calls made by JMeter, by configuring JMeter to use Fiddler as a proxy.
Fiddler can also export the recorded HTTP requests in various formats include HAR files. Thanks to Fiddlers auto-generated SSL Certificate, once you have trusted the Fiddler CA Root Certificate, recording SSL encrypted website becomes a breeze.
Charles Proxy
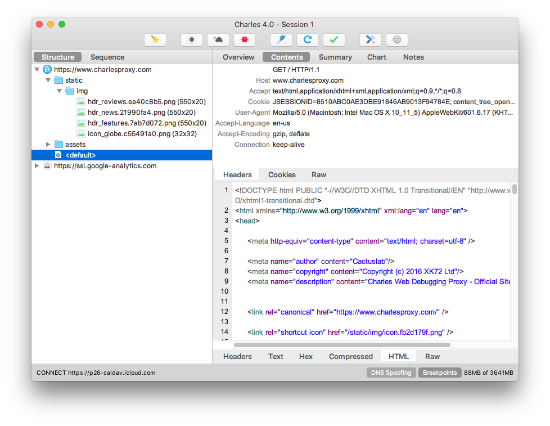
Charles is an HTTP proxy / HTTP monitor / Reverse Proxy that enables a developer to view all of the HTTP and SSL / HTTPS traffic between their machine and the Internet. This includes requests, responses and the HTTP headers (which contain the cookies and caching information).
Charles proxy is a shareware proxy which can be used like Fiddler. Charles Proxy records in various formats like HAR files.
Wireshark
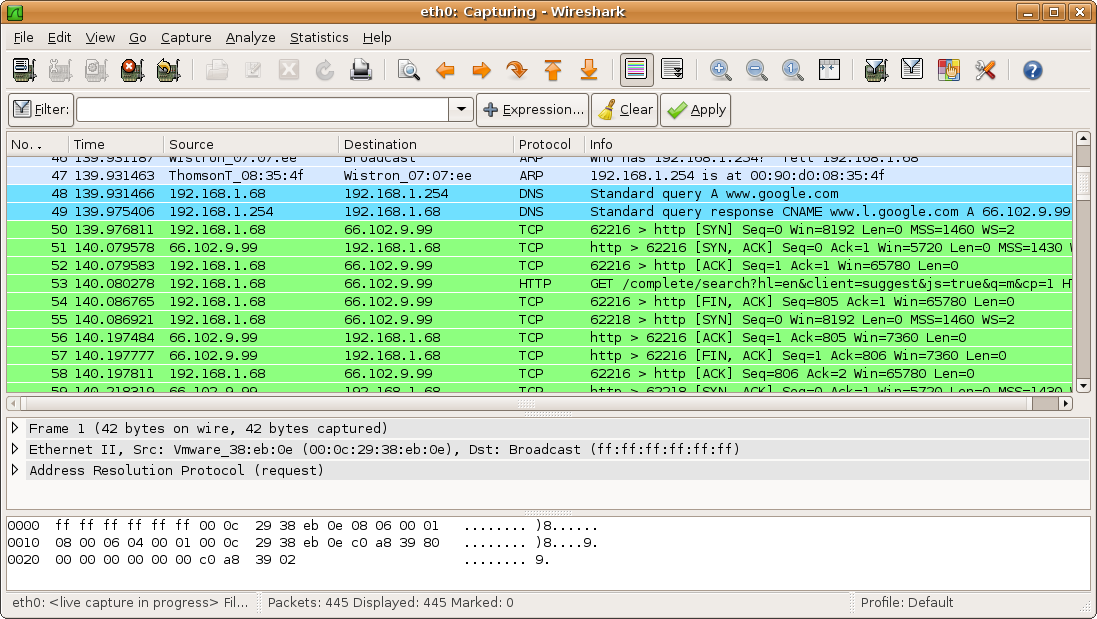
WireShark is a network packet inspection utility. This tool can save your life when it comes to analyze what's going wrong at the networking level. WireShark is mostly used when something goes wrong on the network side like an SSL handshake for example.
This tool is really for advanced users only. But it pays off to learn how to use it. It can provide insightful information about the network packets transiting between your browser and the remote server.
JMeter Plugins
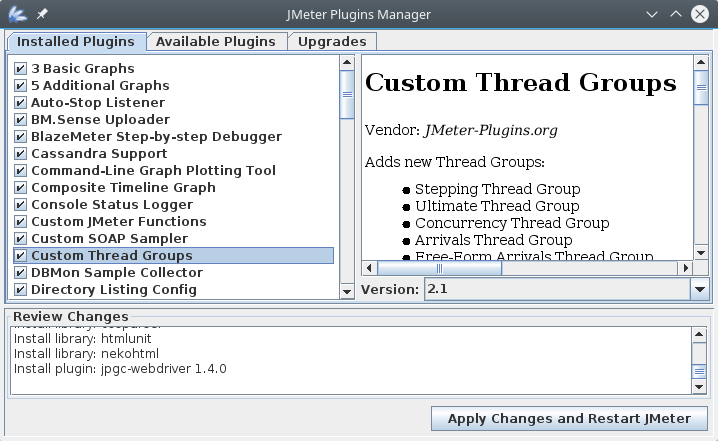
JMeter Plugins allow you to extend JMeter capabilities way beyond your needs. There are many plugins from custom thread groups with advanced load policies to server-side monitoring.
Plugins are pretty easy to install thanks to the plugins manager. Have special load testing need? First check if there is an already existing plugin for your needs before extending JMeter by your own.
Sublime Text
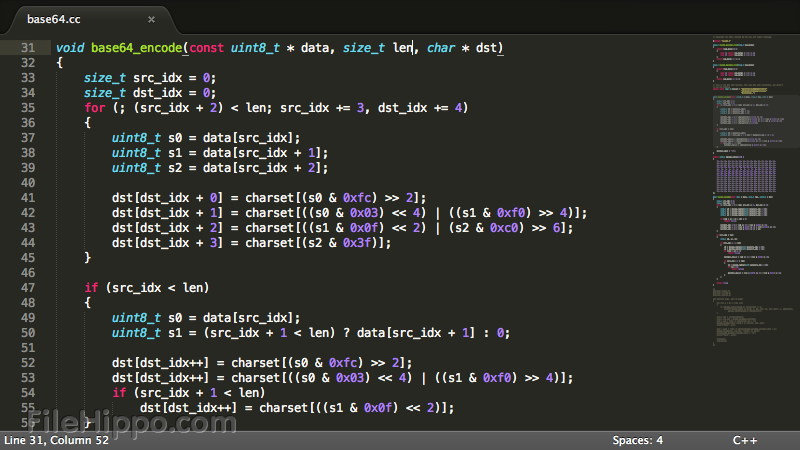
Sublime Text is a sophisticated text editor for code, markup and prose. You'll love the slick user interface, extraordinary features and amazing performance.
You can opened very large files without putting your machine on its knees. This editor is insanely great for this job.
Grafana + InfluxDB
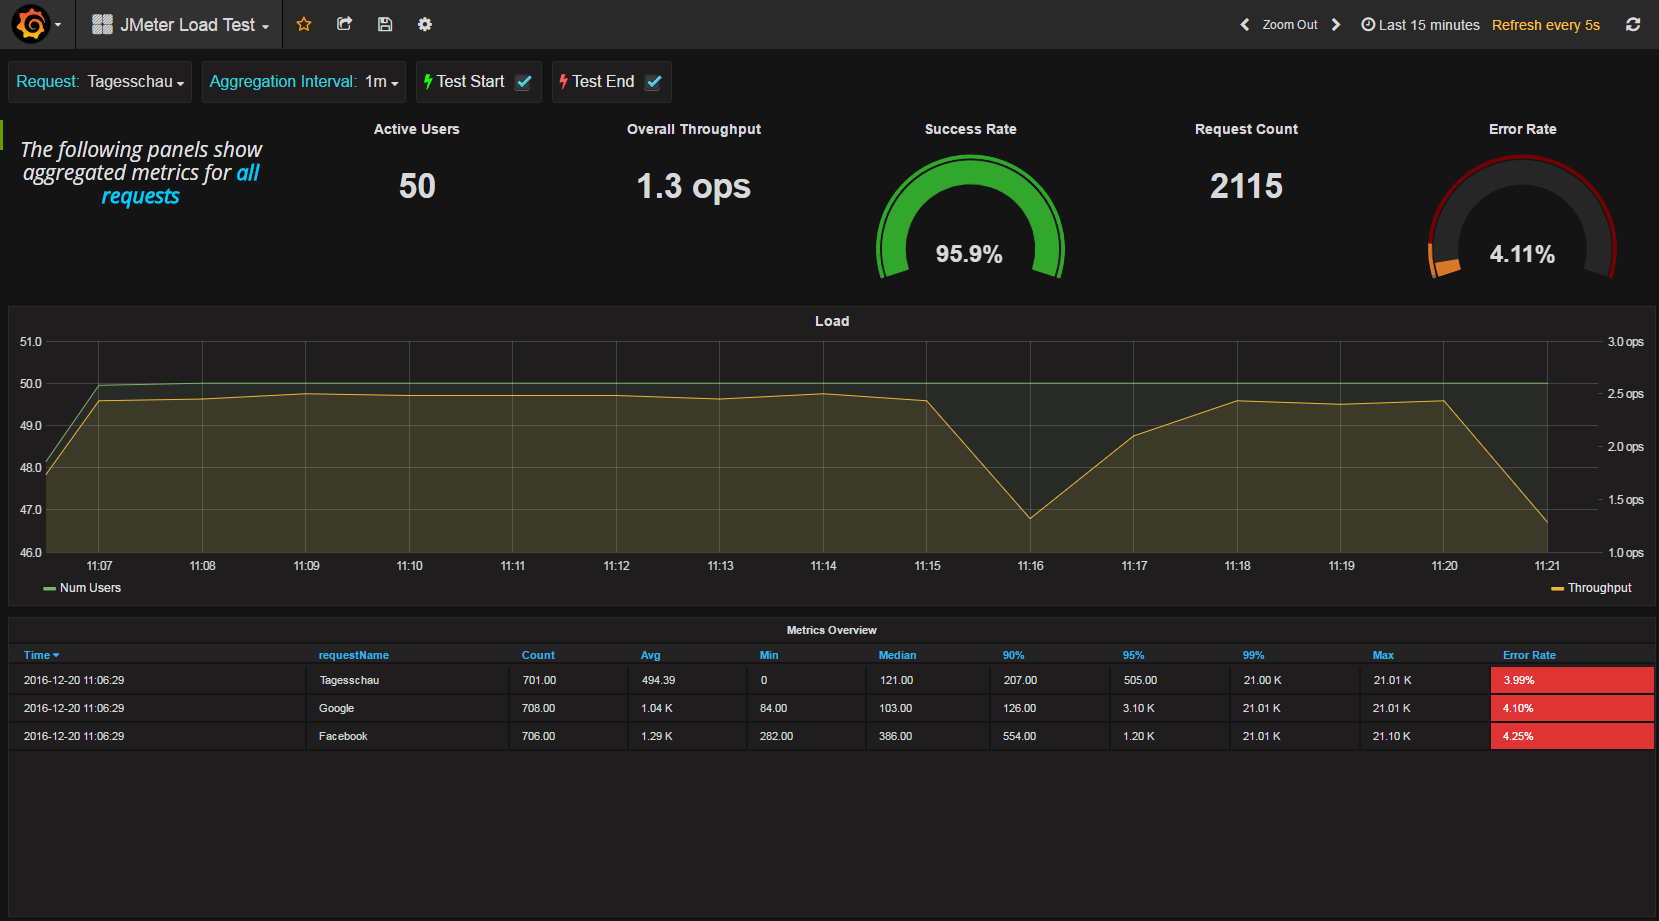
Grafana is an open-source software for time-series data analytics. Combined with InfluxData (previously known as InfluxDB), it can be used to watch and analyze JMeter results live during a load test.
It's truly a must have to setup this combo on your machine to always have a powerful tool to analyze results up your sleeve. Forget about the built-in JMeter charts, reports and results. Analyzing JMeter JTL results files using Excel becomes useless.
For more information, read the tutorial on JMeter Real-Time Results.
Web Browser Developer Console
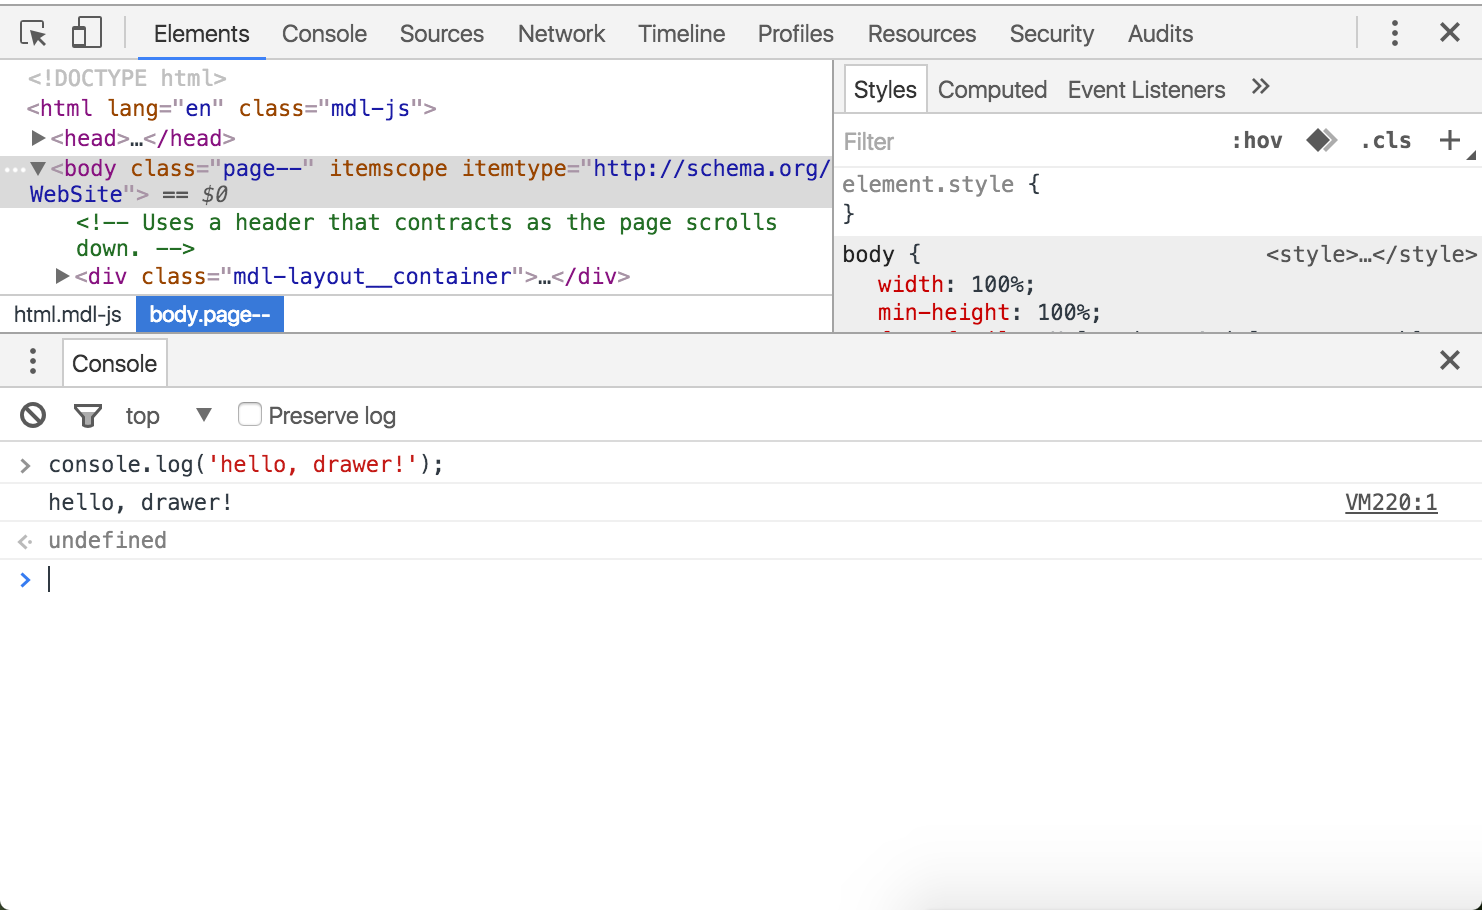
Both Chrome and Firefox have a built-in web debugging console which allow to easily view and capture http requests, Javascript errors and more.
You can even export the recorded http requests and responses as HAR using these consoles. Prefer Firefox over Chrome as the first keeps the recorded requests and responses within the exported HAR file.
Postman
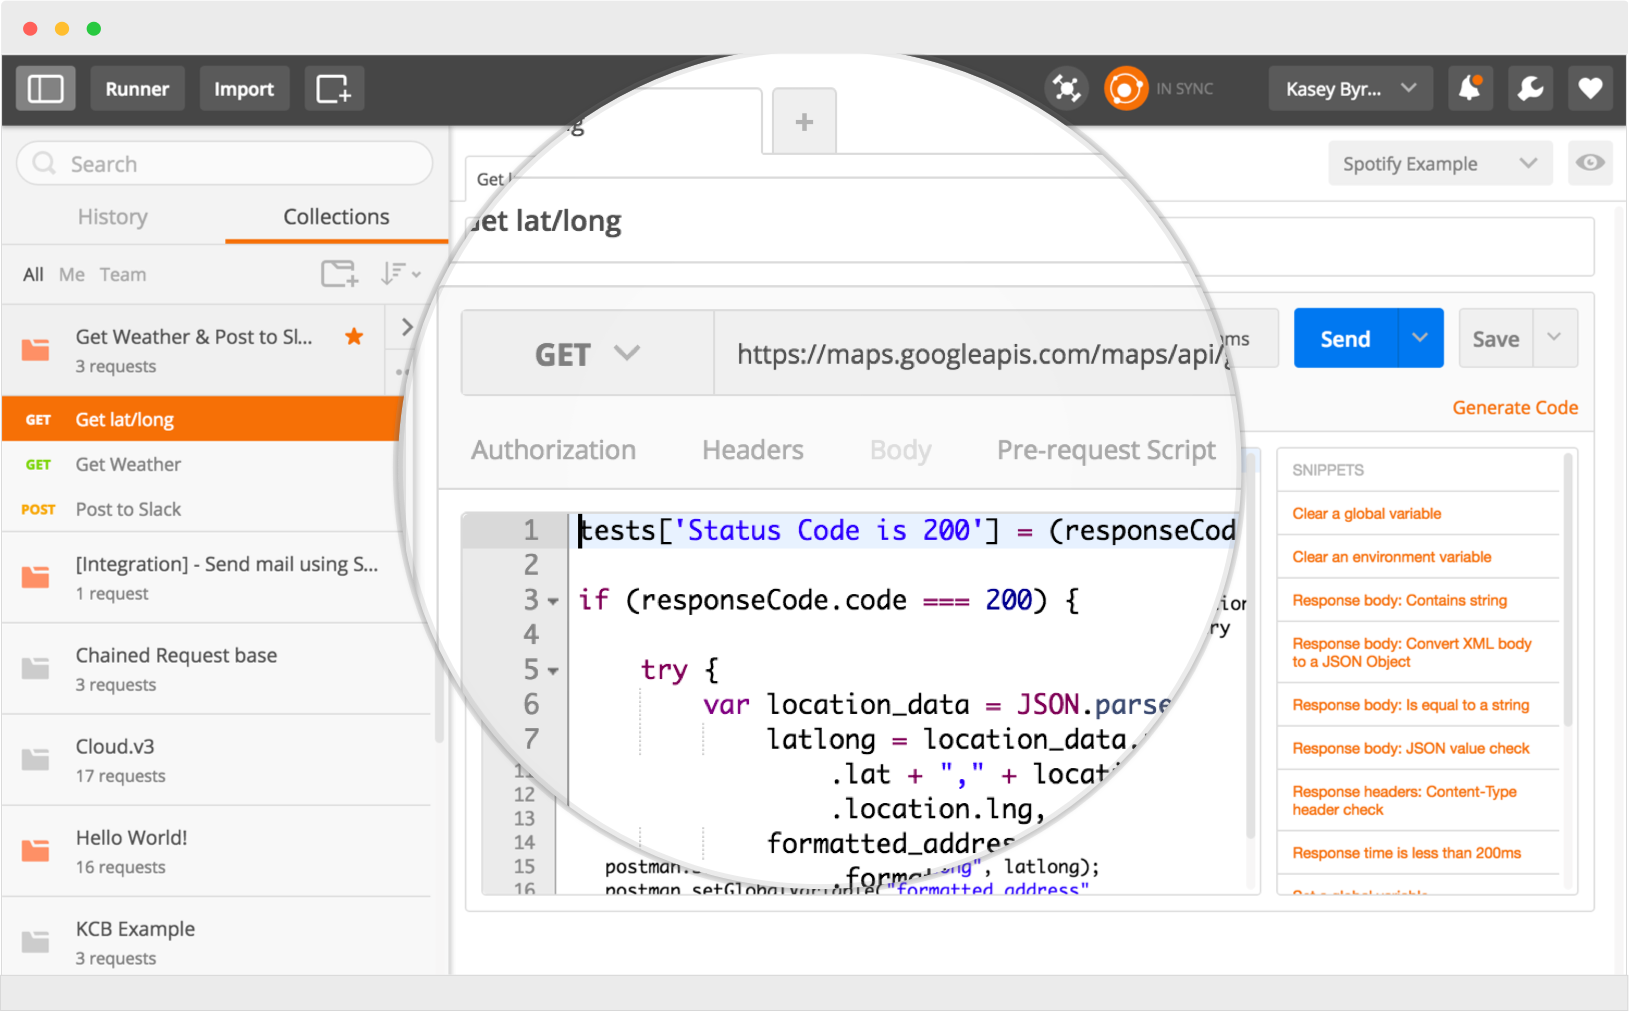
Postman is a great API Testing tool which allows to forge API calls by hand. It can be useful to test HTTP calls outside JMeter for debugging purpose.
JMeter Communities
Need some help? There are many JMeter experts out there who can help you if you get stuck. You can find them on:
