
Dynatrace integration with JMeter
Dynatrace is a cloud monitoring platform and is used by many organisations to measure the performance of their production systems and to set thresholds against which performance tolerance are measured.
During testing Dynatrace can be used to monitor how the application under test responds during your performance tests as well as providing the capability to drill down into performance issues you may need to investigate.
This is not a blog post on Dynatrace and how it works as that would consume the whole post, this is a post on how you can get your performance tests writing to Dynatrace and some simple ways to monitor the output of these tests.
Once you can see the results of your tests in Dynatrace you can then investigate what use you can make of the data using the Dynatrace documentation.
Custom Headers Overview
According to the Dynatrace documentation there are 6 key/value pairs you can use in your header and in order to ensure you can isolate a particular test, service or application it is always useful to add them all to your performance tests.
Let’s take a look at the recommended values which are all configured under a header called x-dynatrace-test.
The key/value pairs are below along with our recommendation on identifying which values from our JMeter test are sent.
| KEY | VALUE |
|---|---|
| VU | Virtual User Id of the user that send the request, we could use the load injector name and the thread number to uniquely identify the user sending the requests. |
| SI | Source Id defining the product that sent the request, we would use JMeter for this value. |
| TSN | Test Step Name is a logical step within your test which is effectively a sampler. You can pick which samplers you send a custom header for or send for each sampler. |
| LSN | Load Script Name is the name of the test which equates best to the Thread Group that manages your samplers. |
| LTN | Load Test Name is a way of uniquely identifying a test execution, using a date/time value here will mark at it as unique. |
| PC | Page Context provide a way of sending more information about the content of the page or service we are requesting. |
What you send is entirely up to you and you do not have to send all the key/value pairs just some but in order to make the monitoring as easy as possible we would suggest sending all the above.
Using these value allows you to group tests in Dynatrace by any of the values you send in which gives you the ability to determine how you want to compartmentalise your performance data when reporting against a test.
Build a test with a header
Now we have looked at what we would send let’s look at how we create our header and to do this we are going to build a simple test. You can download the example test plan here.

Our test has 2 samplers each with a header that we have called dynatrace-header-details.
The samplers are sending a request to an API in our application under test and the dynatrace-header-details looks like this.

The name field is set to x-dynatrace-test as per the Dynatrace documentation we looked at in the Custom Header Overview section.
Let’s take a closer look at the Value field of the header.
VU=${__machineName()} - ${__threadNum};SI=JMeter;TSN=${__samplerName()};LSN=${__threadGroupName()};LTN=${__time(YMDHMS,)};RC=${__P(service-name)};
Each of the key/value pair is separated with a semicolon and we will look at each pair individually.
VU=${__machineName()} - ${__threadNum};
In order to give us a unique Virtual User Id we are going to use the machine name and the thread number variables.
This will ensure that each thread can be identified if you want to analyse your data at an individual user level.
SI=JMeter;
For the Source Id we have a hardcoded value which indicates the source of the test data, you can use whatever value works for you.
TSN=${__samplerName()};
For the Test Step Name it makes sense to use the sampler name variable here.
LSN=${__threadGroupName()};
For the Load Script Name we are using the thread group name variable another good option is to use the test plan name variable as both of these give us a way to group all our sampler requests.
LTN=${__time(YMDHMS,)};
For the Load Test Name we are using a variable that gives us the current date and time, the benefits of doing this are to allow direct comparisons between tests which is possible in Dynatrace. A unique date field also gives you a clear visual indication of when the test was run.
RC=${__P(service-name)};
Our last attribute is a deviation from the documented recommendations in that we pass a parameter called RC which stands for Request Context and not PC as we are calling an API. If this was a HTTP Page Request, we would be using PC, but we want to be able to distinguish between an API call and a HTTP Page Call in our results.
We are using a parameter which we pass into the test to provide this information.
It is important to remember that these are our preferences as that's what works best for us in the way we want to categorise our reports, you should use whatever works for you in your own categorisation but using variables means you can use a common header in all your tests with no requirement to change between execution cycles.
When considering what to use think about how each of the key/value pairs will allow you to analyse your test results and group results together.
Setting up Request Attributes in Dynatrace
Now we have our test ready to go we need to set up Dynatrace to ensure they instrument requests containing these headers.
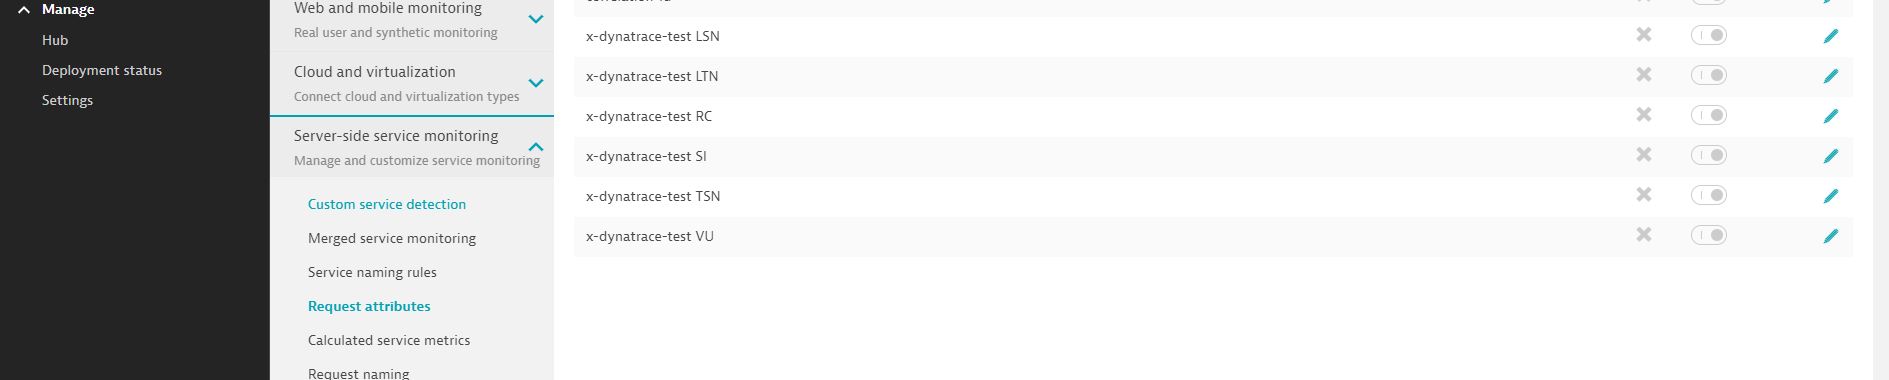
Once you have logged into Dynatrace you need to select.
Manage -> Settings -> Server-side service monitoring
Under here there is an option called
Request attributes
 Dynatrace configuration request attributes
It is in here you need to configure Dynatrace to monitor requests that contain your header values.
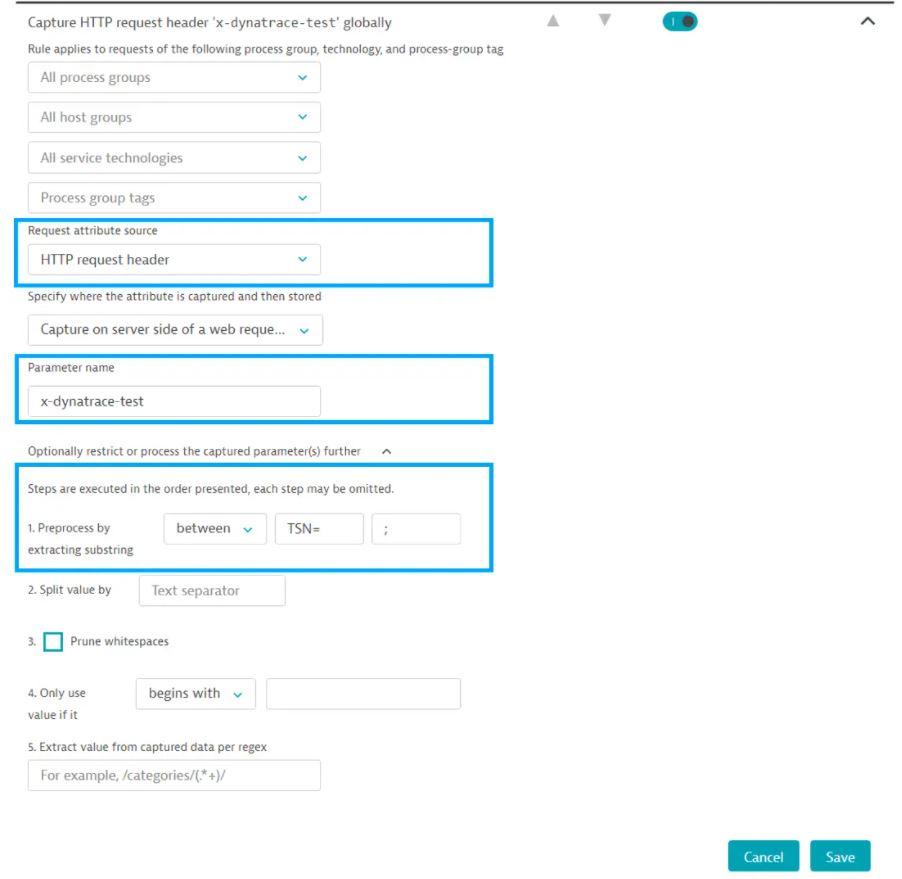
Let’s look at one of the examples to see how it is set up, this is taken from the Dynatrace documentation.
 Dynatrace create request attributes
The items in the blue bound boxes are important, in the first we specify that the source is from the request header, in the second we provide the parameter name which matches the name from our HTTP Header Manager in our JMeter test and finally you specify the boundaries for the values you set up in the HTTP Header Manager.
If we remember the value we provide
VU=${__machineName()} - ${__threadNum};SI=JMeter;TSN=${__samplerName()};LSN=${__threadGroupName()};LTN=${__time(YMDHMS,)};RC=${__P(service-name)};
We can see in the Dynatrace example that we are extracting between TSN= and ; so effectively extracting the information in ${__samplerName()}.
We create a request attribute for each of the 6 key/value pairs.
Viewing results in Dynatrace
So, we have created our header and added to our test and we have configured Dynatrace to capture the data.
Let’s assume we run our test under load conditions, and we want to see the results.
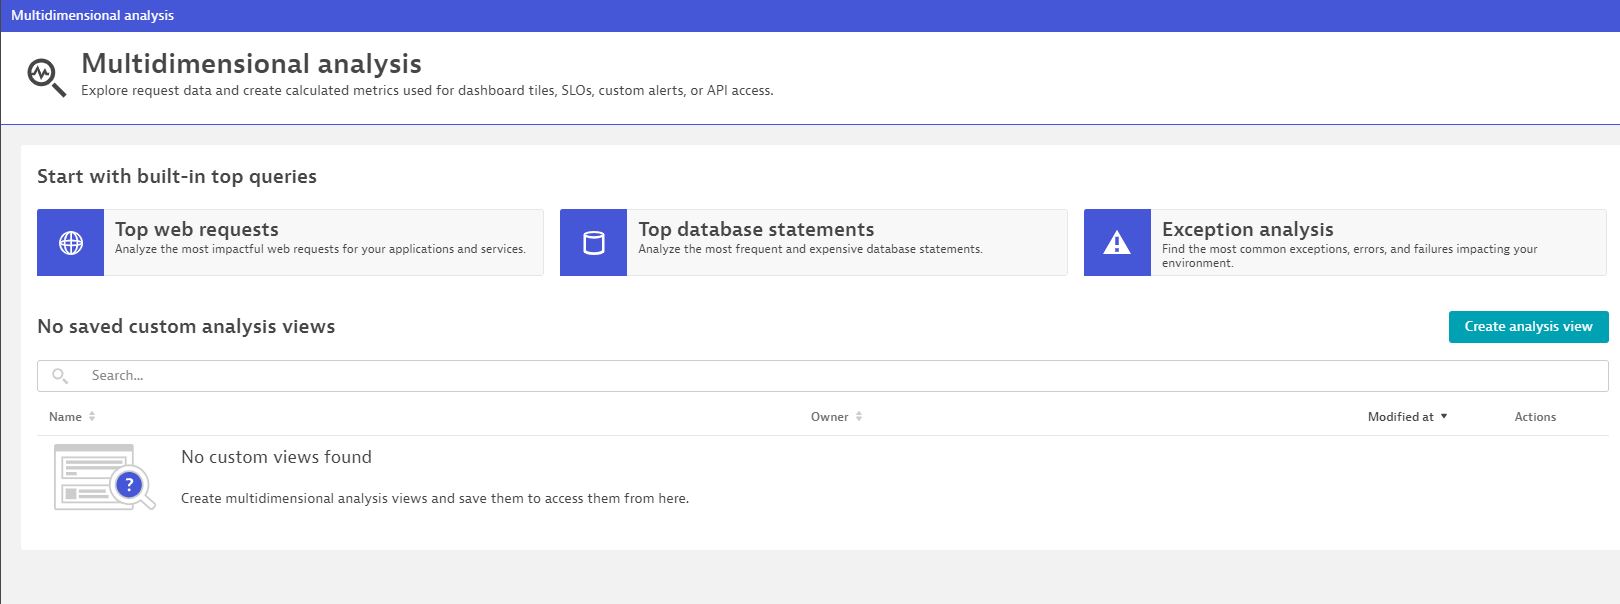
Log onto Dynatrace and select Multidimensional Analysis.
 Dynatrace multi-dimensional analysis
Select Top web requests and you will then be able to configure your view.
 Dynatrace multi-dimensional analysis fields
Before we look at these configuration values, we should set the time range for your tests.
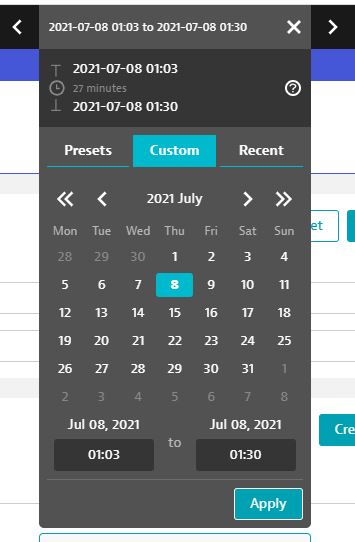 Dynatrace set time range
Make sure you only select the duration of your test to avoid any unwanted data.
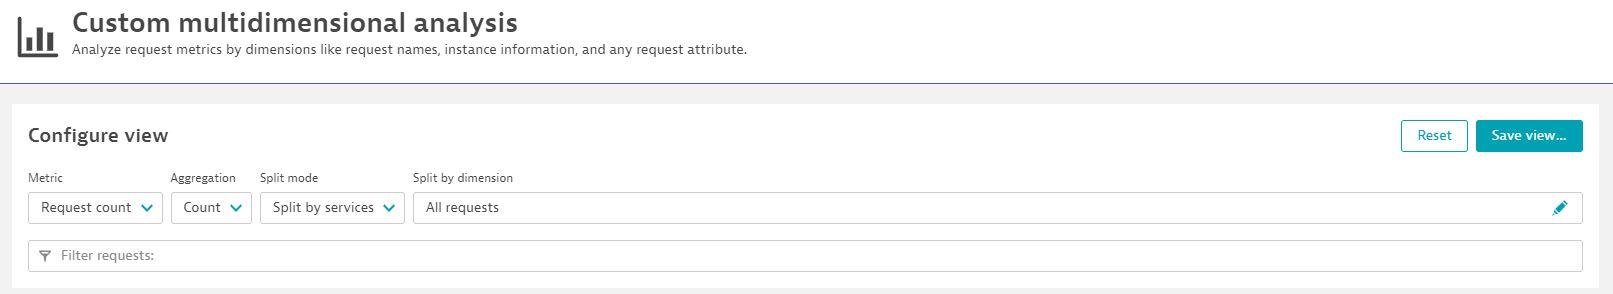
The first field to configure is the Metric
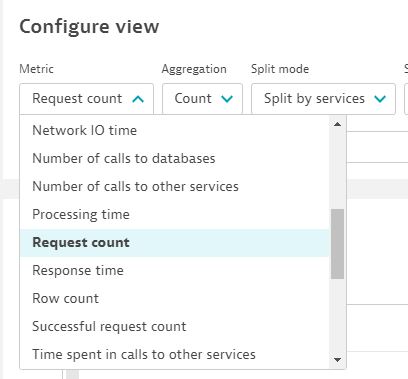 Configure view metric
There are many to choose from but for the purposes of this post we will select Response time.
The next field is Aggregation.
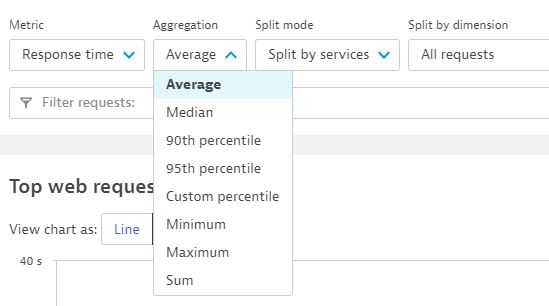 Configure view aggregation
We will select Average and we will leave Split Mode with the Split by services value.
If we now look at Split by dimension field, we can see our Request Attributes that we configured in Dynatrace and sent as part of our JMeter HTTP Header Manager.
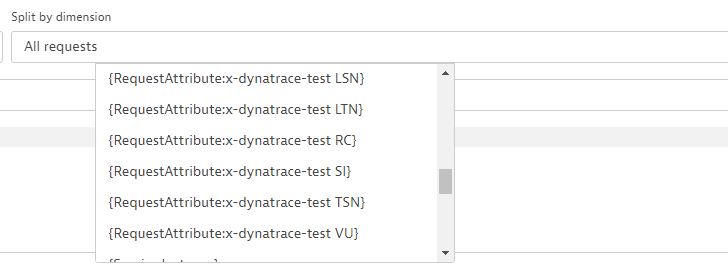 Configure view split by dimension
We will select {RequestAttribute:x-dynatrace-test LSN}.
Finally, in the Filter requests field we need to select Request attribute.
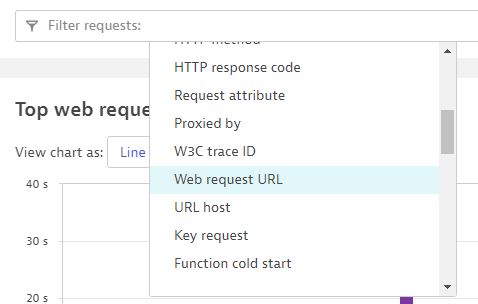 Configure view request attribute
Once selected a further drop down list is displayed.
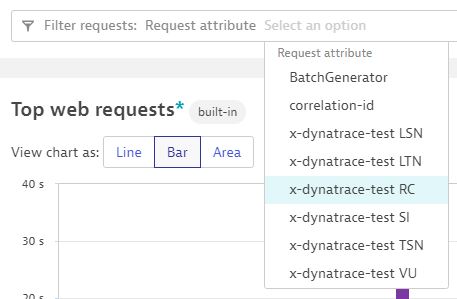 Configure view select an option
If we now select the x-dynatrace-test LSN value as this matches the value we selected in the Filter requests field, it is important that whatever you select in the first part of the filter you also select in the second part.
Once selected you will be prompted to select one of the options below.
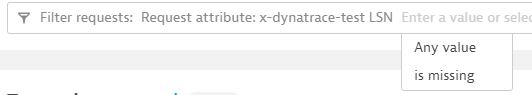 Configure view value
This is essentially server requests that contain the LSN Header of those without depending on what you are analysing, we will select Any value.
Your view will now be displayed.
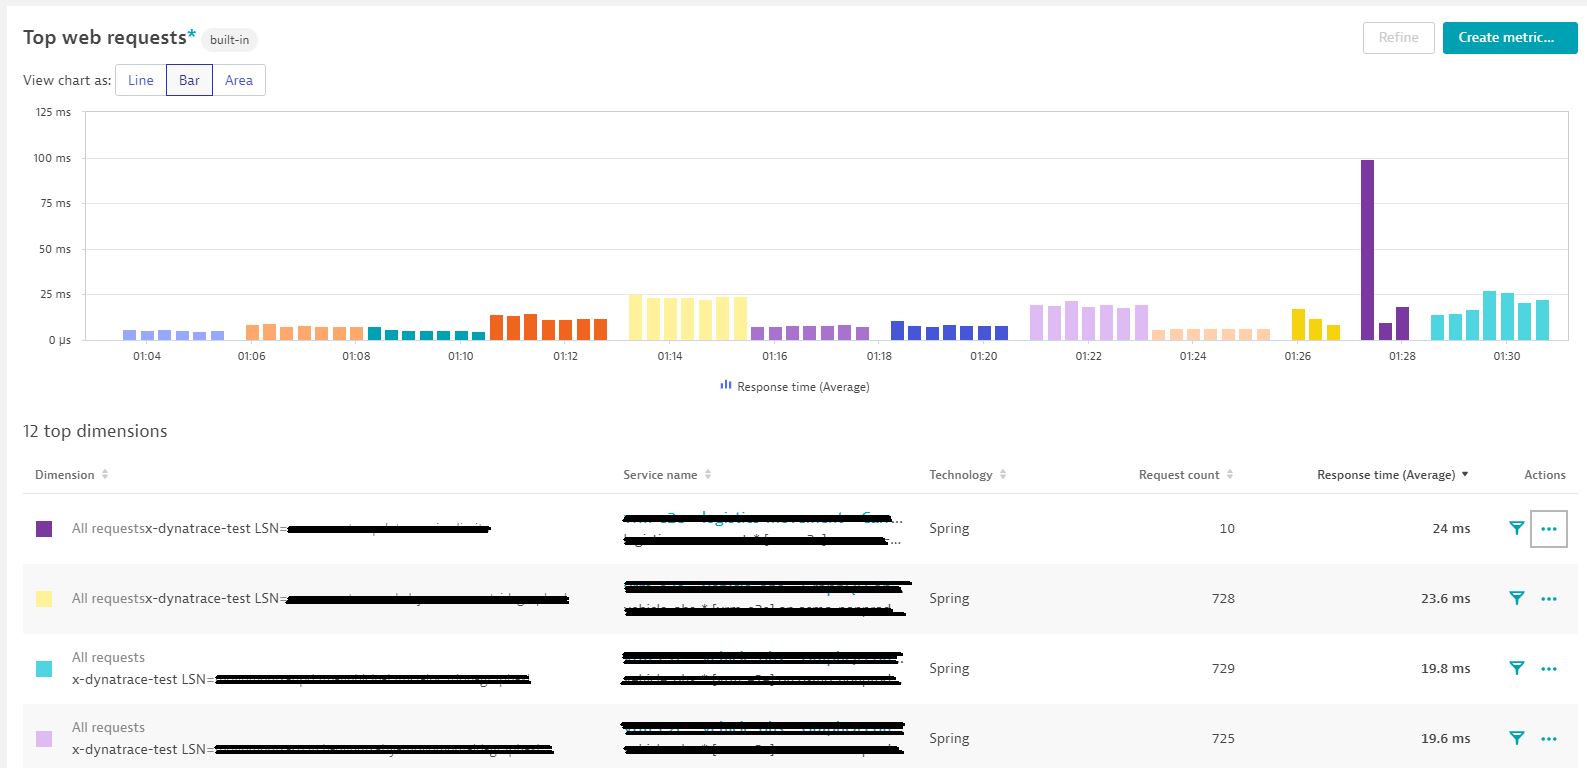 Dynatrace multidimensional view
This is a very basic example and its point is to prove how you can start to analyse your JMeter test results in Dynatrace.
As we have seen you can select many options from the Configure View fields and in addition to this there is an Actions option in your results view:
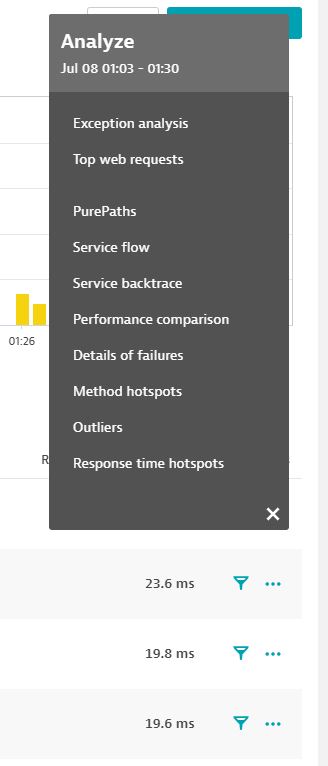 Configure view actions option
This allows you to analyse your performance test results in many ways and is worth exploring more.
Creating Dashboards in Dynatrace
Before we finish this post, it is worth looking at how we can create a dashboard that starts in the view we are currently in.
If we select the Create Metric button:
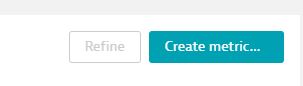 Create metrics button
We are presented with the Create Metric dialog:
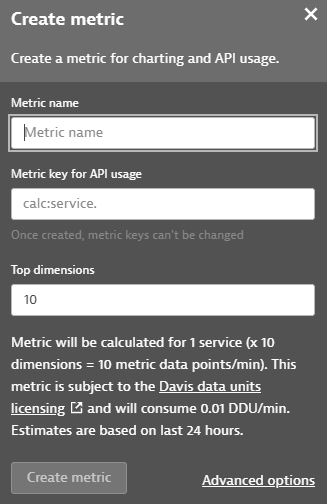 Create metrics dialog
We give the metric a name and the metric key is automatically created, the number of dimensions you set depends on how many you want to display.
We will call our metric perf-test-metric.
Once you press create you are presented with another dialog that allows you to copy your unique Metric Key.
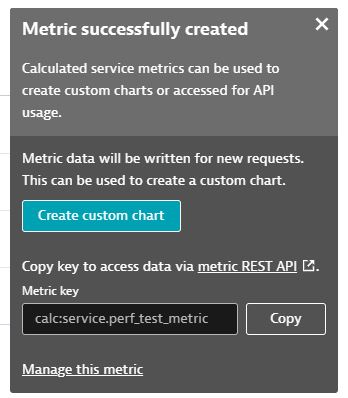 Create metrics key
Select Copy and make sure you keep this value safe.
You can dismiss the dialog now.
If we now select Dashboards from the left-hand navigation bar and select Create Dashboard:
 Create dashboard
We are presented with a dialog to give the dashboard a name:
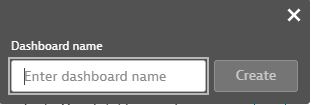 Create dashboard name
We will call ours perf-test-metric-demo:
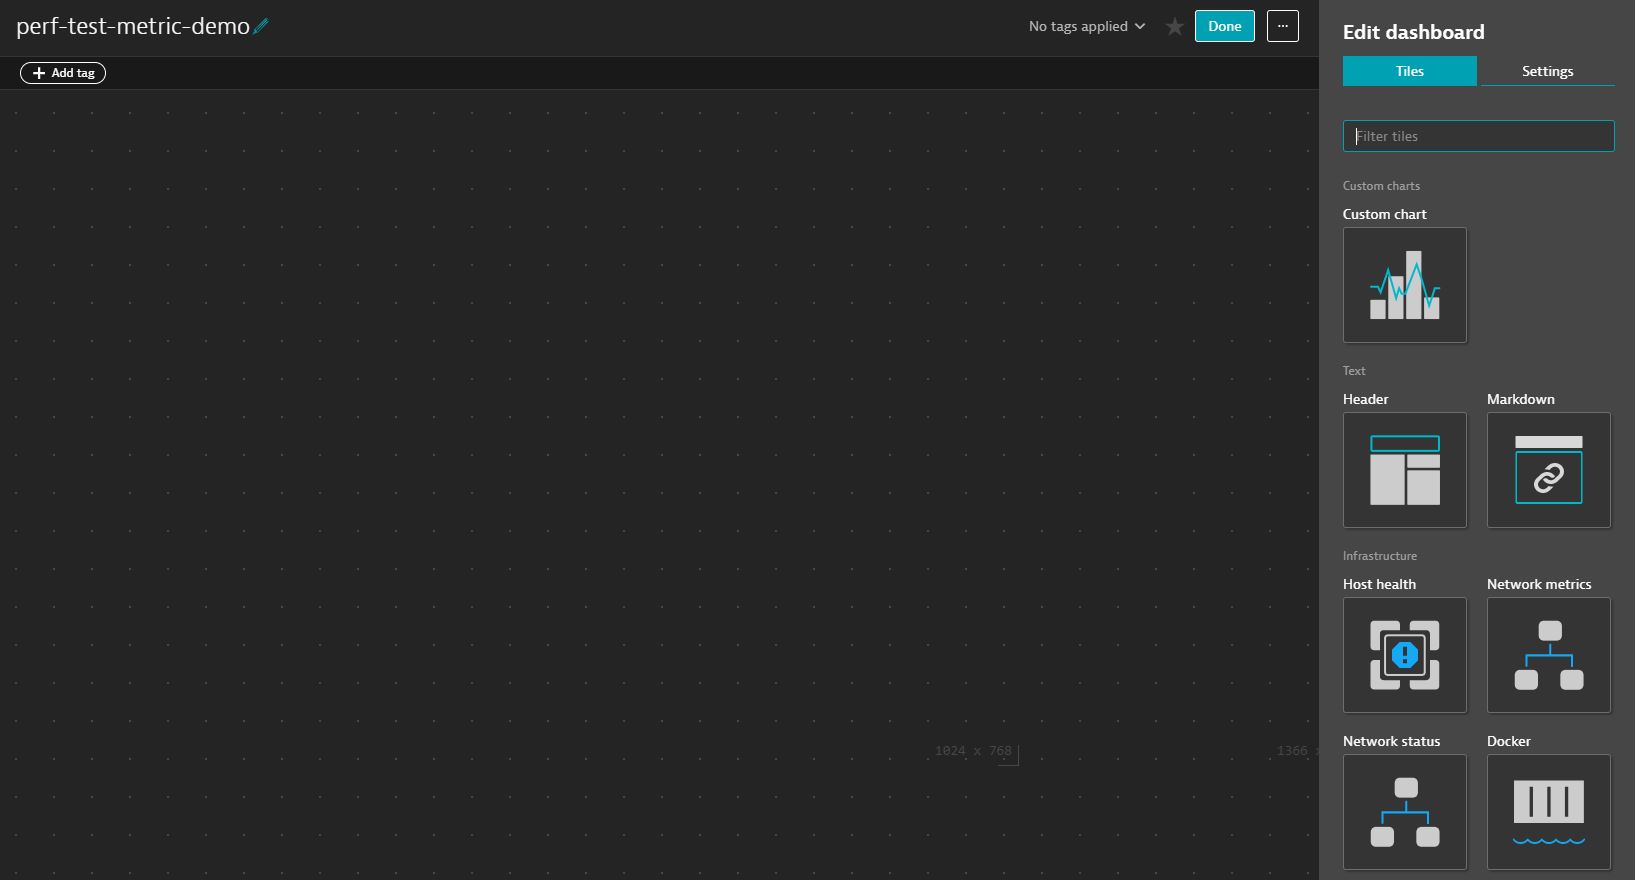 Dashboard blank
There are many items in the right-hand pane you can add but for the purposes of this post we will select Custom Chart and drag this onto our dashboard:
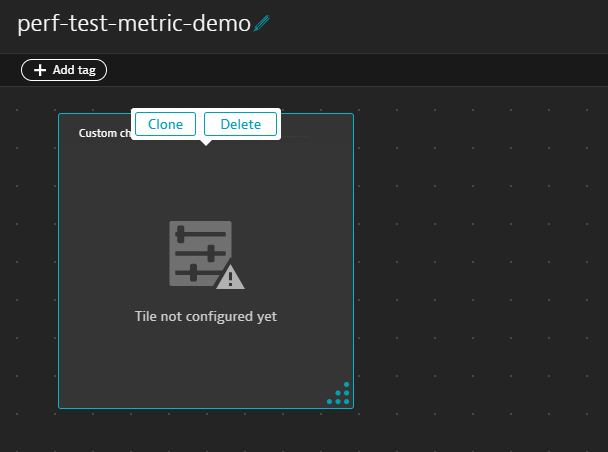 Dashboard with chart
In the right-hand pane we select Configure custom chart and we can then select a metric to add:
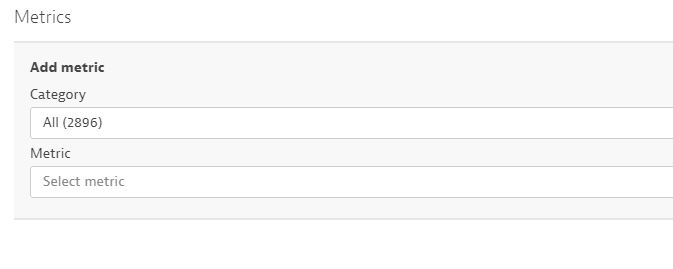 Add metric
If we paste our Metric Key into the Metric field that we copied earlier, we can select our Metric and we are taken to a configuration page:
 Configure metric
Set your chart up how you want, you will need to select Dimension to split by to Dimension if you want to see each sampler as a separate entry:
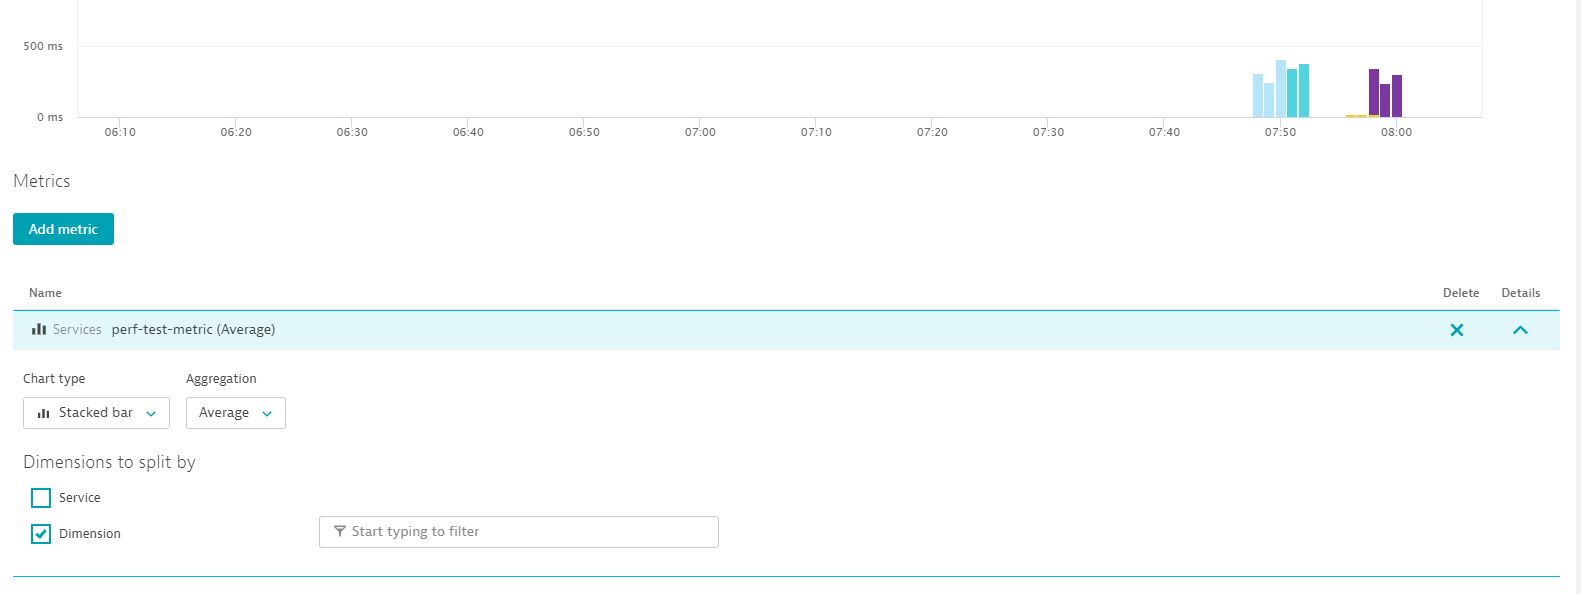 Split by dimension
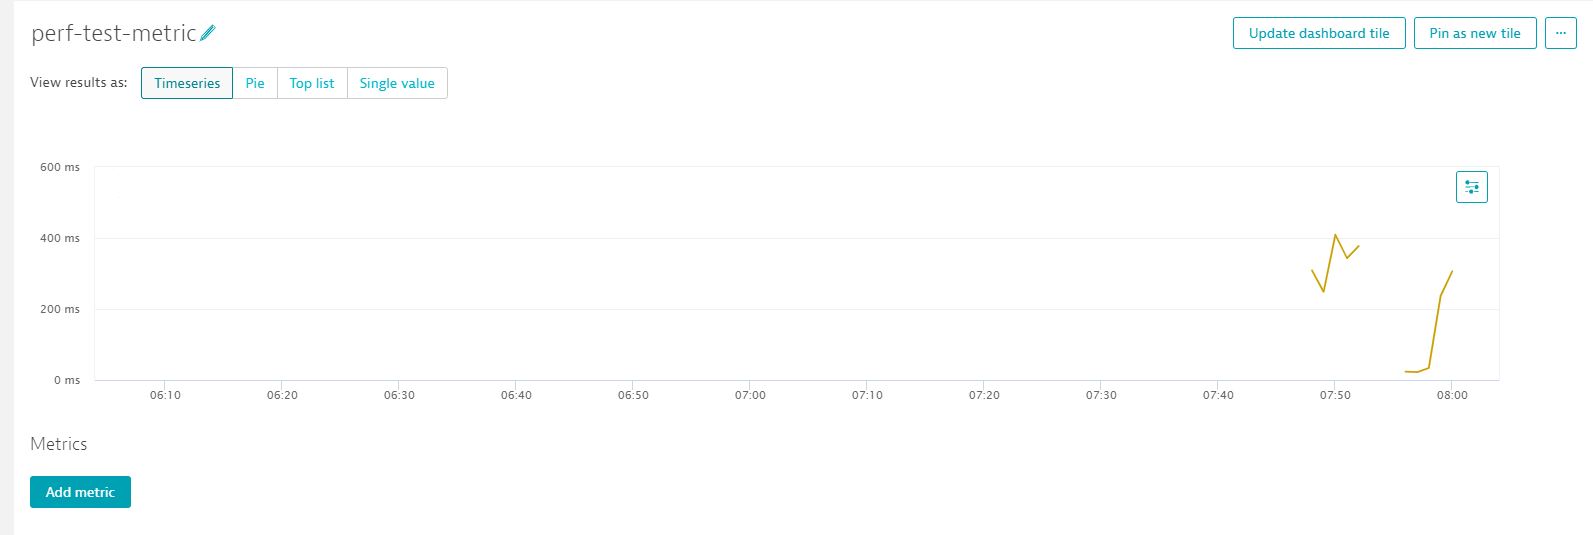
If you select the update dashboard tile you are taken back to your dashboard where you will see your chart:
 Dashboard with populated chart
Click Done on the right-hand pane and Done at the top of the Dashboard and you have created a dashboard that reports on metrics output by your performance tests.
Conclusion
OctoPerf does a lot of the hard work for you in terms of creating a header that contains the Dynatrace data for your tests, how their SaaS solution provides the integration can be found on the documentation.
There is also a JMeter Dynatrace plugin that allows you build your integration with you Dynatrace instance in the JMeter UI and it can be found here, this can also be used from inside OctoPerf as an External Live Reporting.
What we have discussed is just a simple example of how complex you can create your dashboards and metrics. Dynatrace is extremely powerful and can provide all the data you need to determine how your application is performing and hopefully this post will give you enough information to get started.