
Elasticsearch: Optimization Guide
You may already have setup an Elasticsearch cluster but you're struggling with numerous issues:
- Indexing is slow: somehow you're not getting the ingestion performance you expected,
- Out of Memory: your nodes are regularly hitting the Java Xmx mark and you don't know why,
- all CPU cores are not used: somehow you are struggling to vertically scale the database to take advantage of multiple CPU cores,
- and much more.
After spending several years maintaining, upgrading and tweaking Elasticsearch, we've learnt a lot of things along the way. We feel like the tips and tricks to optimize Elasticsearch provided here can be useful to others.
With tools like Kubernetes or Rancher, it's becoming much easier to exploit physical hardware without the need of an entire IT department. The optimizing guide below intends to provide a solid foundation for people willing to setup Elasticsearch at scale in production. Let's start!
Server Hardware
While Elasticsearch provides an excellent guide on which Hardware to use, we feel like things could be detailed a bit more for people not used to select computer hardware by themselves.
What is Hardware
Computer Hardware designates the components which are part of the servers you use to run Elasticsearch. Here are a few components we'll discuss closely:
- CPU: the CPU provides the computation power necessary to run all the operations. Nowadays, CPUs are multi-core which means they are multiple CPUs in one single package. Intel go even further by providing Hyper-Threading,
- RAM: RAM stores data and programs currently being used. It's common nowadays to have servers with
32 or 64GB of RAM. If the computer is shutdown, all the data is flushed, - Disk: Hard Disk Drive or Solid State Drive are used to store data persistently.
As hardware is the foundation of your cluster, Wisely selecting on what you run your cluster is critical.
Virtualization Vs Bare-Metal

Long story short, we decided to use Bare-Metal Servers. But, at first (several years ago), our infrastructure used to run on Amazon EC2.
Virtualization took off 10 years ago. It was fantastic: you could run several operating systems on a single machine! The hardware resources are shared between all the tenants.
Amazon EC2 is virtual machines on-demand. While this provides great flexibility (like autoscaling, autoprovisioning etc), there is a major drawback: performances are horrible. That's why Github is running on bare-metal servers.
Why Physical Servers
We're not fans of virtualization for several reasons:
- Shared Hardware: the server running your virtual machine gives you a fraction of the hardware resources available. Should the other virtual machines heavily use the hardware, your own VM may be affected,
- Over-Provisioning: it's well known that cloud providers over-provision their servers to run more VMs that the server is capable of delivering. Typically, it means if all VMs were using 100% of the allocated resources (like
CPU), the server would be overwhelmed, - Poor IO Performance: even when using Amazon EBS with Provisioned IOPS volumes, price can skyrocket while performance can be much lower than a regular consumer SSD,
- Vendor Lock-in: unless you're not willing to rely on Amazon's different services to make your life easier, you're now locked-in.
Whenever to run your servers on virtual machines or physical servers is often a personal choice. People comfortable with installing and managing Linux machines will prefer physical servers. People willing to leverage cloud provider services and not do everything on their own will likely choose virtual machines.
None of the choices is actually bad: it's just a matter of making the right trade-off.
Costs Comparison
Regarding costs, let's compare Amazon AWS with a bare-metal server from SoYouStart:
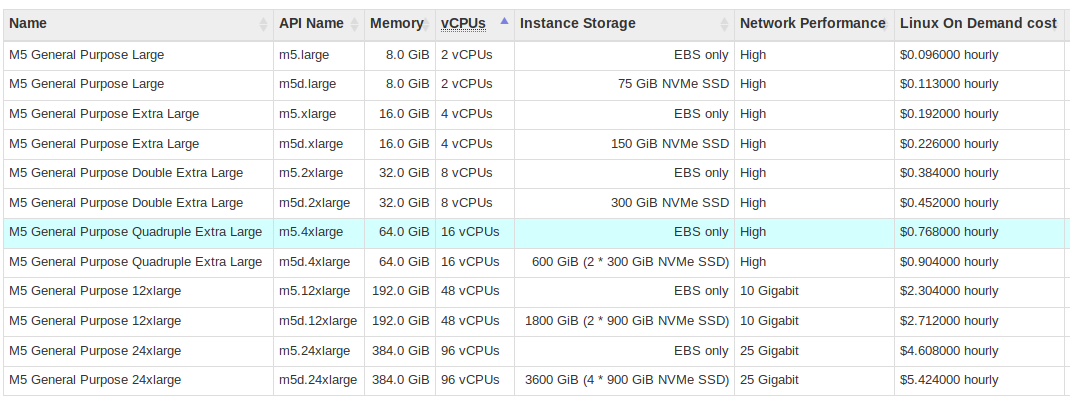
- Amazon EC2
m5.4xlarge: 16 vcpus, 64GB RAM, EBS only disk, 550$/month,
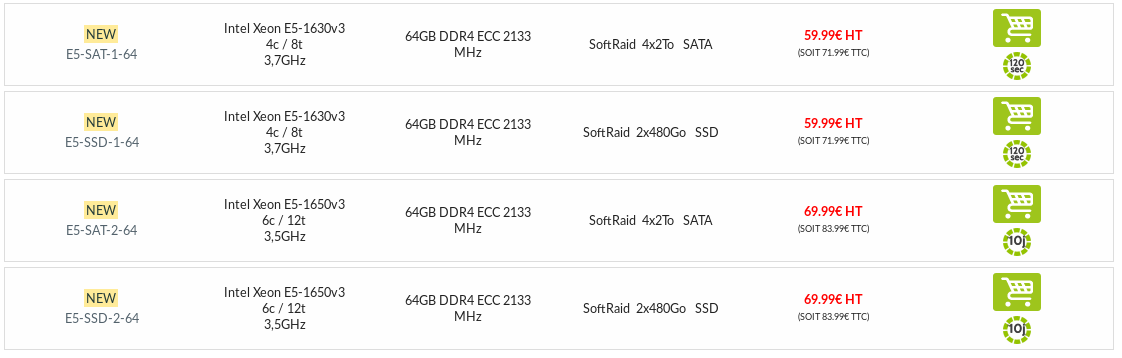
- SoYouStart (from OVH): 6 cores / 12 threads Xeon 1650v3, 64GB RAM, 2x 480GB SSD (Raid 1), 80$/month.
Bare-metal server is roughly 7x cheaper! How is this possible? And we've not even taken into account the cost of provisioned EBS disks to match the SSDs performance.
Amazon provides numerous services to rapidly configure, launch and scale virtual machines on their cloud. But, this comes at a huge expense. While all those things make your life easier (but not so much as you think), it dramatically increases your IT costs.
I already hear you saying: Isn't Bare-metal more difficult to manage?
Well, you have several drawbacks:
- No Scaling on-demand: Sometimes, you can wait several days to get a new machine. But, is it really an issue when machines are like
7xcheaper? No really if you overprovision your cluster slightly to match for increasing demand, - Setup: setup is a little more difficult since you need to install the operating system (through a Web UI), then setup an ssh user etc. But, anyone used to Ansible won't find it difficult,
- Hardware failures: We deal them very simply. Should a machine fail, we take it out of the cluster and order a new one. We don't mess up with benchmarks and testing tools to find the root cause, unless it can be repaired within hours. Our cluster is designed to be resilient to failures.
Let's see now how our m5.4xlarge (powered by Xeon Gold) processors performs.
Performance Comparison
Phoronix wrote an interesting performance comparison between bare-metal and EC2 Instances CPUs. Basically, our m5.4xlarge which costs 550$/month to run continuously, has a performance between the Ryzen 3 2200G and the Intel 8700K depending on the benchmark used.
The Ryzen 3 2200g is a low end 4 cores CPU with an integrated GPU, and costs around 100€. The Intel 8700K is a consumer enthusiast 6 cores CPU which costs around 300€.
Choosing between virtual machines and bare-metal servers is a matter of taste: either you need flexibility or performance. But you can't have both (unless you're rich enough). Let's see what hardware we recommend to run Elasticsearch.
Which CPU
")
At first, we were running on servers with Intel(R) Xeon(R) CPU E3-1245 v5 @ 3.50GHz. Xeon v5 are part of the Skylake family, 6th generation Intel core CPUs.
Those are 4 Cores / 8 Threads CPUs bursting at almost 4Ghz on Turbo Boost. It's a very good CPU which gave us satisfaction for several years.
As CPU with 6 or more cores are becoming readily available at cheap prices, we went for the Intel Xeon E5 1650v3. Available on the most expensive SoYouStart Essential server, it has 6 cores / 12 threads. This CPU is from the Haswell family, which is slightly older than Skylake ones.
Skylake is supposed to have a better IPC (Instructions Per Clock) than Haswell but in real life we haven't seen any major difference. So, I wouldn't stress you on buying servers with the newest CPU: it's not worth the premium.
Should I go for 16 or 32 cores CPUS?
Elasticsearch scales well horizontally (by adding new machines). While scaling vertically (more powerful hardware) can provide some benefits, usually the cost of those massive CPUs is so important the gain wouldn't be worthwhile.
One of the reason it's so interesting to use even old CPUs is they haven't evolved so much in terms of performance for the last 6 years. That advice would be foolish if we were in early 2000s.
Isn't 4 cores enough?
It can be! Still, if you can have 6 cores CPUs for an extra 10 bucks per month, it's probably worth it even if you don't have the use for now.
How Much RAM

We were initially running our Elastic nodes on 32GB RAM. We configured Elastic to use 8GB heap per node. After trying a 64GB RAM machine, we felt like it improved performance because there was more room for Filesystem caching.
ubuntu@ns314096:~$ free -m
              total        used        free      shared  buff/cache   available
Mem:          64314       11571        2043           1       50699       52022
Swap:             0           0           0
As you can see, while we use only 11GB or RAM to run Elasticsearch and a few other programs, the rest of the RAM (50GB!) is used by Linux for Buffer / Cache.
We're definitely gaining something here by upgrading from 32 to 64GB RAM. Elasticsearch heavily relies on the disk, thus it can significantly boost performance to have a lot of RAM available for caching.
There are also servers with 128GB RAM and more. But, given the fact costs rise usually exponentially with server size, it's better to stick with mid-sized servers and scale horizontally.
Does RAM Speed matter?
That's a fairly good question. In fact, many benchmarks have shown that RAM speed has no significant impact on performance these days. The best you will see is something like a 5% improvement. That's still something, but it doesn't justify paying twice the price for high speed RAM.
DDR3 or DDR4?
DDR4 is available since 2014. Most servers now run on DDR4 which offers much more bandwidth. (runs at least at 2133Mhz, while DDR3 mostly tops at 1866Mhz)
Does RAM Latency matter?
RAM speed is governed by two facts: bandwidth and latency. There are probably programs highly sensitive to memory bandwidth, but in our case (Elasticsearch), it's not that important. And you can't choose RAM speed and/or timings on most servers you will rent anyway.
OKay, let's go for 128GB RAM!
Depending on the number of indices and shards you have, it might be worthwhile. But remember that hardware capable of handling such amount of RAM is usually much more expensive than several commodity hardware servers with less.
Should I go for regular or ECC RAM?
ECC or not ECC has been widely discussed. ITs tend to favor ECC RAM, but it's proven that ECC RAM tends to increase machine stability. Choosing between ECC or not is mostly a matter of personal taste.
HDD or SSD
The short answer is: go for SSDs. Possibly Nvme SSDs. Spinning hard disk drives are very slow when handling a large amount of small files (4KB and below). Let's take a look at a 1TB HDD benchmark first.

HDDs are horribly slow at handling a huge number of small files. With about 0.4MB/sec top speed reading 4KB files, that's about 100 IOPS (IOPS = Input Output Operations per Second).
Elasticsearch can generate a lot of small files call segments. Each time documents are indexed, those documents are first written into small segments. Those small segments are then merged into larger segments to improve speed. On our cluster, most of our nodes have about 1000 files open while running.
We're not even mentioning that seek time are around 20ms: it's the time to retrieve first bytes of the data you want from the rotational disk. SSDs

Typical SSDs will have a seek time of 0.1ms. That's much faster than HDDs! And, as you can see, SSDs are a lot faster when reading / write small 4K files. Sequential speed on this Samsung 850 Evo are also around 500MB/sec, almost 4x more than HDD.
Most SATA III SSDs are limited by the connection bandwith (which is around 550MB/sec or 6Gbps). That's why we see new SSDs connected via NVM Express. In this case, the bandwidth can increase up to 4000MB/sec! (4x PCI-Express 2.0 lanes)

NVMe drives can be as much as 25x faster than conventional HDD, and 5x faster than SATA SSDs. High-end NVMe drives can reach up to 400K IOPS on read and write operations. Of course, NVMe disks are even more expensive than regular SSD.
Why don't we use always SSDs then?
Because SSDs have a much higher $ per GB ratio. Said otherwise, SSDs are much more expensive than HDDs. But prices are falling rapidly as SSDs become widespread.
NVMe Drives are not so common in regular servers as of now, but should be in a few years. I wouldn't be surprised to see them in all servers in under 5 years.
But, wait! HDDs are much more tough than SSDs!
And that's right. An enterprise grade 500GB SSD has usually an endurance of 250TBW. That's 250 TeraBytes written. Enterprise grade HDDs can be written up to 550TB/year, for 5 years. That's about 2 PetaBytes!
We rent SoYouStart servers. Most of them have already been used for 4 or 5 years. It's legitimate to think the SSD is about to die and needs to be replaced. Our answer may surprise you: it's not the case!
smartctl 6.6 2016-05-31 r4324 [x86_64-linux-4.15.0-30-generic] (local build)
Copyright (C) 2002-16, Bruce Allen, Christian Franke, www.smartmontools.org

=== START OF INFORMATION SECTION ===
Model Family:     Intel 730 and DC S35x0/3610/3700 Series SSDs
Device Model:     INTEL SSDSC2BB480G4
Serial Number:    ******************
LU WWN Device Id: 5 5cd2e4 04b56f6d8
Firmware Version: D2012370
User Capacity:    480,103,981,056 bytes [480 GB]
Sector Sizes:     512 bytes logical, 4096 bytes physical
Rotation Rate:    Solid State Device
Form Factor:      2.5 inches
Device is:        In smartctl database [for details use: -P show]
ATA Version is:   ACS-2 T13/2015-D revision 3
SATA Version is:  SATA 2.6, 6.0 Gb/s (current: 6.0 Gb/s)
Local Time is:    Mon Sep 17 14:41:39 2018 UTC
SMART support is: Available - device has SMART capability.
SMART support is: Enabled

...

SMART Attributes Data Structure revision number: 1
Vendor Specific SMART Attributes with Thresholds:
ID# ATTRIBUTE_NAME          FLAG     VALUE WORST THRESH TYPE      UPDATED  WHEN_FAILED RAW_VALUE
  5 Reallocated_Sector_Ct   0x0032   100   100   000    Old_age   Always       -       0
  9 Power_On_Hours          0x0032   100   100   000    Old_age   Always       -       32939
 12 Power_Cycle_Count       0x0032   100   100   000    Old_age   Always       -       44
170 Available_Reservd_Space 0x0033   100   100   010    Pre-fail  Always       -       0
171 Program_Fail_Count      0x0032   100   100   000    Old_age   Always       -       0
172 Erase_Fail_Count        0x0032   100   100   000    Old_age   Always       -       0
174 Unsafe_Shutdown_Count   0x0032   100   100   000    Old_age   Always       -       42
175 Power_Loss_Cap_Test     0x0033   100   100   010    Pre-fail  Always       -       619 (191 4233)
183 SATA_Downshift_Count    0x0032   100   100   000    Old_age   Always       -       0
184 End-to-End_Error        0x0033   100   100   090    Pre-fail  Always       -       0
187 Reported_Uncorrect      0x0032   100   100   000    Old_age   Always       -       0
190 Temperature_Case        0x0022   073   066   000    Old_age   Always       -       27 (Min/Max 17/35)
192 Unsafe_Shutdown_Count   0x0032   100   100   000    Old_age   Always       -       42
194 Temperature_Internal    0x0022   100   100   000    Old_age   Always       -       38
197 Current_Pending_Sector  0x0032   100   100   000    Old_age   Always       -       0
199 CRC_Error_Count         0x003e   100   100   000    Old_age   Always       -       0
225 Host_Writes_32MiB       0x0032   100   100   000    Old_age   Always       -       1299972
226 Workld_Media_Wear_Indic 0x0032   100   100   000    Old_age   Always       -       1812
227 Workld_Host_Reads_Perc  0x0032   100   100   000    Old_age   Always       -       0
228 Workload_Minutes        0x0032   100   100   000    Old_age   Always       -       334023
232 Available_Reservd_Space 0x0033   100   100   010    Pre-fail  Always       -       0
233 Media_Wearout_Indicator 0x0032   095   095   000    Old_age   Always       -       0
234 Thermal_Throttle        0x0032   100   100   000    Old_age   Always       -       0/0
241 Host_Writes_32MiB       0x0032   100   100   000    Old_age   Always       -       1299972
242 Host_Reads_32MiB        0x0032   100   100   000    Old_age   Always       -       835842
The report above is the SMART Report of one of the 2 480GB SSD. Those are Intel S3500, with an endurance rating of 275TBW.
As you can see, the drive has been powered on for 32939 hours so far. That's about 3 years and 9 months. That's not the most interesting metric. 1299972 chunks of 32MB have been written to the disk, or about 40TB. Given the drive can endure 275TBW, it has still 85% endurance left.
Most servers are used to serve web pages. That's mostly read workload, which barely affects the SSDs lifespan. SSDs are also not affected much by power on hours because there is no moving part (contrary to HDDs).
While the same OVH server with new drives costs about twice as much per month (140€/month vs 70€/month VAT Ex.), you only get 15% more lifetime of the SSDs in that case. Already used servers (which have run for several years) also have an advantage: components like motherboard, CPU or RAM rarely fail once they have run for several years. Especially when you know they run in a datacenter with no dust and room temperature tightly controlled.
Last but not least, if a server fails, the provider takes care of replacing the hardware for you for no extra fees. Should you wear out the SSDs, they are responsible of replacing them.
Should I use RAID0 or RAID1?
As Elasticsearch already provides replicas to prevent dataloss, there is no need to use disk mirroring (RAID1). RAID0 increases the likelihood of a disk failure but increases disk speed and capacity at the same time. You choose whenever you want extra safety or speed. We have mostly used the default RAID1 setup preconfigured with our servers but we plan to switch to RAID0.
Network
Our 5 nodes Elasticsearch cluster is entirely hosted in a single datacenter with low-latency 1Gbits ethernet connections in between. As specified in Elasticsearch Hardware:
A fast and reliable network is obviously important to performance in a distributed system. Low latency helps ensure that nodes can communicate easily, while high bandwidth helps shard movement and recovery. Modern data-center networking (1 GbE, 10 GbE) is sufficient for the vast majority of clusters.
As part of our Disaster Recovery Plan, the database is frequently backuped up to a different datacenter.
To sum Up
We recommend renting physical servers (much cheaper here in Europe) with:
- 4 to 6 core CPUs,
- 32 or 64GB RAM, and use 8GB to 16GB for Elasticsearch heap,
- 500GB (or more) SATA III (50K iops) or NVMe (300k iops) SSD drives.
Physical servers with those specs can be found between 50€ and 100€ per month here in Europe. Machines with those specs seem to be the sweet spot. Avoid too small machines as managing a cluster of hundreds of small nodes can become a hassle.
Huge machines with 32+ CPU cores and 128+GB RAM should be avoided too. First, these cost exponentially more than mid-range machines. Second, because resources may not be well used for software reasons ( 32+GB Heap is not recommended) or hardware reasons (multi CPU socket systems introduce overhead when CPUs need to communicate with each other).
Operating System
File Descriptors
Elasticsearch recommends to increase ulimit to 65536 in system settings. That wasn't necessary on our side as we run Elasticsearch on Docker, which appeared to be configured well by default.
You can check the settings of each of your nodes by running this command in Kibana:
GET _nodes/stats/process?filter_path=**.max_file_descriptors
Your servers show the following output:
{
  "nodes": {
    "ZIVkIvA8QI2nl3vgw4brlA": {
      "process": {
        "max_file_descriptors": 1048576
      }
    },
    "m8wAaZ5EQcmlkKvxh3npfw": {
      "process": {
        "max_file_descriptors": 1048576
      }
    },
    "S08OaH14THiOVzcscCHxvw": {
      "process": {
        "max_file_descriptors": 1048576
      }
    },
    "S4X6k8nlTv68uu3v42MIEA": {
      "process": {
        "max_file_descriptors": 1048576
      }
    },
    "iYasmOiAQm2EgWwsDzmxBA": {
      "process": {
        "max_file_descriptors": 1048576
      }
    }
  }
}
Our monitoring system tells us we have about 1.4K average open file descriptors per node. Considering we have about 30 indices with 5 shards and 2 replicas each, that's pretty good.
Disable Swap File
As explained in ElasticSearch Memory Configuration, disabling swap is recommended to enhance ElasticSearch performance.
Also, it avoids that the system swaps part of ElasticSearch memory to disk, which could cause instabilities. First, let's disable swap:
sudo swapoff -a
This disables swap until the next reboot. Then, edit /etc/fstab and remove any swap partition by commenting it out with #:
# /swapfile none swap sw 0 0
Please keep in mind our server must have enough RAM to run all the programs as well as some unused RAM. Let's talk about this.
Unused RAM
A good rule is to keep at least 50% RAM available for use by the operating system for caching. If you have already read Linux Ate My RAM before, you will know that Linux heavily caches the filesystem into RAM to make the system much more responsive.
Here is the typical output of free -m on one of our servers:
              total        used        free      shared  buff/cache   available
Mem:          64314       11576         981           1       51756       52017
Swap:             0           0           0
As you can see, it's a 64GB RAM server. Programs use about 12GB of RAM (ElasticSearch, Tomcat server and load-balancer). almost 51GB RAM is used by the system for caching!
We're only using about 19% of total RAM for programs and operating system services. The rest is available. While this seems like a waste of resources, it's not! ElasticSearch, which relies on Apache Lucene, heavily uses the disk, especially during indexing. In terms of speed, typical SATA III SSDs can reach up to 550MB/sec (6Gbps). On the other side, standard DDR3 1600Mhz RAM modules can reach 17.8GB/sec! DDR3 RAM is 30x faster than SATA III SSD.
ElasticSearch
Our Workload
First, let's talk about the typical workload we encounter at OctoPerf. We use Elasticsearch primarily as:
- Datastore: we store basically everything in Elasticsearch, from user data to time-series samples generated during test execution,
- Aggregations: we heavily rely on Elastic's Aggregations to generate graphs and statistics from millions of time-series samples with millisecond response time.
That doesn't mean the optimization tips below aren't for you! Just keep in mind that some of them are very specifically targeted to our specific workload.
Index Mapping
One of the very first things you can do is to define your indice mapping statically. By default, ElasticSearch automatically generates a mapping for your indice depending on the documents you index.
Here is an example of a static mapping:
GET octoperf_user/user/_mapping

{
  "octoperf_user": {
    "mappings": {
      "user": {
        "dynamic": "false",
        "_all": {
          "enabled": true
        },
        "properties": {
          "username": {
            "type": "keyword"
          }
        }
      }
    }
  }
}
keyword type is suitable when you need to lookup for documents by exactly matching the value provided like in the following query:
GET octoperf_user/user/_search
{
  "query": {
    "term": {
      "username": {
        "value": "jsmith"
      }
    }
  }
}
Terms lookup is efficient and cheap. It's comparable to a query in an SQL database by an index.
Use Bulk Requests
Most of the documents we index when running load tests are indexed using bulk requests:
final BulkRequestBuilder bulk = client.prepareBulk();
for(final Sample sample : samples) {
  ...
  bulk.add(request);
}

client.bulk(bulk.request()).actionGet();
Bulk requests have the advantage of reducing the overhead per request. As explained in Tune for indexing speed:
Bulk requests will yield much better performance than single-document index requests.
That's mostly because sending multiple documents at once is much more efficient that making a request per document.
RefreshPolicy.NONE
By default, when creating a bulk request using client.prepareBulk(), the refresh policy is already well defined:
final BulkRequestBuilder bulk = client
      .prepareBulk()
      .setRefreshPolicy(NONE);
The .setRefreshPolicy(NONE); is not really necessary since it's already the default behavior (for demo purpose only here). This means that elasticsearch doesn't refresh the index after this request.
If you set it to IMMEDIATE, the java documentation is pretty clear:
Force a refresh as part of this request. This refresh policy does not scale for high indexing or search throughput but is useful to present a consistent view to for indices with very low traffic. And it is wonderful for tests!
Since we don't need to wait until data is indexed (because search queries are done via other HTTP requests to our servers), this is fine.
Increase Refresh Interval
The default index.refresh_interval is 1s. We changed this to 30sec.
Each time you index documents, ElasticSearch creates what's called Segments:
- New docs are indexed: those are written in a temporary in-memory buffer and a
translogas well. Translog prevents the node from loosing documents to index in case of node failure, - On Refresh: the in-memory buffer is unloaded into an immutable segment on disk,
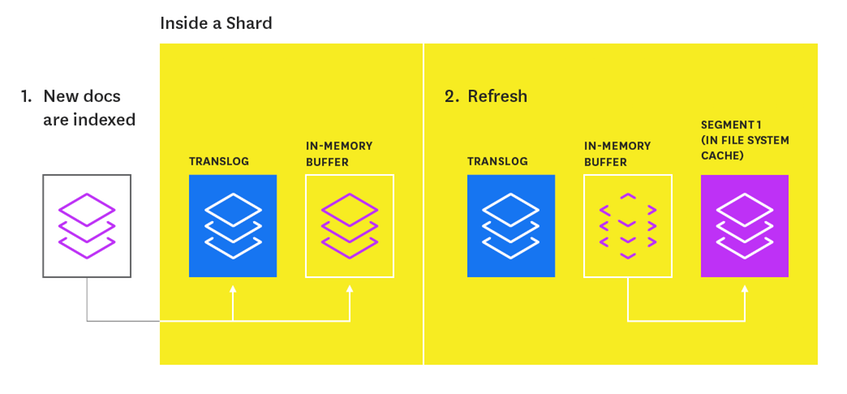
- On Merge: every once in a while, ElasticSearch merges the smaller segments into a bigger one.
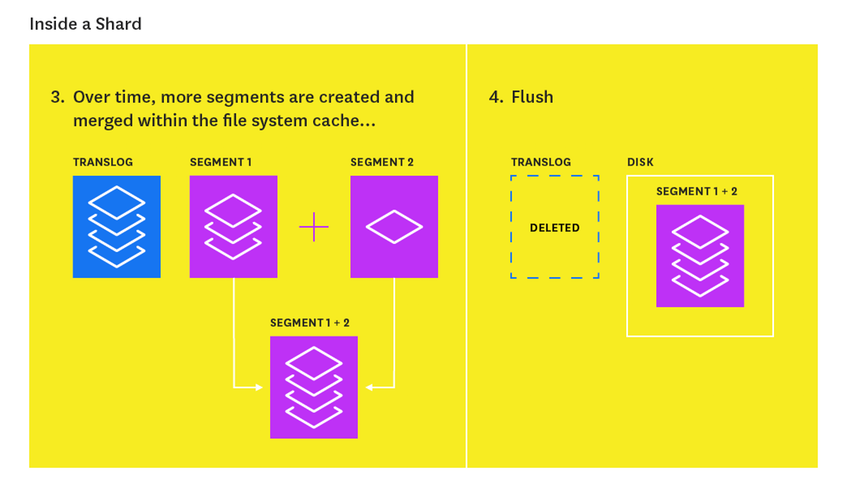
This is very well explained in How to Monitor ElasticSearch. The duration between refreshes affects the number of segments being created. By adjusting refresh interval to higher values, you effectively diminish the number of segments being produced while indexing.
Use auto-generated ids
Like explained in Tuning for Speed:
When indexing a document that has an explicit id, ElasticSearch needs to check whether a document with the same id already exists within the same shard, which is a costly operation and gets even more costly as the index grows.
auto-generated ids avoid this costly check.
Limit Number of Replicas
Replicas have their advantages but also have drawbacks:
- Replicas increasing durability: A replica is a copy of a primary shard, thus providing a backup of your primary shard data,
- Search request are faster: because replicas handle searches too,
- Indexing speed is reduced: because the same data must be indexed on primary and replica shards.
If you don't care loosing your data in case of a node failure, then setting replicas to 0 will provide the best indexing speed. Otherwise, setting n replicas means your cluster can tolerate up to n failures:
N = number of nodes

quorum = (N + 1) / 2 # lower integer value
replicas = N - quorum
Example: You have a 3 nodes cluster. The quorum is the minimum number of nodes required so the cluster can still operate. Here it's 2. In this case, setting replicas to 1 on each index is enough. With a 5 nodes cluster, setting 2 replicas is enough too.
Number of Replicas is a trade-off between indexing speed and data durability.
Detected Processors
Imagine you have a cluster of 5 nodes, each with 6 cpu cores / 12 threads. thousands of documents are indexed per second yet you see the CPU usage is topping at 1 cpu core. You should then check detected processors with the following query:
GET _nodes/os

{
  "_nodes": {
    "total": 5,
    "successful": 5,
    "failed": 0
  },
  "cluster_name": "docker-cluster",
  "nodes": {
    "S4X6k8nlTv68uu3v42MIEA": {
      "name": "S4X6k8n",
      "transport_address": "10.42.194.181:9300",
      "host": "10.42.194.181",
      "ip": "10.42.194.181",
      "version": "6.3.2",
      "build_flavor": "oss",
      "build_type": "tar",
      "build_hash": "053779d",
      "roles": [
        "master",
        "data",
        "ingest"
      ],
      "os": {
        "refresh_interval_in_millis": 1000,
        "name": "Linux",
        "arch": "amd64",
        "version": "4.15.0-34-generic",
        "available_processors": 1,
        "allocated_processors": 1
      }
    },
    ...
   }
}
As you can see, available_processors and allocated_processors is only set to 1! In some cases (like ours), the number of processors being detected is wrong. ElasticSearch relies on Java's Runtime.getRuntime().availableProcessors(); API to get the number of processors.
The good news is you can override this setting! You need to define the number of processors in your elasticsearch.yml on each node:
processors: 6
Restart the node after changing this setting. You should now see allocated_processors set to 6. Set it to the number of CPU cores you have on your server. We had this issue when running ElasticSearch via Rancher v1.6.x on Docker.
Setting the right number of processors on our nodes gave us a huge performance boost! Instead of using 1 cpu core per node, we now use 6: our cluster is now running on 30 cpu cores instead of 5.
Thread Pool Queue Size
This is also a nasty issue we tracked for months. Seeing EsRejectedExecutionException occurring while indexing documents? You should then take a look at thread pool queue size.
Here is how this issue showed up in our analytics report:

We investigated this issue for several weeks without success:
- Load generators are designed to retry sending the metrics in case of failure. No error seen here,
- Metrics are then indexed on the ElasticSearch cluster. No error seen on this side.
That's when I came up with the idea that the documents may have been lost on ElasticSearch side. The following query shows you the number of queued, rejected and completed requests per thread pool per node:
GET /_cat/thread_pool?v&h=id,name,queue,rejected,completed

id                     name                queue rejected completed
S4X6k8nlTv68uu3v42MIEA analyze                 0        0         0
S4X6k8nlTv68uu3v42MIEA fetch_shard_started     0        0         0
S4X6k8nlTv68uu3v42MIEA fetch_shard_store       0        0        70
S4X6k8nlTv68uu3v42MIEA flush                   0        0      5808
S4X6k8nlTv68uu3v42MIEA force_merge             0        0         0
S4X6k8nlTv68uu3v42MIEA generic                 0        0    540055
S4X6k8nlTv68uu3v42MIEA get                     0        0    317506
S4X6k8nlTv68uu3v42MIEA index                   0        0         0
S4X6k8nlTv68uu3v42MIEA listener                0        0         0
S4X6k8nlTv68uu3v42MIEA management              0        0    348446
S4X6k8nlTv68uu3v42MIEA refresh                 0        0   4452990
S4X6k8nlTv68uu3v42MIEA search                  0        0   1645594
S4X6k8nlTv68uu3v42MIEA snapshot                0        0        22
S4X6k8nlTv68uu3v42MIEA warmer                  0        0         0
S4X6k8nlTv68uu3v42MIEA write                   0      123    342509
As you can see on the above result, we had 123 rejeted requests on the write pool. This pool is responsible of indexing bulk requests. We have a suspect now! Most ElasticSearch thread pools have a size which depends on the number of available processors.
The write thread pool has a default queue size of 200 requests. It means it cannot hold more than 200 bulk requests within the queue. If you send more than 200 bulk requests, some of them will be rejected (and thus the data will be lost).
GET _nodes/thread_pool


{
  "_nodes": {
    "total": 1,
    "successful": 1,
    "failed": 0
  },
  "cluster_name": "docker-cluster",
  "nodes": {
    "S4X6k8nlTv68uu3v42MIEA": {
      "name": "S4X6k8n",
      "transport_address": "10.42.194.181:9300",
      "host": "10.42.194.181",
      "ip": "10.42.194.181",
      "version": "6.3.2",
      "build_flavor": "oss",
      "build_type": "tar",
      "build_hash": "053779d",
      "roles": [
        "master",
        "data",
        "ingest"
      ],
      "thread_pool": {
...
        "write": {
          "type": "fixed",
          "min": 6,
          "max": 6,
          "queue_size": 200
        },
...
      }
    }
  }
}
It's generally not advised to increase a thread pool size. The bigger a queue is, the more pressure on the elastic heap memory is puts. But, in our case load generators are sending metrics by bursts. Which means that we see big spikes of requests then nothing for a while.
For this reason, we decided to increase the queue_size to 2000 instead of 200 by editing the elasticsearch.yml configuration:
thread_pool.write.queue_size: 2000
And we monitor the ElasticSearch cluster memory usage closely to make sure this doesn't result in OutOfMemory issues.

Out of the 8GB of Heap set via ES_JAVA_OPTS=-Xms8g -Xmx8g, only 5GB is being used at most. Always keep a safe margin otherwise it may put a high pressure on the garbage collector and degrade performances.
Final Words
I never thought the guide would end up being so long! And we haven't even covered the fact you can separate master, ingest and data nodes on different servers for maximum reliability. I hope this guide will guide you to design and run ElasticSearch yourself on virtual machines (in the cloud) or on bare-metal servers.
Keep in mind that some of the choices exposed here are purely subjective. Some people prefer bare-metal servers while others might prefer to run Elasticsearch in GCE with Kubernetes. Each company is run by different people mastering different fields.