How To Deploy InfluxDB / Telegraf / Grafana on K8s?
This article follows our first blog post related to deployment on Kubernetes. It is a step-by-step guide explaining how to deploy the InfluxDb/Telegraf/Grafana stack.
More importantly we will se:
- How to map a configuration file using a ConfigMap resource?
- How to map sensitive environment variables using the Secrets object?
- How to use Kompose to generate declarative K8S configuration?
- how to mount a data volume with a PersistentVolumeClaim?
- As well as several other tips like connecting to a running Pod, displaying logs or cross container communication using kube-dns.
Here again we rely on declarative configuration of K8s to install the InfluxDB/Grafana stack. It's the easiest way to do since there are many configuration objects to create.
Prerequisites
You need to have installed Kubernetes and Minikube, please check my first blog post for more information.
InfluxDB is an open-source time series database (TSDB). It is optimized for fast, high-availability storage and retrieval of time series data.
In the context of load testing, we use it to store performance metrics such as:
- Number of requests (hits),
- Number of errors,
- Response times,
- etc.
Monitoring metrics can also be inserted using Telegraf (That's what we do in this blog post). Grafana displays the metrics gathered in InfluxDb in customizable dashboards.
TL; DR
Download and extract the monitoring.zip archive.
It contains several K8s configuration files for InfluxDB, Telegraf and Grafana, as well as configuration files specific to each application.
It also contains a Makefile. Here is an extract of this file:
start:
    minikube start --vm-driver=kvm2 --extra-config=apiserver.service-node-port-range=1-30000

mount:
    minikube mount ${PWD}/grafana/config:/grafana

all:
    kubectl apply -R -f .

list:
    minikube service list

watch:
    kubectl get pods -A --watch
To launch the complete stack:
- Run
make startto start Minikube (or copy paste the command above in a terminal if you do not have installedmake), - Execute
make mountto mount Grafana's configuration file into Minikube, - In a new terminal, run
make allto launch the complete stack, - Wait for the various Pods to start (it may take some time to download the Docker images) using
make watch, - List the available services with
make list.
|---------------|----------------------|--------------------------------|
|   NAMESPACE   |         NAME         |              URL               |
|---------------|----------------------|--------------------------------|
| default       | grafana-service      | http://192.168.39.68:3000      |
| default       | influxdb-service     | No node port                   |
| default       | kubernetes           | No node port                   |
| kube-system   | kube-dns             | No node port                   |
| kube-system   | kubernetes-dashboard | No node port                   |
|---------------|----------------------|--------------------------------|
Open the URL of the grafana-service and check that the stack is properly installed.
How to Deploy InfluxDB?
Before we deploy the InfluxDB container on Kubernetes, we must create several resources used by it:
- The
influxdb.conffile must be mounted as a ConfigMap, - Secured environment variables such as admin credentials must be set using Secrets,
- A volume must be created to persist the InfluxDB data using PersistentVolumeClaim.
In this chapter we will take the time to test several options to generate declarative object configuration files.
Read more about the Yaml format of K8s object in their documentation: Describing a Kubernetes Object.
Map a Configuration File Using ConfigMap
InfluxDb is configured using a influxdb.conf file placed in the /etc/influxdb/ folder.
TL; DR: Download a sample ConfigMap file and import it with the command
kubectl apply -f influxdb-config.yaml.
In Kubernetes, mapping a configuration file is done by creating a ConfigMap.
- An easy way to generate a ConfigMap is to use an existing file. You can download a sample here: influxdb.conf
- Then execute the command
kubectl create configmap influxdb-config --from-file=influxdb.confto generate the ConfigMap object.
You can export the created ConfigMap into a Yaml configuration file named influxdb-config.yaml with the following command:
> kubectl get configmap influxdb-config --export -o yaml >> influxdb-config.yaml
Flag --export has been deprecated, This flag is deprecated and will be removed in future.
This allows you to see the format used in such files influxdb-config.yaml:
apiVersion: v1

kind: ConfigMap
metadata:
  name: influxdb-config
data:
  influxdb.conf: |+
    reporting-disabled = false
    bind-address = "127.0.0.1:8088"

    [meta]
      dir = "/var/lib/influxdb/meta"
      retention-autocreate = true
      logging-enabled = true
[...]
The command kubectl get <object type> --export -o yaml is an easy way to generate declarative configuration file from existing K8s objects.
Unfortunately the --export option is deprecated.
Check the data field.
It contains one or several entries, named after the configuration file used.
The data.influxdb.conf field contains the raw content of the source influxdb.conf file.
This field of the ConfigMap is then referenced inside the InfluxDB Deployment.
Finally, check that the ConfigMap is created (here using the apply command as we can guess by the presence of the kubectl.kubernetes.io/last-applied-configuration annotation):
> kubectl describe configmap influxdb-config
Name:         influxdb-config
Namespace:    default
Labels:       <none>
Annotations:  kubectl.kubernetes.io/last-applied-configuration:
                {"apiVersion":"v1","data":{"influxdb.conf":"reporting-disabled = false\nbind-address = \"127.0.0.1:8088\"\n\n[meta]\n  dir = \"/var/lib/in...

Data
====
influxdb.conf:
----
reporting-disabled = false
bind-address = "127.0.0.1:8088"

[meta]
[...]
You can also check the K8s API to know the format and the required fields for any kind of K8s resource.
Regarding ConfigMaps, the same format is used for the telegraf.conf file and Grafana's multiple file inputs.
Map Environment Variables Using Secrets
Let's start with the definition of a K8s secret:
A Secret is an object that contains a small amount of sensitive data such as a password, a token, or a key.
This is the perfect resource for storing sensitive InfluxDb environment variables.
Start by creating the configuration file influxdb-secrets.yaml (or download it here):
apiVersion: v1

kind: Secret
metadata:
  name: influxdb-secrets
type: Opaque
stringData:
  INFLUXDB_CONFIG_PATH: /etc/influxdb/influxdb.conf
  INFLUXDB_ADMIN_USER: admin
  INFLUXDB_ADMIN_PASSWORD: kraken
  INFLUXDB_DB: gatling
  INFLUXDB_USER: user
  INFLUXDB_USER_PASSWORD: kraken
Import it in K8s with the apply command:
> kctl apply -f influxdb-secrets.yaml
secret/influxdb-secrets created
Display the created Secret, environment variable values are not visible:
> kctl describe secret influxdb-secrets
Name:         influxdb-secrets
Namespace:    default
Labels:       <none>
Annotations:
Type:         Opaque

Data
====
INFLUXDB_ADMIN_USER:      5 bytes
INFLUXDB_CONFIG_PATH:     27 bytes
INFLUXDB_DB:              7 bytes
INFLUXDB_USER:            4 bytes
INFLUXDB_USER_PASSWORD:   6 bytes
INFLUXDB_ADMIN_PASSWORD:  6 bytes
Mount a Data Volume
In Kubernetes, persistence of data is donne using persistent volumes.
We need to create a PersistentVolumeClaim in order to keep InfluxDB's data even if the service is restarted. A PersistentVolumeClaim describes the type and details of the volume required. Kubernetes finds a previously created volume that fits the claim or creates one with a dynamic volume provisioner.
If you are using MiniKube, a dynamic provisioner is present. It map volumes to local folders inside the VM.
Using Kompose
Let's try another tool to generate declarative configuration files for Kubernetes: Kompose. Kompose takes a Docker Compose file and translates it into Kubernetes resources.
Installation is straightforward:
curl -L https://github.com/kubernetes/kompose/releases/download/v1.18.0/kompose-linux-amd64 -o kompose
chmod +x kompose
sudo mv ./kompose /usr/local/bin/kompose
Unfortunately Kompose only works with major docker-compose releases (2.0, 3.0 etc).
So if you have a docker-compose file with version 3.5 you have to downgrade it to 3.0.
Also, in my case the generated resource configuration files did not work out ouf the box.
It still gives an idea of what must be done in K8s for a given docker-compose.yml configuration file.
Create the following docker-compose.yml file:
version: '3.0'

services:
  influxdb:
    image: influxdb:1.7.4
    container_name: influxdb
    expose:
      - "8086"
    env_file:
      - 'env.influxdb'
    volumes:
      - influxdb-data:/var/lib/influxdb
      - ./influxdb.conf:/etc/influxdb/influxdb.conf:ro
    restart: unless-stopped
And download the configuration influxdb.conf and env files.
Run the kompose convert command to convert the created docker-compose.yml file into several K8s configuration files:
> kompose convert -f docker-compose.yml
WARN Restart policy 'unless-stopped' in service influxdb is not supported, convert it to 'always'
WARN Volume mount on the host "/home/ubuntu/workspaces/kraken/deployment/k8s/influxdb/influxdb.conf" isn't supported - ignoring path on the host
INFO Kubernetes file "influxdb-deployment.yaml" created
INFO Kubernetes file "influxdb-env-influxdb-configmap.yaml" created
INFO Kubernetes file "influxdb-data-persistentvolumeclaim.yaml" created
INFO Kubernetes file "influxdb-claim1-persistentvolumeclaim.yaml" created
It's far from perfect:
- Sensitive environment variables should be placed inside Secrets,
- A PersistentVolumeClaim is created for the
influxdb.conffile, but there is no reference to the actual file. A ConfigMap works better in such case.
It generates a file named influxdb-data-persistentvolumeclaim.yaml though.
Rename it to influxdb-data.yaml and update the storage capacity:
apiVersion: v1
kind: PersistentVolumeClaim
metadata:
  name: influxdb-data
spec:
  accessModes:
  - ReadWriteOnce
  resources:
    requests:
      storage: 2Gi
Finally create the PersistentVolumeClain:
> kubectl apply -f influxdb-data.yaml
persistentvolumeclaim/influxdb-data created
And check that the created PVC is matched to a PersistentVolume:
> kubectl get persistentvolumeclaim influxdb-data
NAME            STATUS   VOLUME                                     CAPACITY   ACCESS MODES   STORAGECLASS   AGE
influxdb-data   Bound    pvc-9630806a-96ed-4849-b1ad-207ddbe829e7   2Gi        RWO            standard       20s
We can see the volume name pvc-xxx and Bound status here.
All prerequisites to an InfluxDB deployment are now done: environment variables, configuration file and data persistence.
Create an InfluxDB Deployment
Let's apply an InfluxDB Deployment at last.
Create the influxdb-deployment.yaml file:
apiVersion: apps/v1
kind: Deployment
metadata:
  name: influxdb-deployment
spec:
  selector:
    matchLabels:
      app: influxdb
  minReadySeconds: 5
  template:
    metadata:
      labels:
        app: influxdb
    spec:
      containers:
        - image: influxdb:1.7.4
          name: influxdb
          ports:
            - containerPort: 8086
          volumeMounts:
            - mountPath: /var/lib/influxdb
              name: influxdb-data
            - mountPath: /etc/influxdb/influxdb.conf
              name: influxdb-config
              subPath: influxdb.conf
              readOnly: true
          envFrom:
            - secretRef:
                name: influxdb-secrets
      volumes:
        - name: influxdb-data
          persistentVolumeClaim:
            claimName: influxdb-data
        - name: influxdb-config
          configMap:
            name: influxdb-config
Volumes must be declared outside the container and referenced in the spec.template.spec.containers.volumeMounts section:
influxdb-datareferences a PersistentVolumeClaim with the same name,influxdb-configreferences a ConfigMap with the same name.
The influxdb-config volume mount has subPath: influxdb.conf property.
We previously generated a ConfigMap with only one entry: its key is the name of the source configuration file and its value is the .conf content.
The environment variables reference the previously created Secrets.
Apply this deployment to the K8s cluster:
> kctl apply -f influxdb-deployment.yaml
deployment.apps/influxdb-deployment created
Check the InfluxDb Deployment
Now that the InfluxDB deployment is created, let's check if our previous configurations are taken into account.
Are Corresponding Pod Created?
First and foremost, check that the Deployment is created and ready:
> kubectl get -f influxdb-deployment.yaml
NAME                  READY   UP-TO-DATE   AVAILABLE   AGE
influxdb-deployment   1/1     1            1           11m
This may take a while if you have a low bandwidth (the Docker image must be pulled).
Check for the corresponding Pod creation:
> kubectl get pods
NAME                                   READY   STATUS    RESTARTS   AGE
influxdb-deployment-69f6bf869f-6gl4f   1/1     Running   0          41s
You can also describe the created Pod:
> kubectl describe pod influxdb-deployment-69f6bf869f-6gl4f
Name:           influxdb-deployment-69f6bf869f-6gl4f
Namespace:      default
Priority:       0
Node:           minikube/10.0.2.15
Start Time:     Thu, 01 Aug 2019 11:51:51 +0200
Labels:         app=influxdb
                pod-template-hash=69f6bf869f
Annotations:    <none>
Status:         Running
IP:             172.17.0.6
Controlled By:  ReplicaSet/influxdb-deployment-69f6bf869f
Containers:
  influxdb:
    Container ID:   docker://bb3cb9d0a6b9762c68b52de48c2011f612b8615124d3309928d3a58f03c82e7b
    Image:          influxdb:1.7.4
    Image ID:       docker-pullable://influxdb@sha256:897f0b571d64f7cddbf12a6464bd04d4e9740f55fb7be684ea707545fc76876a
    Port:           8086/TCP
    Host Port:      0/TCP
    State:          Running
      Started:      Thu, 01 Aug 2019 11:51:52 +0200
    Ready:          True
    Restart Count:  0
    Environment Variables from:
      influxdb-secrets  Secret  Optional: false
    Environment:        <none>
    Mounts:
      /etc/influxdb/influxdb.conf from influxdb-config (ro,path="influxdb.conf")
      /var/lib/influxdb from influxdb-data (rw)
      /var/run/secrets/kubernetes.io/serviceaccount from default-token-gf579 (ro)
Conditions:
  Type              Status
  Initialized       True
  Ready             True
  ContainersReady   True
  PodScheduled      True
Volumes:
  influxdb-data:
    Type:       PersistentVolumeClaim (a reference to a PersistentVolumeClaim in the same namespace)
    ClaimName:  influxdb-data
    ReadOnly:   false
  influxdb-config:
    Type:      ConfigMap (a volume populated by a ConfigMap)
    Name:      influxdb-config
    Optional:  false
  default-token-gf579:
    Type:        Secret (a volume populated by a Secret)
    SecretName:  default-token-gf579
    Optional:    false
QoS Class:       BestEffort
Node-Selectors:  <none>
Tolerations:     node.kubernetes.io/not-ready:NoExecute for 300s
                 node.kubernetes.io/unreachable:NoExecute for 300s
Events:
  Type    Reason     Age   From               Message
  ----    ------     ----  ----               -------
  Normal  Scheduled  59s   default-scheduler  Successfully assigned default/influxdb-deployment-69f6bf869f-6gl4f to minikube
  Normal  Pulled     58s   kubelet, minikube  Container image "influxdb:1.7.4" already present on machine
  Normal  Created    58s   kubelet, minikube  Created container influxdb
  Normal  Started    58s   kubelet, minikube  Started container influxdb
The containers.influxdb.Mounts and Volumes sections shows us that all volume configurations are OK from the Pod point of view.
Let's check this case by case.
Is the Configuration File Loaded?
Connect to the Pod and display the content of the influxdb.conf configuration file:
> kubectl exec -it influxdb-deployment-69f6bf869f-bmxt4 -- /bin/bash
> root@influxdb-deployment-69f6bf869f-bmxt4:/# more /etc/influxdb/influxdb.conf
reporting-disabled = false
bind-address = "127.0.0.1:8088"
[...]
It should match what you set while creating the ConfigMap.
Are the Secrets mapped?
Connect to the Pod:
> kubectl exec -it influxdb-deployment-69f6bf869f-bmxt4 -- /bin/bash
Then connect to InfluxDB and display the databases:
root@influxdb-deployment-69f6bf869f-bmxt4:/# influx --username admin --password kraken
Connected to http://localhost:8086 version 1.7.4
InfluxDB shell version: 1.7.4
Enter an InfluxQL query
> show databases
name: databases
name
----
gatling
_internal
The credentials set while creating the Secrets should give you access to the database, and the gatling DB should exist.
Is the Data Folder Mounted?
We previously created a PersistentVolumeClaim. Under the hood, K8s created a PersistentVolume of type HostPath. There are many kind of PersistentVolume, several being specific to Cloud providers.
List all existing PV:
> kubectl get persistentvolumes
NAME                                       CAPACITY   ACCESS MODES   RECLAIM POLICY   STATUS   CLAIM                   STORAGECLASS   REASON   AGE
pvc-a59b241b-ca22-4ea3-a7de-ac48e3493616   2Gi        RWO            Delete           Bound    default/influxdb-data   standard                5h25m
Describe the PersistentVolume named after our PVC:
> kubectl describe pv pvc-a59b241b-ca22-4ea3-a7de-ac48e3493616
Name:            pvc-a59b241b-ca22-4ea3-a7de-ac48e3493616
Labels:          <none>
Annotations:     hostPathProvisionerIdentity: 67e2c87e-b75a-11e9-99c2-10af504dfd5b
                 pv.kubernetes.io/provisioned-by: k8s.io/minikube-hostpath
Finalizers:      [kubernetes.io/pv-protection]
StorageClass:    standard
Status:          Bound
Claim:           default/influxdb-data
Reclaim Policy:  Delete
Access Modes:    RWO
VolumeMode:      Filesystem
Capacity:        2Gi
Node Affinity:   <none>
Message:
Source:
    Type:          HostPath (bare host directory volume)
    Path:          /tmp/hostpath-provisioner/pvc-a59b241b-ca22-4ea3-a7de-ac48e3493616
    HostPathType:
Events:            <none>
We can see here that it points to the /tmp/hostpath-provisioner/pvc-a59b241b-ca22-4ea3-a7de-ac48e3493616 folder on the host machine.
Since we are using Minikube this host folder is in fact inside the VM. Connect to the VM and display the content of the folder:
minikube ssh
                         _             _
            _         _ ( )           ( )
  ___ ___  (_)  ___  (_)| |/')  _   _ | |_      __
/' _ ` _ `\| |/' _ `\| || , <  ( ) ( )| '_`\  /'__`\
| ( ) ( ) || || ( ) || || |\`\ | (_) || |_) )(  ___/
(_) (_) (_)(_)(_) (_)(_)(_) (_)`\___/'(_,__/'`\____)

$ ls /tmp/hostpath-provisioner/pvc-a59b241b-ca22-4ea3-a7de-ac48e3493616
data  meta  wal
You can see the sub-folders generated by InfluxDB.
Note: In case you need to have access to the data directly from your machine, this documentation page explains how to map a host folder to a Minikube one.
Expose a Deployment as a Service
Our goal here is to make InfluxDB accessible:
- To Telegraf so it can inject data,
- To Grafana in order to display dashboards based on these data.
Creating a Service that wraps InfluxDB will allow us to use Kubernetes DNS and expose it to other containers living in the cluster.
Start by writing a influxdb-service.yaml file:
apiVersion: v1
kind: Service
metadata:
  name: influxdb-service
spec:
  selector:
    app: influxdb
  ports:
    - protocol: TCP
      port: 8086
      targetPort: 8086
Apply this configuration to the K8s cluster:
> kctl apply -f influxdb-service.yaml
service/influxdb-service created
Check for the created service:
> kubectl get services
NAME               TYPE        CLUSTER-IP      EXTERNAL-IP   PORT(S)    AGE
influxdb-service   ClusterIP   10.102.248.163  <none>        8086/TCP   8s
kubernetes         ClusterIP   10.96.0.1       <none>        443/TCP    6d6h
It's done and the port 8086 is opened.
Check also that the kube-dns service is started (You need to activate it otherwise):
> kubectl get services kube-dns --namespace=kube-system
NAME       TYPE        CLUSTER-IP   EXTERNAL-IP   PORT(S)                  AGE
kube-dns   ClusterIP   10.96.0.10   <none>        53/UDP,53/TCP,9153/TCP   26m
We can finally test that our DNS setup is working with nslookup:
> kubectl run curl --image=radial/busyboxplus:curl -i --tty
kubectl run --generator=deployment/apps.v1 is DEPRECATED and will be removed in a future version. Use kubectl run --generator=run-pod/v1 or kubectl create instead.
If you don't see a command prompt, try pressing enter.
[ root@curl-6bf6db5c4f-5pn7h:/ ]$ nslookup influxdb-service
Server:    10.96.0.10
Address 1: 10.96.0.10 kube-dns.kube-system.svc.cluster.local

Name:      influxdb-service
Address 1: 10.102.248.163 influxdb-service.default.svc.cluster.local
How to Deploy Telegraf?
It's the same principle as for InfluxDB: we need to create several resources for configuration files and then create a deployment.
To avoid redundancy, we'll skip the creation of the declarative configuration files used to create K8s resources.
Download and Apply Configuration Files
Download the following files:
- telegraf-config.yaml: How to map a configuration file using ConfigMap?
- telegraf-secrets.yaml: How to map env variables using Secrets?
- telegraf-deployment.yaml: How to create a Deployment that uses both ConfigMap and Secret?
Then apply them all:
> kubectl apply -f telegraf-config.yaml
configmap/telegraf-config created
> kubectl apply -f telegraf-secrets.yaml
secret/telegraf-secrets created
> kubectl apply -f telegraf-deployment.yaml
deployment.apps/telegraf-deployment created
Note: You can also place these file in a folder named
telegrafand then directly run the commandkubectl apply -f telegraf.In case you have sub-folders, use the
-Rparameter to make it recursive.
Check Data Injection Into InfluxDB
Once the Telegraf Pod is started, verify that it injects some data into InfluxDB.
> kubectl get pods
NAME                                   READY   STATUS    RESTARTS   AGE
influxdb-deployment-69f6bf869f-6gs82   1/1     Running   0          4m41s
telegraf-deployment-68c95886df-qd98m   1/1     Running   0          54s
> kubectl logs influxdb-deployment-69f6bf869f-6gs82
influxdb init process in progress...
ts=2019-08-14T14:10:57.662280Z lvl=info msg="InfluxDB starting" log_id=0HG7KF~W000 version=1.7.4 branch=1.7 commit=ef77e72f435b71b1ad6da7d6a6a4c4a262439379
[...]
ts=2019-08-14T14:13:51.764355Z lvl=info msg="Executing query" log_id=0HG7KOKl000 service=query query="CREATE DATABASE telegraf"
[httpd] 172.17.0.7 - admin [14/Aug/2019:14:13:51 +0000] "POST /query HTTP/1.1" 200 57 "-" "Telegraf/1.10.0" bdebf32d-be9d-11e9-8011-0242ac110006 74098
[httpd] 172.17.0.7 - admin [14/Aug/2019:14:14:10 +0000] "POST /write?db=telegraf HTTP/1.1" 204 0 "-" "Telegraf/1.10.0" c8d55262-be9d-11e9-8012-0242ac110006 63036
[httpd] 172.17.0.7 - admin [14/Aug/2019:14:14:20 +0000] "POST /write?db=telegraf HTTP/1.1" 204 0 "-" "Telegraf/1.10.0" cecade2f-be9d-11e9-8013-0242ac110006 54880
[httpd] 172.17.0.7 - admin [14/Aug/2019:14:14:30 +0000] "POST /write?db=telegraf HTTP/1.1" 204 0 "-" "Telegraf/1.10.0" d4c0a461-be9d-11e9-8014-0242ac110006 32030
[httpd] 172.17.0.7 - admin [14/Aug/2019:14:14:40 +0000] "POST /write?db=telegraf HTTP/1.1" 204 0 "-" "Telegraf/1.10.0" dab6ff98-be9d-11e9-8015-0242ac110006 19793
[httpd] 172.17.0.7 - admin [14/Aug/2019:14:14:50 +0000] "POST /write?db=telegraf HTTP/1.1" 204 0 "-" "Telegraf/1.10.0" e0ac629b-be9d-11e9-8016-0242ac110006 20023
We can see in InfluxDb's logs that Telegraf is periodically sending data.
Another way to check this is by connecting to the pod and displaying available measurement for the telegraf database in InfluxDB:
> kubectl exec -it influxdb-deployment-69f6bf869f-6gs82 -- /bin/bash
root@influxdb-deployment-69f6bf869f-6gs82:/# influx --username admin --password kraken
Connected to http://localhost:8086 version 1.7.4
InfluxDB shell version: 1.7.4
Enter an InfluxQL query
> show databases
name: databases
name
----
gatling
_internal
telegraf
> use telegraf
Using database telegraf
> show measurements
name: measurements
name
----
cpu
disk
diskio
kernel
mem
net
netstat
processes
swap
system
> exit
root@influxdb-deployment-69f6bf869f-6gs82:/# exit
exit
kojiro@Akekoj-XPS-13-9370:~/workspaces/kraken/deployment/k8s/kraken/telegraf$
How to Deploy Grafana?
Grafana is a free software that allows visualization and formatting of metric data. It allows you to create dashboards and graphs from multiple sources including time series databases like Graphite and InfluxDB.
It requires several configuration files to setup:
- Data source configurations,
- Default dashboards configurations and JSON definitions,
- The
grafana.inifile.
As well as environment variables.
The simplest way would have probably been to create a custom Docker image that include these files. But we are going to try to mount a folder in Minikube to access all these files in one operation.
Mount Configuration Folder in Minikube
Download and extract the set of configuration files: grafana.zip.
The config sub-folder contains the configuration files mentioned above.
One file in particular should catch your attention: config/provisioning/datasource/influxdb.yaml.
It reference the InfluxDB service using Kubernetes DNS, the database created by Telegraf, and the administrator login and password.
Execute the following command to mount the grafana/config folder into the Minikube VM:
> minikube mount $(pwd)/grafana/config:/grafana
📁  Mounting host path /home/kojiro/workspaces/kraken/deployment/k8s/monitoring/grafana/config into VM as /grafana ...
💾  Mount options:
    ▪ Type:     9p
    ▪ UID:      docker
    ▪ GID:      docker
    ▪ Version:  9p2000.L
    ▪ MSize:    262144
    ▪ Mode:     755 (-rwxr-xr-x)
    ▪ Options:  map[]
🚀  Userspace file server: ufs starting
✅  Successfully mounted /home/kojiro/workspaces/kraken/deployment/k8s/monitoring/grafana/config to /grafana

📌  NOTE: This process must stay alive for the mount to be accessible ...
Leave the terminal used to run this command opened for the duration of the test.
Apply Deployment and Service Configurations
The grafana.zip archive also contains the grafana-deployment.yaml configuration:
apiVersion: extensions/v1beta1
kind: Deployment
metadata:
  name: grafana
spec:
  selector:
    matchLabels:
      app: grafana
  minReadySeconds: 5
  template:
    metadata:
      labels:
        app: grafana
    spec:
      containers:
      - env:
        - name: GF_INSTALL_PLUGINS
          value: grafana-piechart-panel, blackmirror1-singlestat-math-panel
        - name: GF_SECURITY_ADMIN_PASSWORD
          value: kraken
        image: grafana/grafana:5.4.3
        name: grafana
        volumeMounts:
        - mountPath: /etc/grafana/provisioning
          name: grafana-volume
          subPath: provisioning/
        - mountPath: /var/lib/grafana/dashboards
          name: grafana-volume
          subPath: dashboards/
        - mountPath: /etc/grafana/grafana.ini
          name: grafana-volume
          subPath: grafana.ini
          readOnly: true
      restartPolicy: Always
      volumes:
      - name: grafana-volume
        hostPath:
          path: /grafana
There are several differences with the InfluxDB deployment:
- The environment variables are declared directly in the deployment, not in a Secret, making the InfluxDB admin password visible in the K8s cluster,
- The volumes do not reference a PersistentVolumeClaim making this configuration less portable (it works only with Minikube and a host folder mapping).
Note that we also use the volumeMounts.subPath to references directories (/grafana/provisioning/ and /grafana/dashboards/) as well as the grafana.ini configuration.
Apply the Deployment configuration:
> kubectl apply -f grafana-deployment.yaml
deployment.extensions/grafana created
The grafana-service.yaml file exposes the previously created deployment using a NodePort service.
More information is available in my previous blog post on how to use NodePort to expose a port lower than 3000.
apiVersion: v1
kind: Service
metadata:
  name: grafana-service
spec:
  selector:
    app: grafana
  type: NodePort
  ports:
    - protocol: TCP
      port: 3000
      targetPort: 3000
      nodePort: 3000
Apply the Service configuration:
> kubectl apply -f grafana/grafana-service.yaml
service/grafana-service configured
Check Grafana Installation
List all services exposed by Minikube:
> minikube service list
|---------------|----------------------|--------------------------------|
|   NAMESPACE   |         NAME         |              URL               |
|---------------|----------------------|--------------------------------|
| default       | grafana-service      | http://192.168.39.68:3000      |
| default       | influxdb-service     | No node port                   |
| default       | kubernetes           | No node port                   |
| ingress-nginx | ingress-nginx        | http://192.168.39.68:80        |
|               |                      | http://192.168.39.68:443       |
| kube-system   | kube-dns             | No node port                   |
| kube-system   | kubernetes-dashboard | No node port                   |
|---------------|----------------------|--------------------------------|
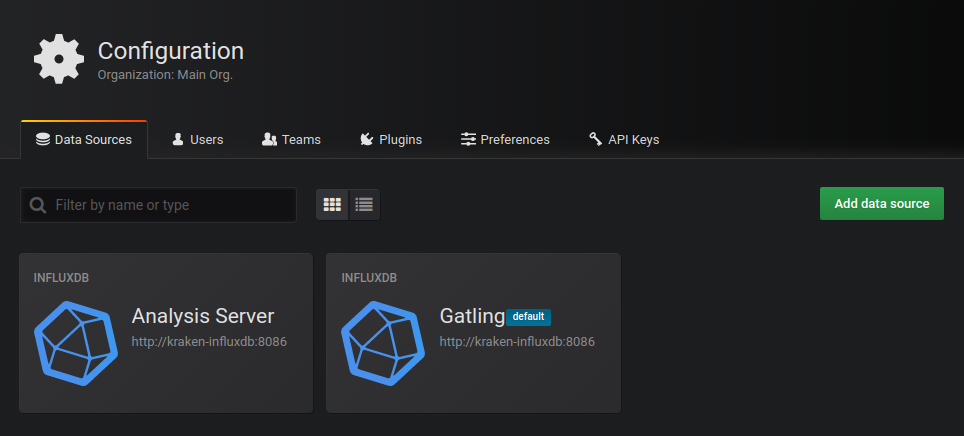
Open the grafana-service URL and go to the Data sources list (left menu > Configuration > Data Sources).
You should like two Data sources pointing to InfluxDb:

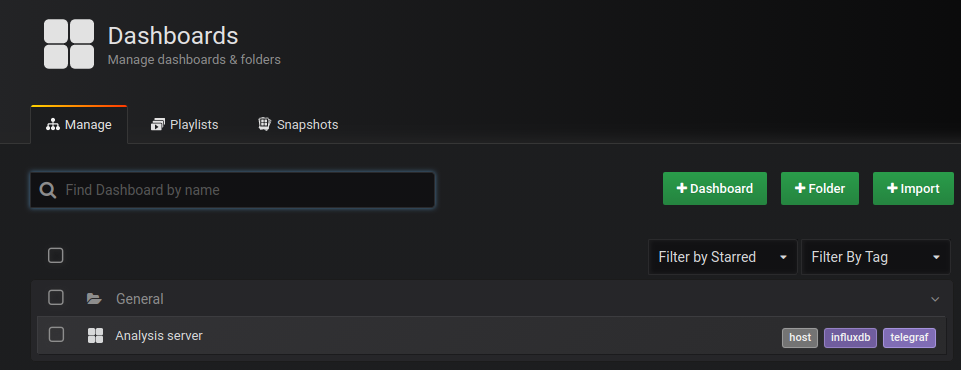
Go to the Dashboards list (left menu > Dashboards > Manage). The Analysis Server dashboard should be visible:

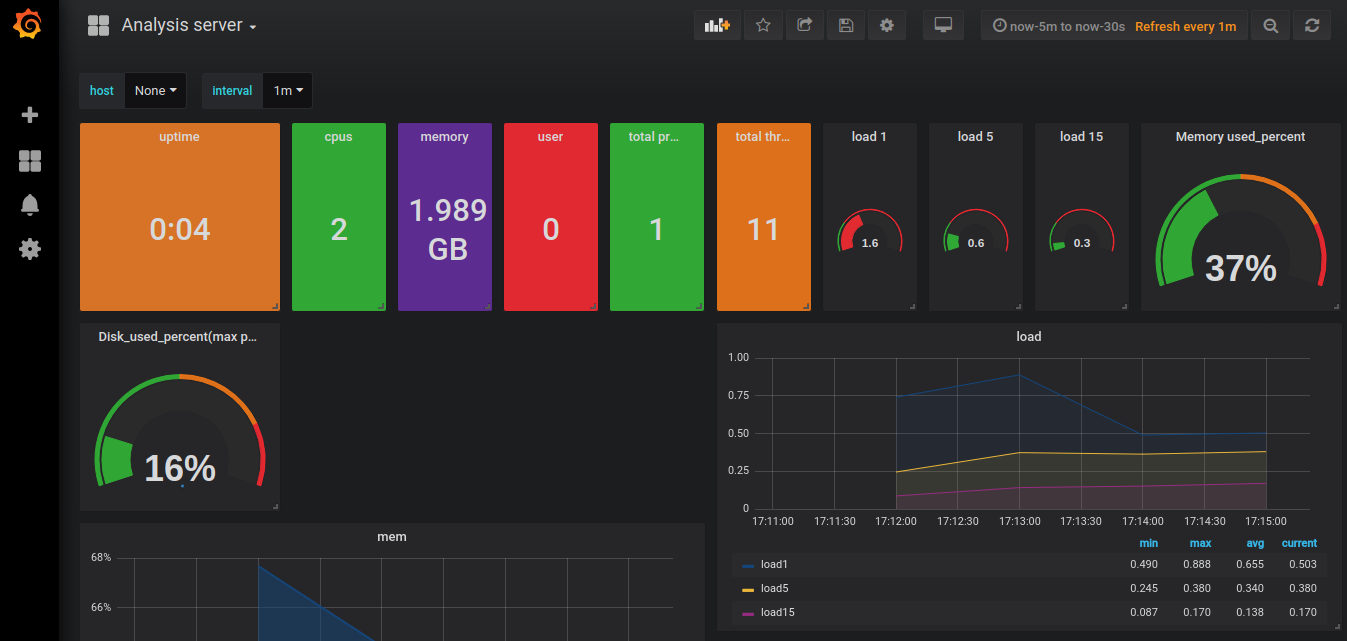
Open it to display monitoring information of the Minikube VM:

Conclusion
You may also be interested other blog posts related to DevOps.
