
JMeter Tutorial For Beginners
You are probably looking for a tutorial to quickly learn how to use JMeter.
You have already read many other JMeter Tutorials, but the only thing which comes to your mind is... Boring.
That's great because this Huge Tutorial will teach you in a way you don't fall asleep:
- What JMeter Is: Learn what a Load Testing Tool is,
- How It Works: get introduced to the concepts behind the tool and know the JMeter features,
- How to Setup the Tool: learn how to install and run JMeter,
- How to Build a Test Plan: JMeter Test Plan is the root for all tests, learn how to create your own,
- How to Run Your First Test: We're going to unleash JMeter's power,
- How to design dynamically behaving users by extracting content from server responses,
- Finally, How to Collect and Analyze Results: gathering response times and analyzing the target website performance.
I promise, at the end of this tutorial, JMeter won't have any secret for you anymore! And, it will be fun too.
Overview
What is JMeter
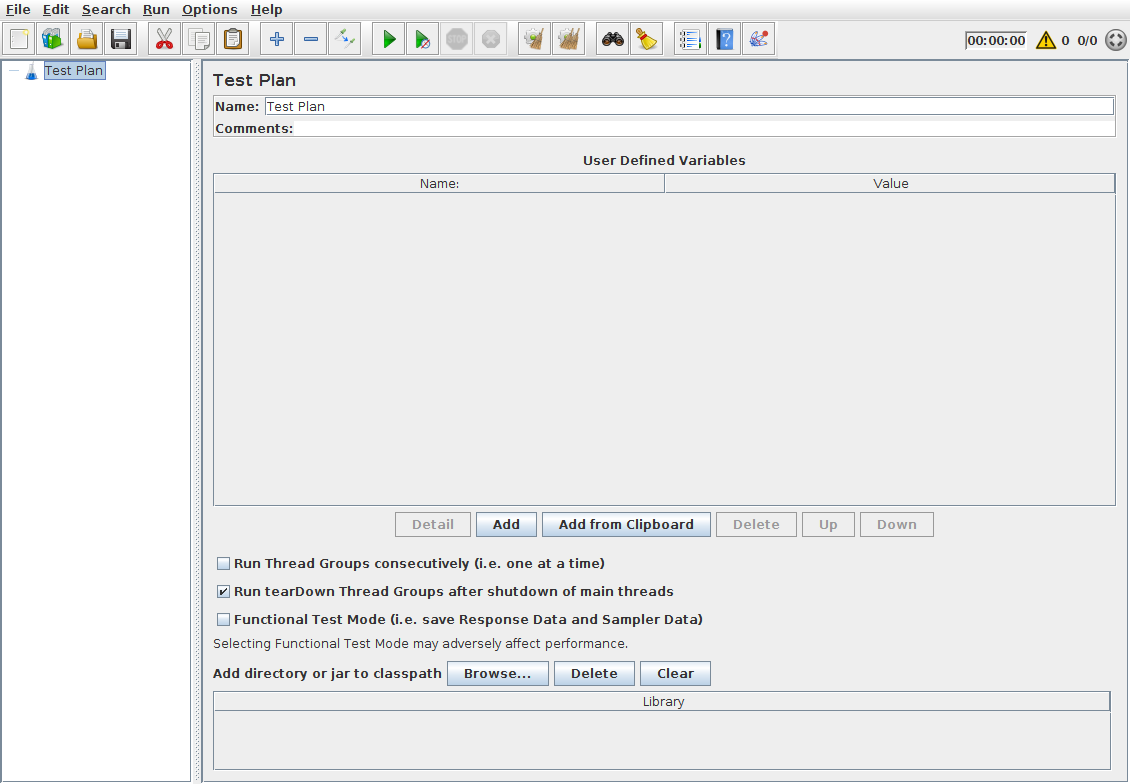
As stated on Apache JMeter Homepage:
The Apache JMeter application is open source software, a 100% pure Java application designed to load test functional behavior and measure performance. It was originally designed for testing Web Applications but has since expanded to other test functions.
But, the right question to ask yourself is: What should I use JMeter for?
Apache JMeter may be used to test performance both on static and dynamic resources and Web applications. It can be used to simulate a heavy load on a server, group of servers, network or object to test its strength or to analyze overall response time under different load types.
To sum up, JMeter allows you to swarm a web application with thousands of virtual users and measure its performance at the same time.
JMeter Features
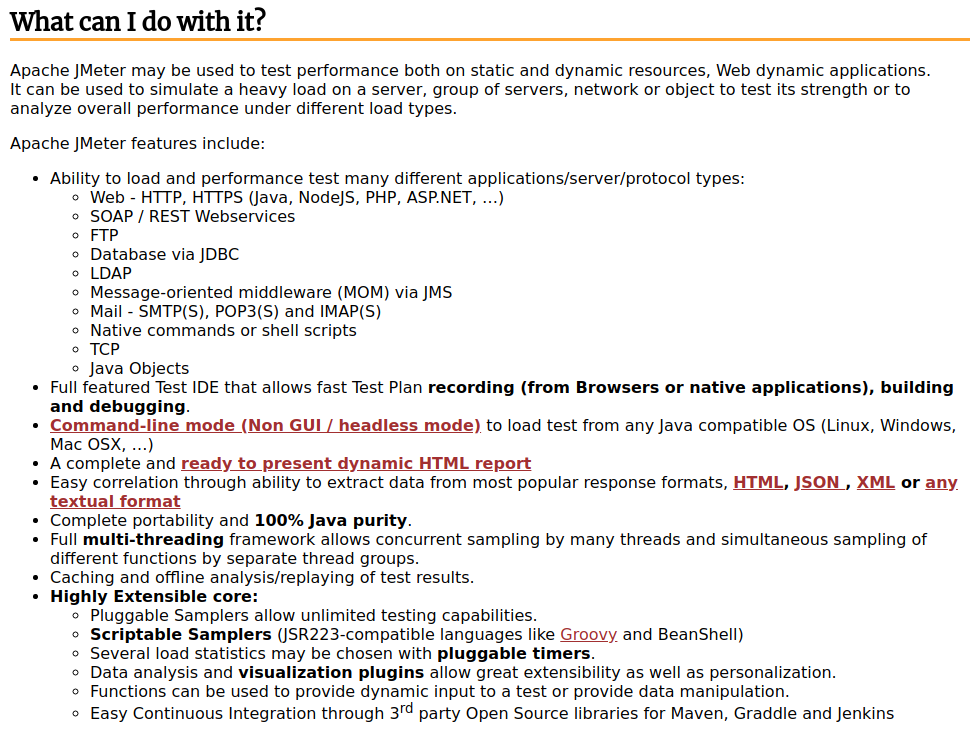
As you can see, JMeter has a lot of features. Don't panic, If you know how to load a web application using the HTTP Sampler, you've already covered 90% of its usage.
Load Testing Use-Cases
Better than theorical explanations on the origin of the universe, you may use JMeter in the following cases:
- ECommerce Sales Event: think about thousands of people rushing to an Ecommerce site offering -70% on Jewelry,
- Special Sports Events: trying to buy tickets for the Super Bowl? Waiting, waiting... Timeout,
Any event involving an unusual number of users rushing to a web application is a good candidate for pre-production load testing.
The Basics
Basically JMeter allows to:
- Perform Automated Load Testing and Functional Testing of most web applications,
- Monitor you servers using Perfmon.
And your job (Yes, You're the Performance Engineer in the room) is to yell Response Times are Too Damn High! if things go wrong.

And Just for the pleasure, here is how your colleagues may react:
Okay, enough fun! Let's get more serious again and dive into JMeter.
How JMeter Works
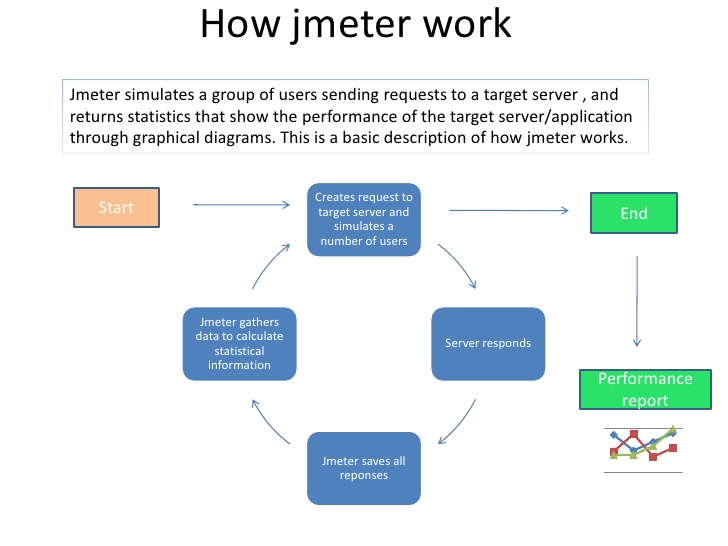
You may have never heard it before, but JMeter is just an HTTP Client capable of running multiple sessions in parallel. And the best part of it is it can be configured the way you want. Want to simulate users shopping on a ECommerce website? Easy!
Basically, You:
- Define a workflow composed of logical components (like If, For and While),
- Swarm the system: JMeter spawns thousands of threads following your workflow,
- Collect and Analyze the Response Times: And yell what you know if things are running amok.
That's It! Simple, isn't it?
Technically speaking, JMeter is a multi-threaded HTTP Client capable of executing complex workflows and interactions with web application.
Of course, JMeter is not limited to HTTP. There are FTP, SMTP and more samplers. But, given the fact most of the time JMeter is being used for HTTP tests, we'll ignore them for now.
So you got the grasp of it: JMeter works on the protocol level. It simulates the network interactions (or requests) with a web application.
Setup
Let's make things more practical by installing JMeter.
System Requirements
JMeter has the following system requirements:
- Java Virtual Machine Installed: JMeter is a Java-based application, It requires the Java Runtime to run,
- CPU: we suggest multicore cpus with 4 or more cores. JMeter is heavily multithreaded and benefits from more CPU cores,
- Memory: 16GB RAM is a good value. It let's you simulate about 1000 concurrent users and leaving enough room for the Operating System,
- Disk: while JMeter not relies much on disk, having an SSD is a plus.
- Network: 1Gbps LAN recommended. JMeter simulates a huge number of concurrent users which are network bandwidth hungry!
Other system hardware specifications don't matter much.
Avoid oversized machines. Java application usually struggle with more than 16GB memory allocated.
This is due to increasing [Garbage Collections](https://www.oracle.com/webfolder/technetwork/tutorials/obe/java/gc01/index.html).
Take a look at our guide on how to optimize JMeter for more information.
Check Java Version
To check if Java is installed, running a command-line is necessary. It differs slightly depending on the Operating System:
| OS | Task | Command |
|---|---|---|
| Windows | Open Command Console | C:>java -version |
| Linux | Open Command Terminal | $:~java -version |
| Mac | Open Terminal | machine:~$ java -version |
As of JMeter 4.0, Java 8 and above are supported. For older versions, please refer to JMeter Documentation.
The command should output something like:
ubuntu@desktop:~$ java -version
java version "1.8.0_161"
Java(TM) SE Runtime Environment (build 1.8.0_161-b12)
Java HotSpot(TM) 64-Bit Server VM (build 25.161-b12, mixed mode)
Here we have Java 8, Build 161 being installed.
If you don't have Java installed, please download and install a Java JDK (Java Development Kit) from Java Download Page. For more details on how to setup Java on various operating systems, Refer to Open JDK Setup Guide.
We're ready to download and install JMeter now!
JMeter Installation
It's very easy to install JMeter since it's a simple archive:
- Download JMeter Archive,
- Unzip the archive,
- Run
jmeterexecutable inbin/folder. Executable extensions depends on OS (.batfor Windows,.shfor Linux / MaC) - JMeter should launch the UI!
After a few seconds, you should see:

Let's get to work now.
Simple Script
In this section, we are covering how to create a very simple test involving HTTPBin.
HTTPBin is a simple website offering various rest endpoints for testing purpose.
ThreadGroup
First, let's create a ThreadGroup by right clicking on the Test Plan, then Add > Threads (users) > Thread Group.
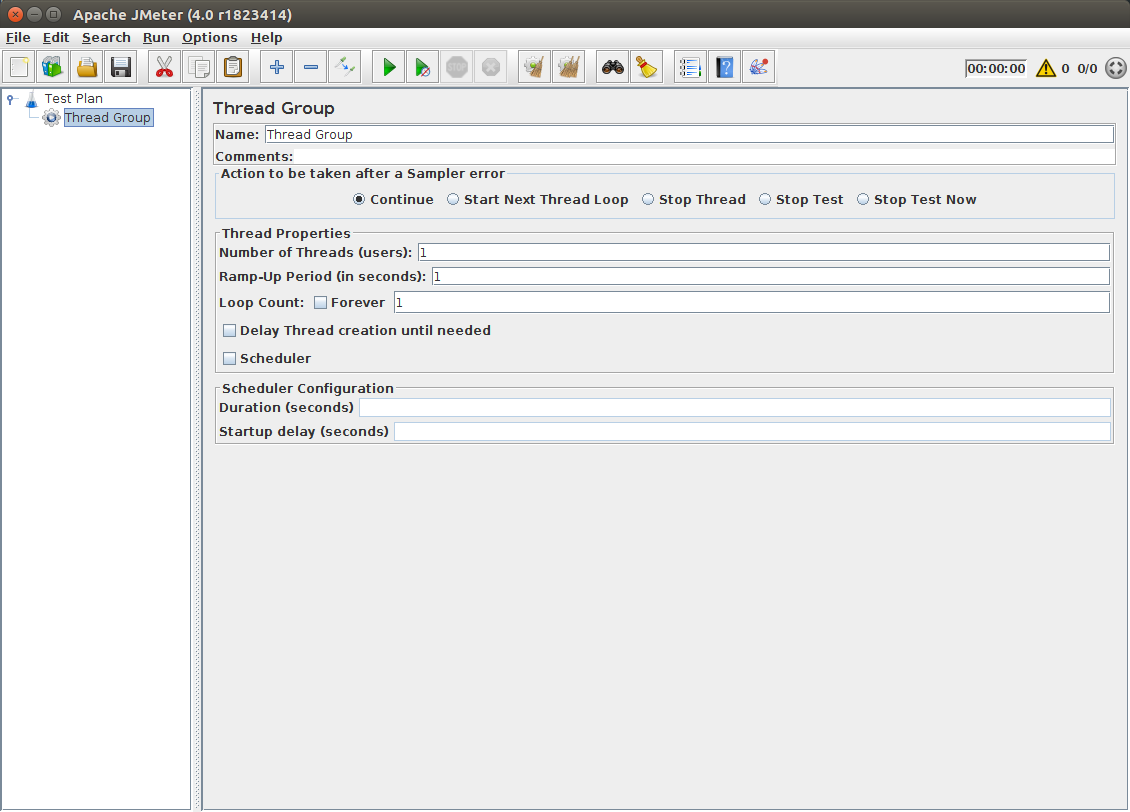
The ThreadGroup is a container for the logic which will be run by a user thread. Said otherwise, it contains all the logic which will be run by as many threads you would like in parallel.
As you can see, a ThreadGroup has many settings, with the most important being:
- Number of Threads: number of concurrent threads to run during the test,
- Duration (sec): How long should the test run in seconds.
The Thread Group Panel holds also the following settings:
-
When encountering a Sampler error: In case any error occurs during test execution, you may let the test either −
-
Continue running,
- Stop Thread to stop the current Thread,
-
Stop Test completely.
-
Number of Threads: concurrent users to simulate,
- Ramp-Up Period: linear increase the load from 0 to target load over this time,
- Loop Count: Total number of iterations the users should run,
-
Scheduler Configuration:
-
Duration: Total Test duration in seconds,
-
Startup Delay: number of seconds before the users ramp-up.
-
Scheduler Configuration: You can configure the start and end time of running the test.
Here are all the possible settings with their explanation:
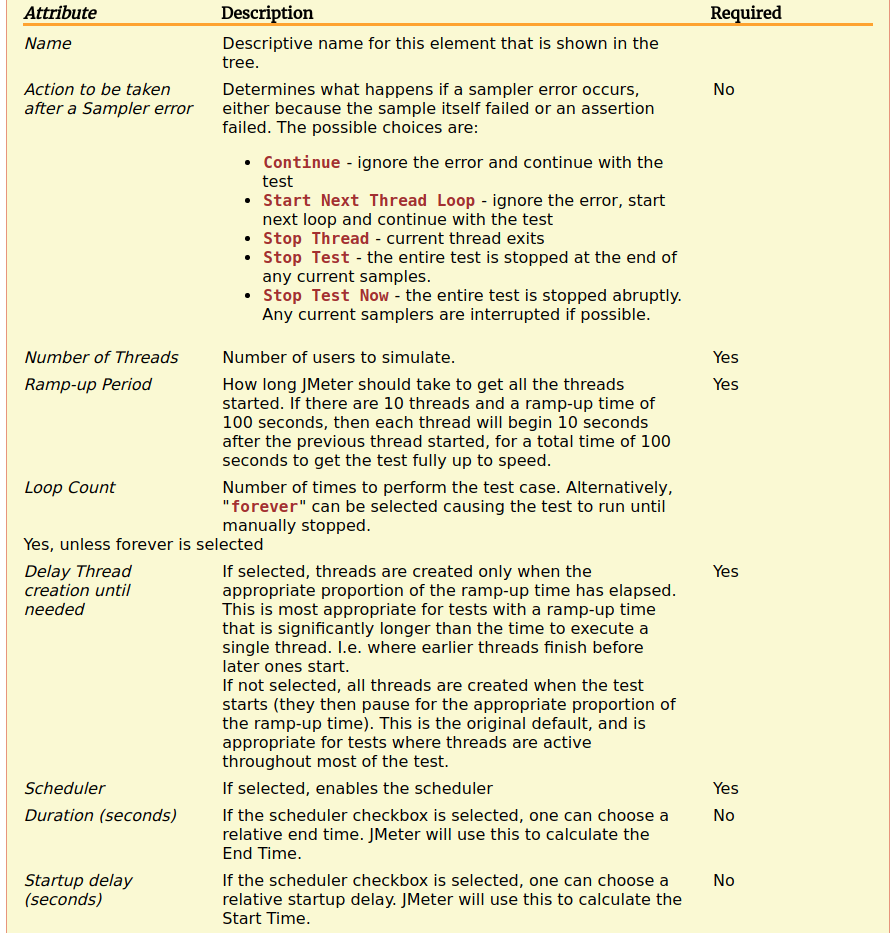
Once you master running a simple test, you can play with them to see their effect on the load test. Remember JMeter has a lot of settings, but you rarely use them all.
Http Request
Now let's add an HTTP Request.
Right-click on the ThreadGroup, then select Add > Sampler > Http Request.
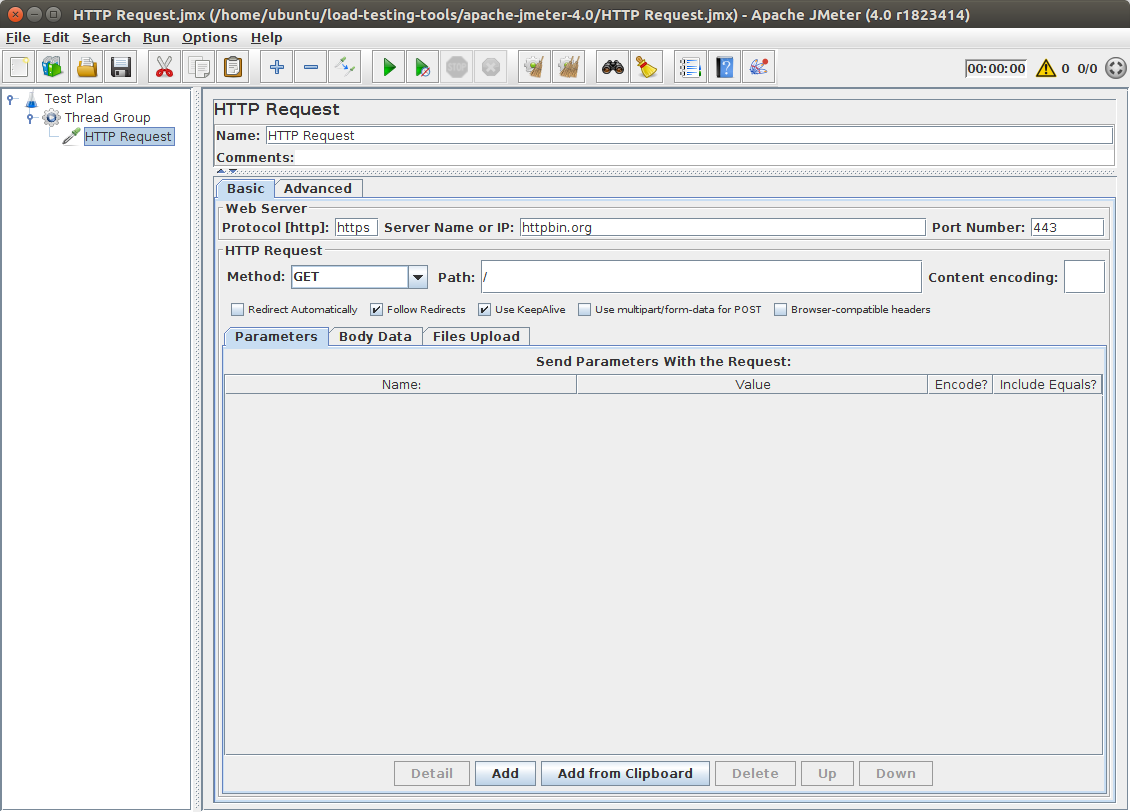
In this example, I've configured a GET Http request to https://httpbin.org:
- Protocol:
https, - Server Name or IP:
httpbin.org, - Port Number:
443(default https port, can be omitted), - Path:
/.
Again, there are many possible options here. (and these wouldn't even fit into the screen) Most of the time, you won't design Http Request from scratch. It's way better to record them using JMeter.
JMeter has a built in Recorder which allows to record all HTTP Requests while using your browser. Why not setting all requests by hand? Simply because it's unpractical. Some web application may send 100+ requests.
View Results Tree
It's now time to execute our user composed of a single request and see the results.
We going to add a View Results Tree listener. Remember this listener is only for debugging purpose.
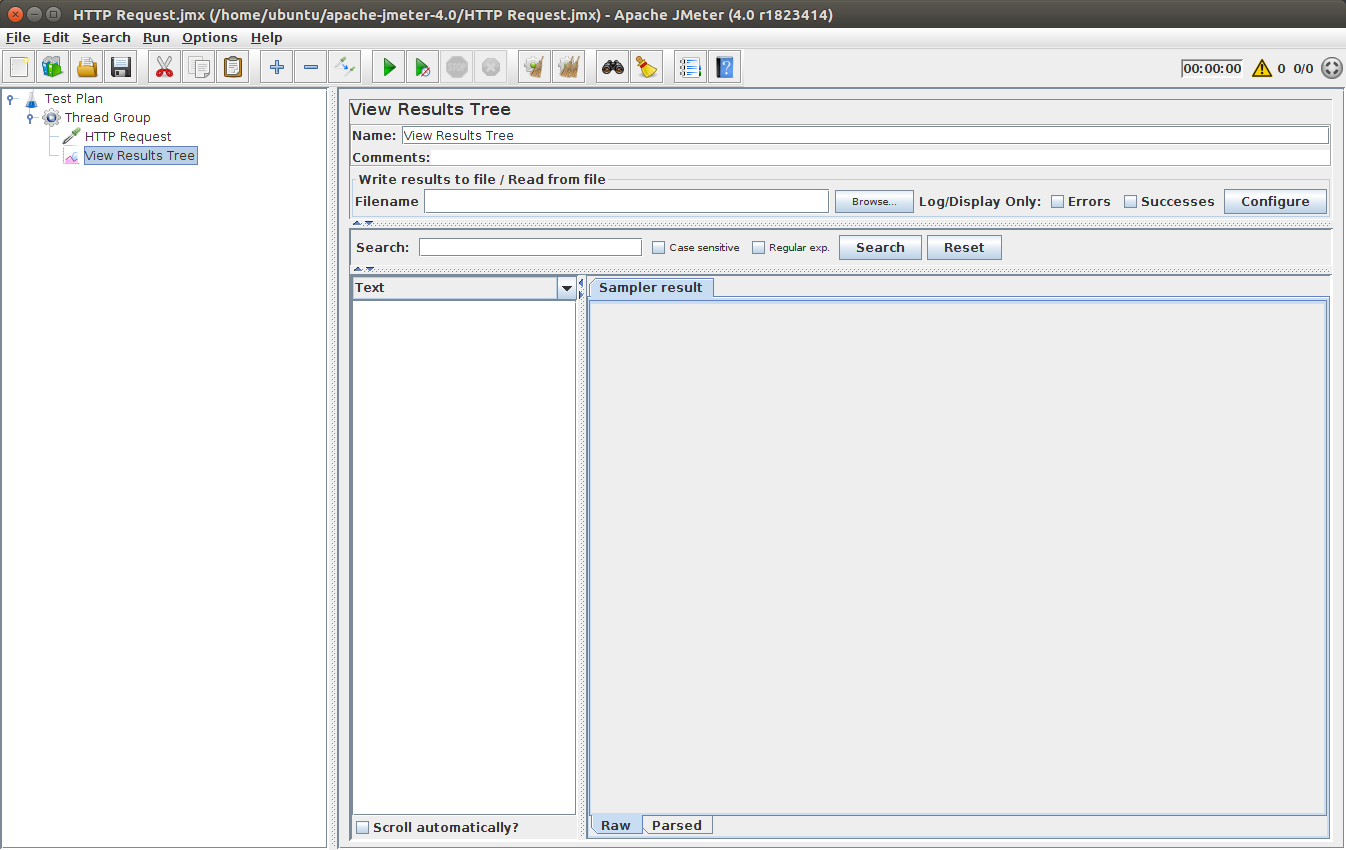
This UI listeners let's you see the results of the requests being executed. Click on Run > Start in the top menu to run the user.
Some key points here:
- Green color against the name Visit TutorialsPoint Home Page indicates success.
- JMeter stores all the requests and responses sent and received,
- Sampler Result Tab: shows JMeter metrics gathered about the request and response times,
- Request Tab: shows the request which has been played,
- Response Tab: shows the response sent by the web-server to JMeter.
The second tab is Request, which shows all the data sent to the web server as part of the request.
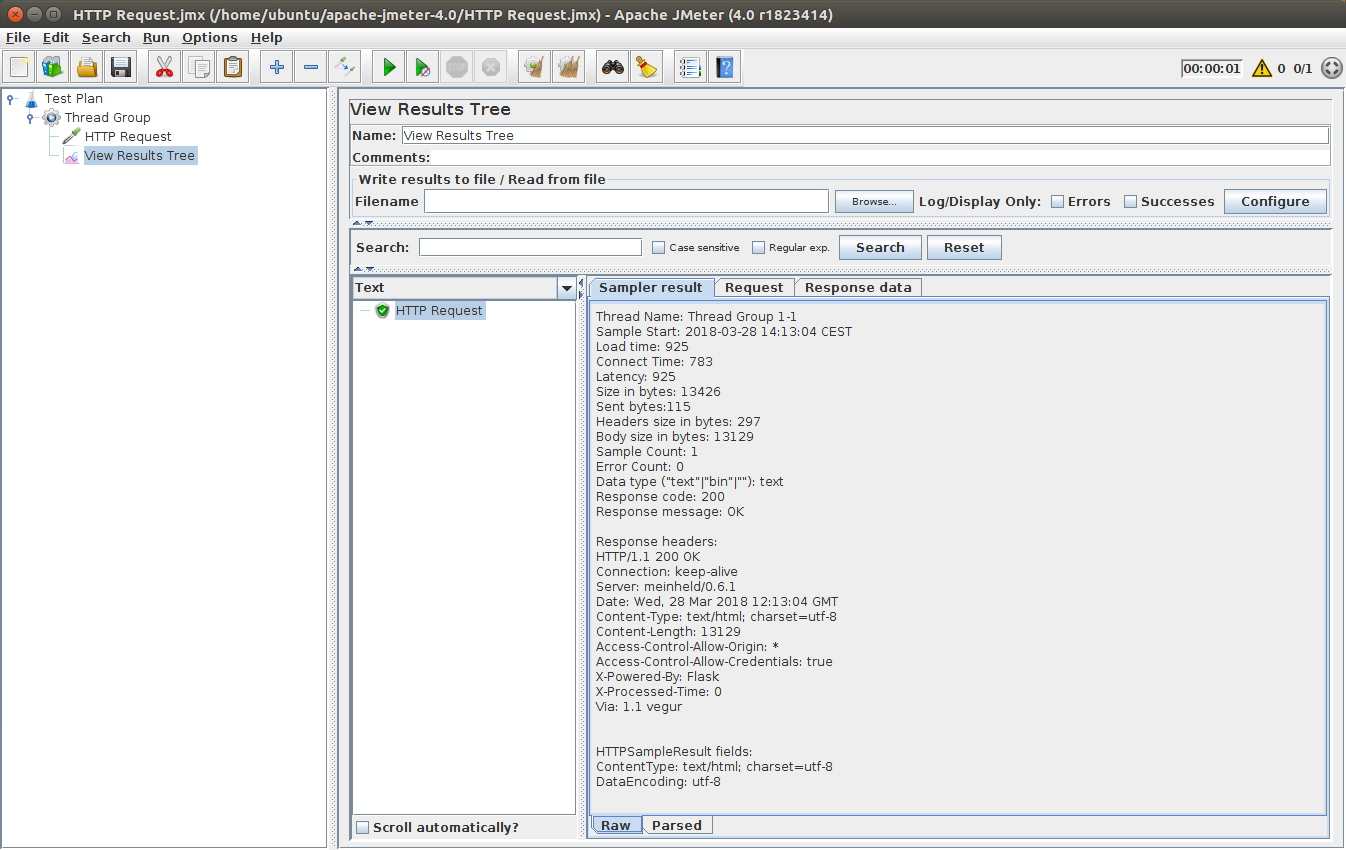
On this screen, within the Sample Result view, you should see something like:
Thread Name: Thread Group 1-1
Sample Start: 2018-03-28 14:13:04 CEST
Load time: 925 # Network Load Time in millis
Connect Time: 783 # Network Connect Time in millis
Latency: 925 # Network Latency Time in millis
Size in bytes: 13426
Sent bytes:115
Headers size in bytes: 297
Body size in bytes: 13129
Sample Count: 1
Error Count: 0
Data type ("text"|"bin"|""): text
Response code: 200
Response message: OK

Response headers:
HTTP/1.1 200 OK
Connection: keep-alive
Server: meinheld/0.6.1
Date: Wed, 28 Mar 2018 12:13:04 GMT
Content-Type: text/html; charset=utf-8
Content-Length: 13129
Access-Control-Allow-Origin: *
Access-Control-Allow-Credentials: true
X-Powered-By: Flask
X-Processed-Time: 0
Via: 1.1 vegur


HTTPSampleResult fields:
ContentType: text/html; charset=utf-8
DataEncoding: utf-8
It contains a lot of metrics about the server response time.
Of course, this listener is not designed to run multiple concurrent users and view the results. View Results Tree should be used To Debug a user execution.
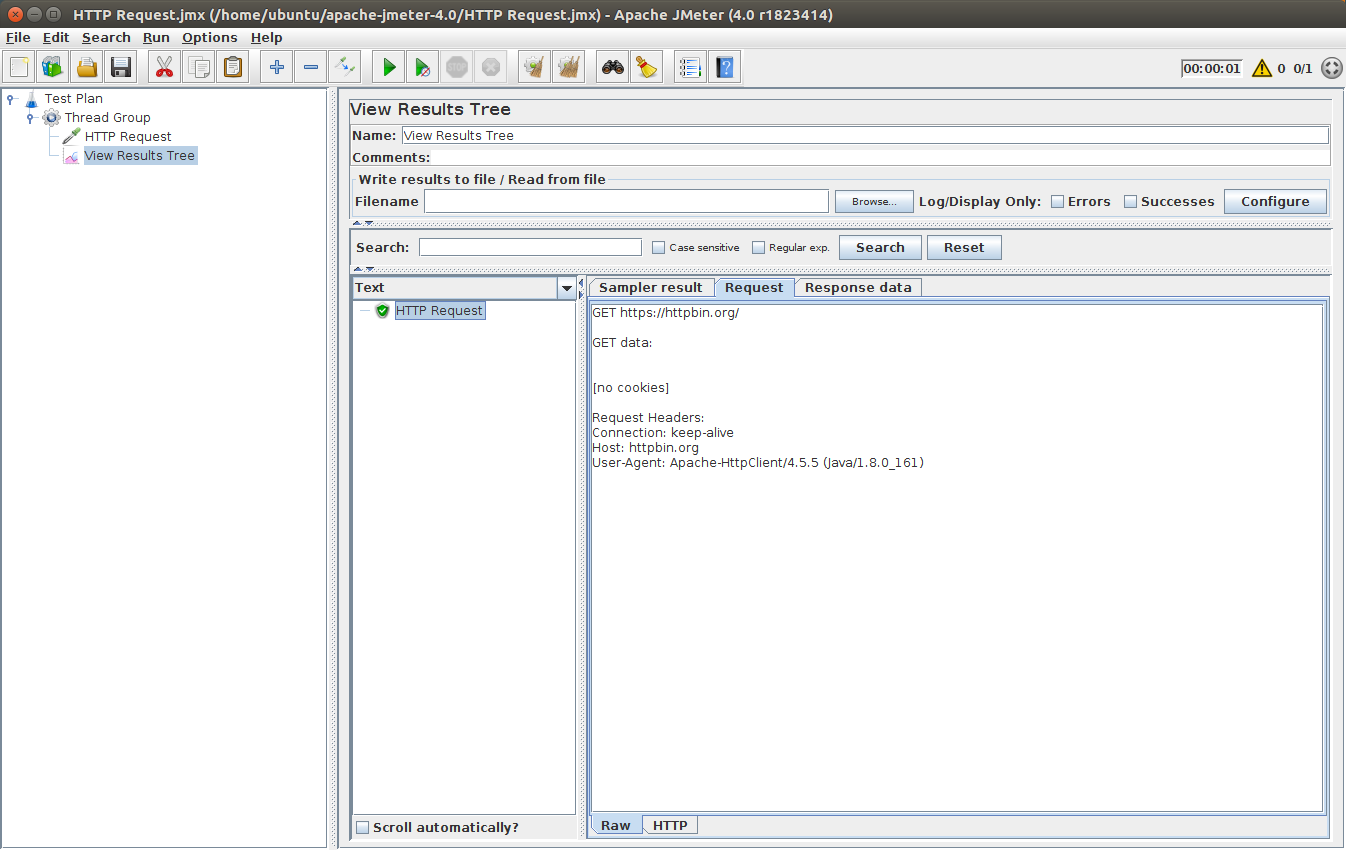
And that's the request sent by JMeter to the remote server (httpbin.org):
GET https://httpbin.io/

GET data:


[no cookies]

Request Headers:
Connection: keep-alive
Host: httpbin.org
User-Agent: Apache-HttpClient/4.5.5 (Java/1.8.0_161)
As we can see, JMeter uses Apache-HttpClient/4.5.5 (Java/1.8.0_161) (which is a Java HTTP Client library) to send the request.
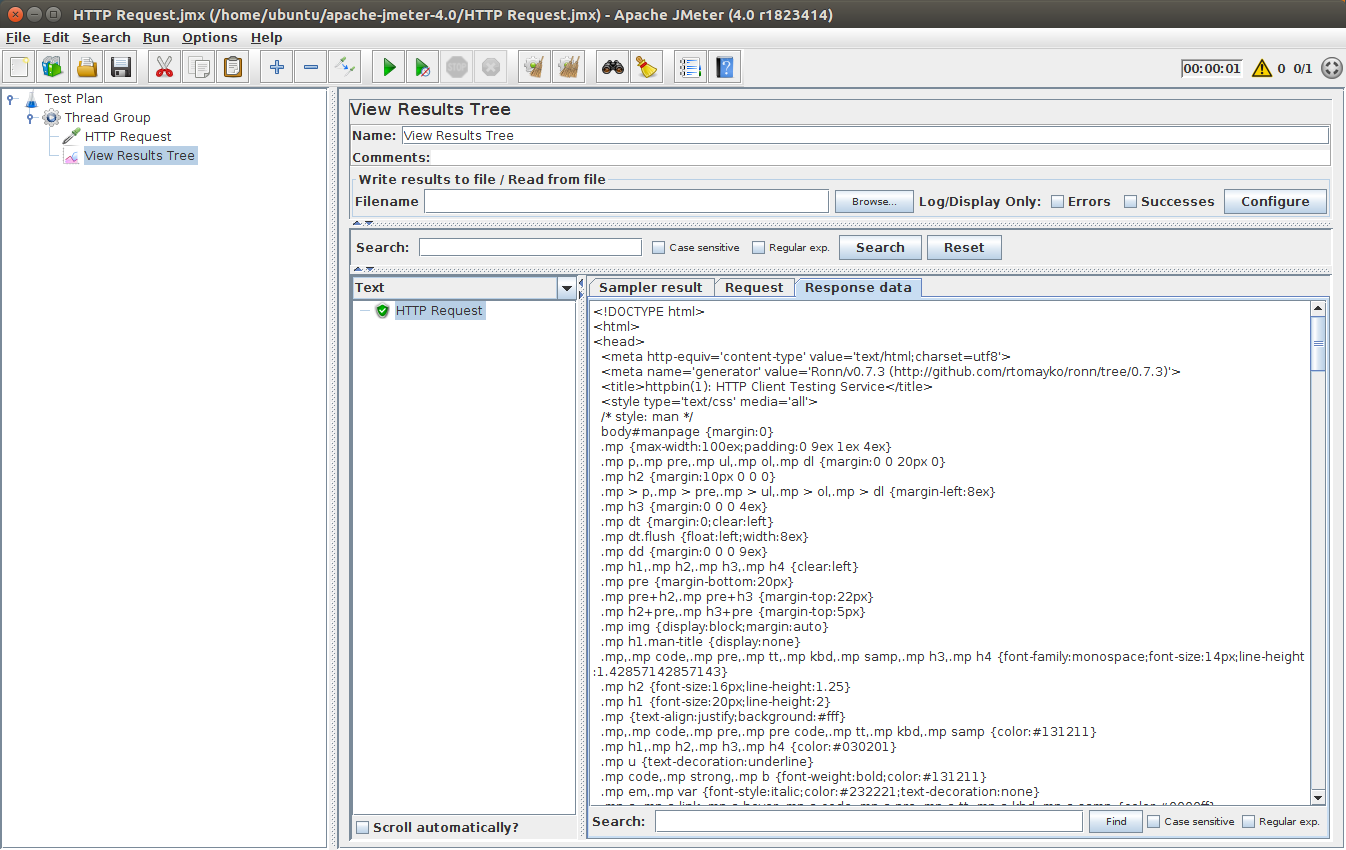
The server sends the HTML of the web-page as a response:
<!DOCTYPE html>
<html>
<head>
  <meta http-equiv='content-type' value='text/html;charset=utf8'>
  <meta name='generator' value='Ronn/v0.7.3 (http://github.com/rtomayko/ronn/tree/0.7.3)'>
  <title>httpbin(1): HTTP Client Testing Service</title>
  <style type='text/css' media='all'>
  /* style: man */
  ...
So, you have seen how easy it's to create a sample user which sends a request to a given web application.
You did it! The beginner tutorial introducing JMeter is now complete. Don't hesitate to play with the tool and test different combinations, that's the best way to learn.
By the way, If you want to dig further regarding Results Collection and Analysis, check our JMeter Result Analysis article.
Is the tutorial finished? Absolutely not!
Advanced Script
Now that we have covered a pretty basic JMeter usage, let's explore a more complete one. Download The Example JMX and open it in your JMeter.
Why are we interested in this example? Because it covers probably the most important topic related to load testing: Correlating dynamic parameters.
What you are going to learn here:
- Extracting Data into variables from a Server Response using Regular Expression Extractor,
- Reinjecting extracted variables into subsequent requests,
- Design a dynamic behaving virtual user.
For this, we are going to use our JPetstore Demo application.
JPetstore JMX
You can Download The Example JMX and open it in your JMeter.
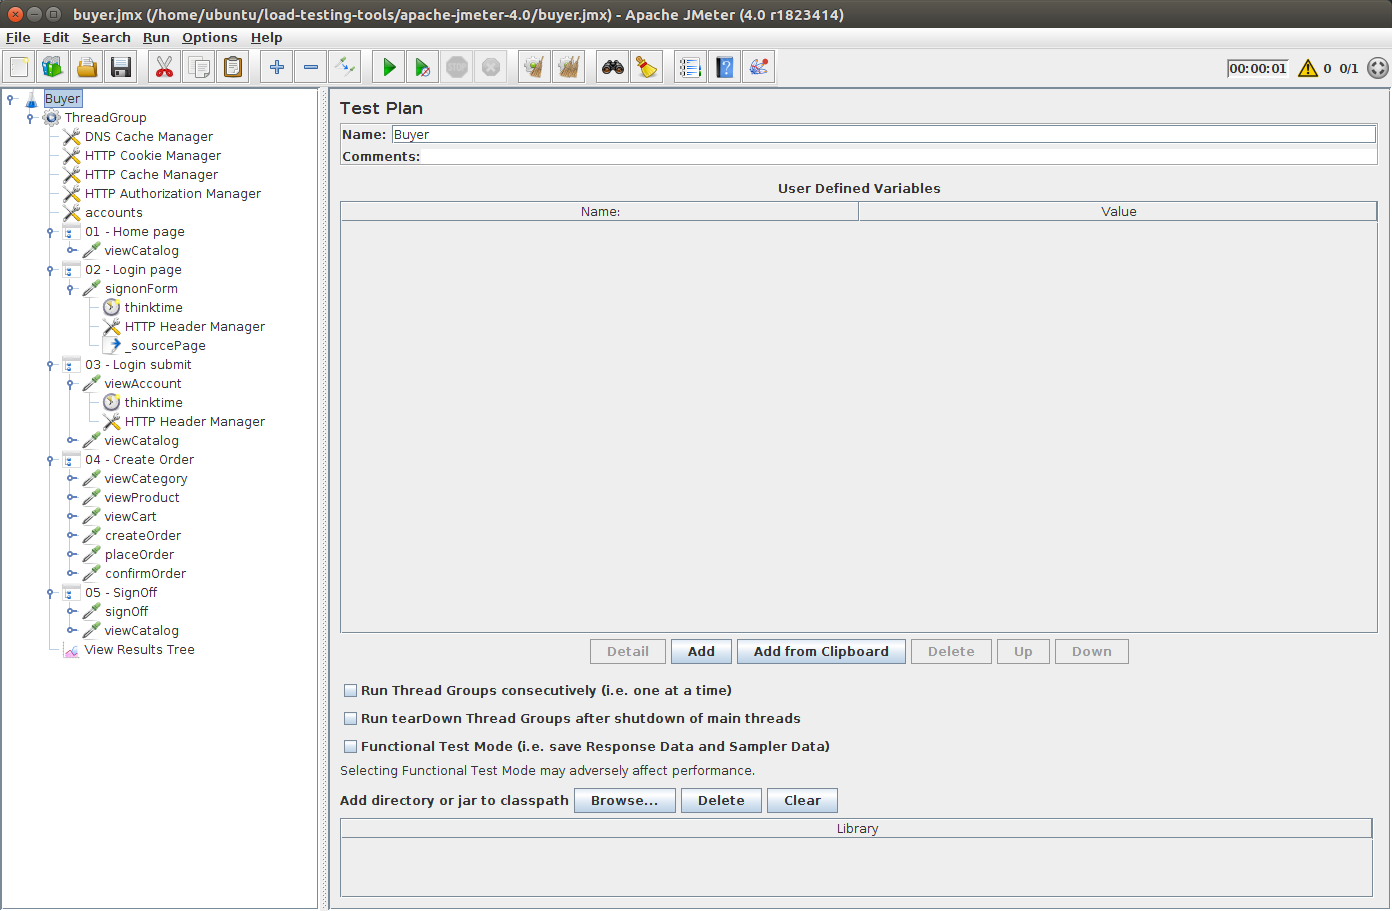
So, what does the JPetStore buyer do? Typically it does:
- Sign in into his account,
- View the catalog,
- Select a random category,
- Select a random product from previously selected category,
- Add the product to cart,
- Order the product within the cart,
- Sign off.
That's a pretty common simulation for an Ecommerce online shop.
Let's see what the Buyer ThreadGroup contains:
- DNS Cache Manager: configure the user DNS settings,
- HTTP Cookie Manager: enables cookie management (required to properly handle user sessions),
- HTTP Cache Manager: simulates the behavior of a browser which caches requests to speed up page loading,
- Accounts CSV Data Set Config: points to a csv file
accounts.csvcontaining all the login and passwords of the simulated users, - 01, 02, ... etc: Business transactions containing the HTTP Requests to the Petstore.
HTTP Requests are grouped within transaction controllers to provide meaningful metrics during the load test. We're typically interested to see how long it takes to create an order for example.
Accounts CSV
On an ecommerce shop, every customer has its own account. So we need to simulate that too.
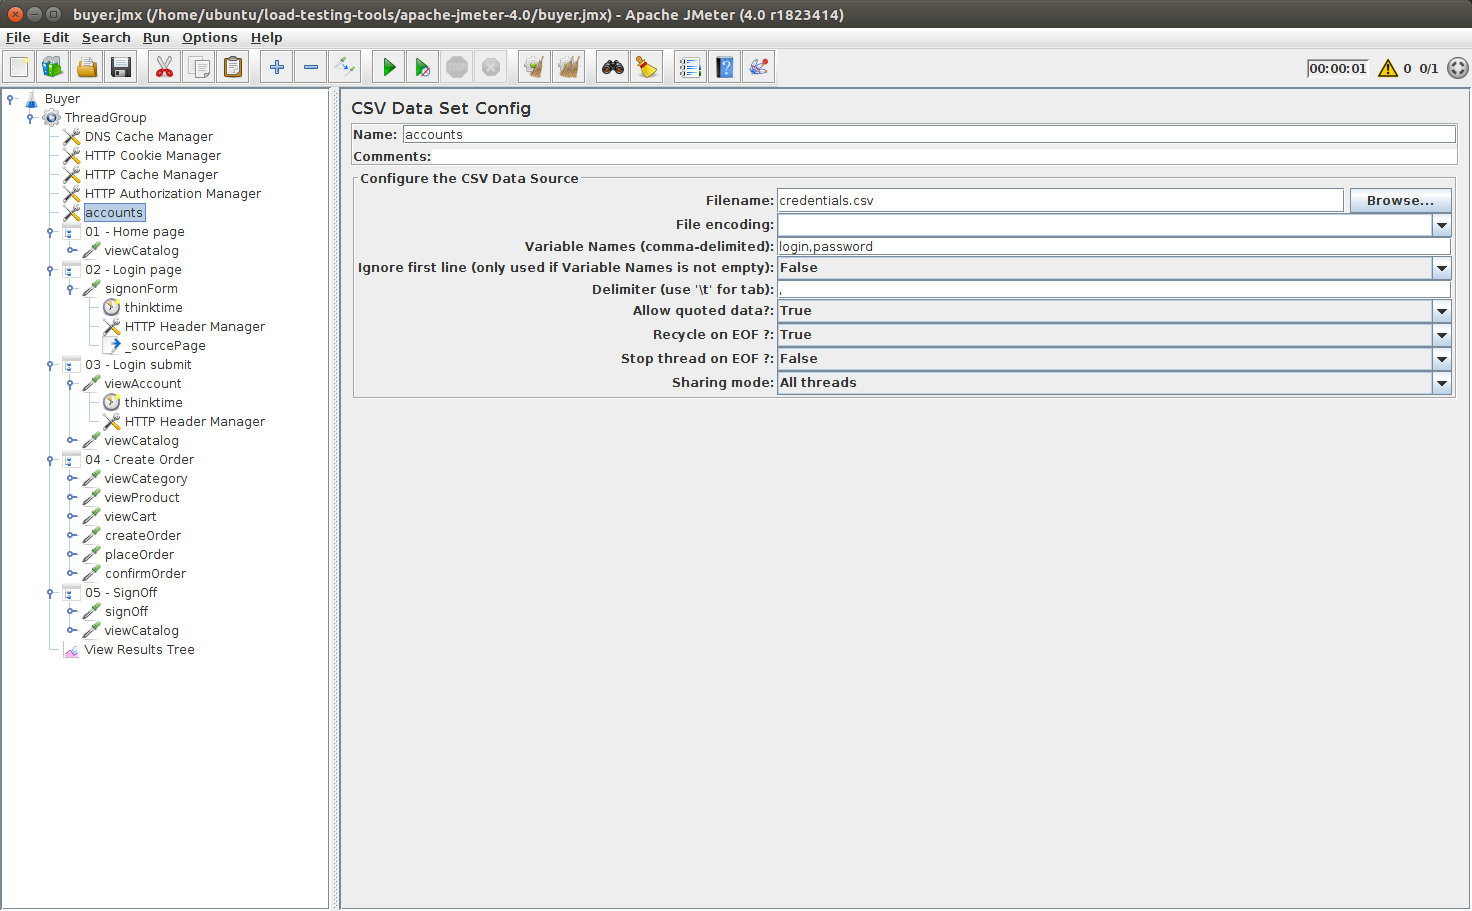
To do this with JMeter, we add a CSV Dataset Config. It points to a csv file containing the following lines:
user1,pass
user2,pass
user3,pass
user4,pass
j2ee,j2ee
As you can see, it's configured to set variables login and password. These variables will contain the data and will change on every user iteration.
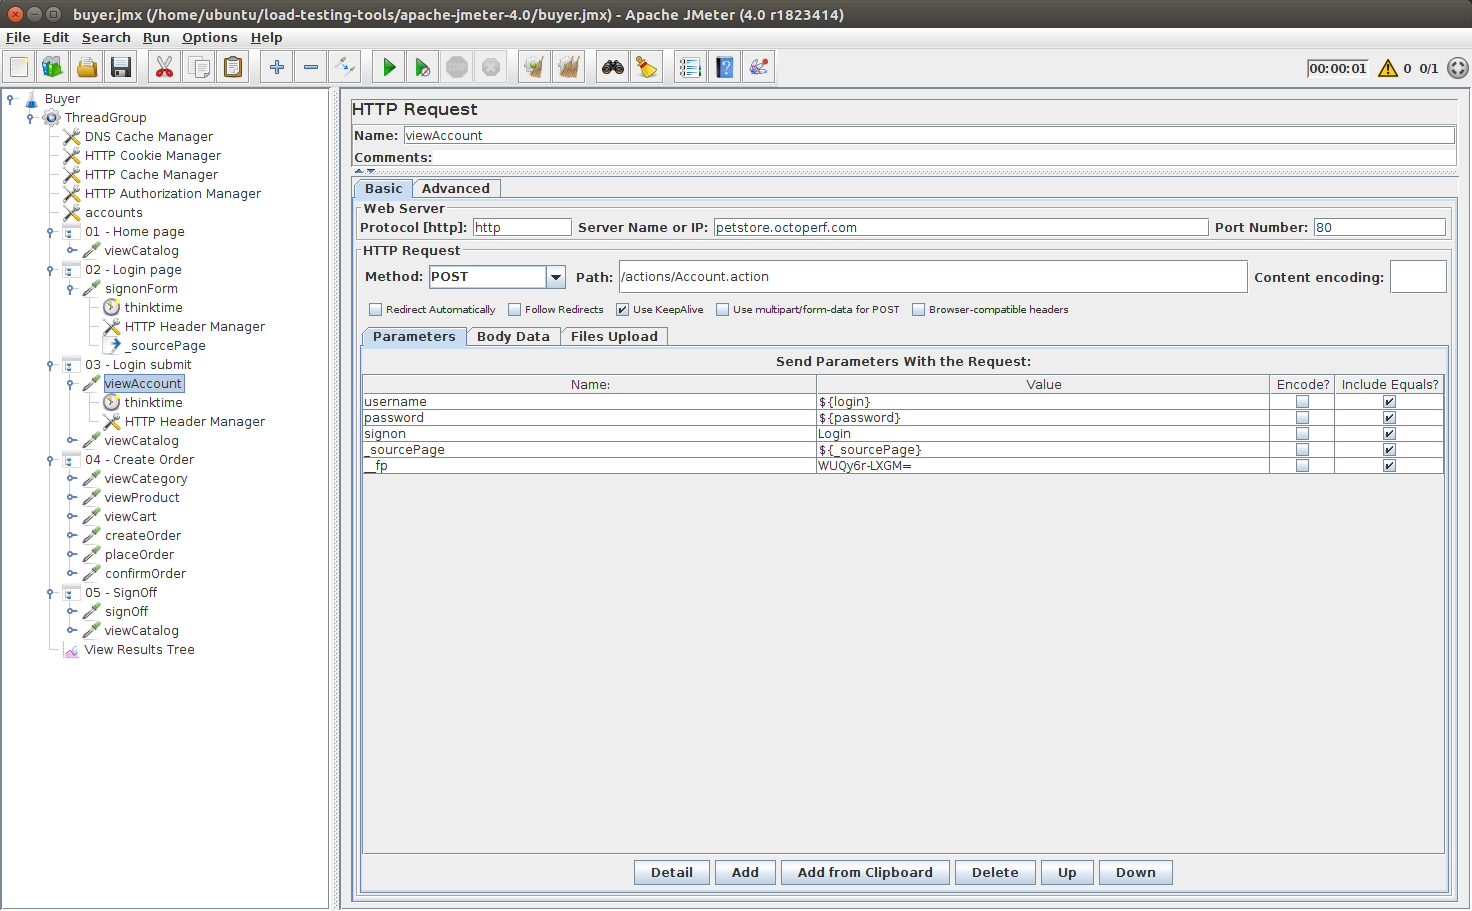
Here you can see that we replaced the login and password field values by their respective variables. That's it! Now you have each user taking a different account to login.
You may also have noticed the _sourcePage parameter value which has been replaced by ${_sourcePage}. This is a dynamic parameter we have handled.
Dynamic Parameters
That's probably the most important thing to understand when load testing:
Dynamic parameters are parameters within requests which are subject to change on every run. These parameters are sent in previous server responses.
You need to correlate them. That means, applying this 4 steps procedure:
- First identify a dynamic parameter: usually it's an odd value which looks cryptic, Here source page was equal to
RbLmXwd9bLS0l...., - Try to find this cryptic value in a previous server response: execute the script to get them,
- Use either a Regular Expression Extractor or a Json Extractor to extract the value into a variable for later use,
- Replace the value within the request by the variable.
If you master this procedure, you have already acquired 95% of the knowledge needed by a Performance Tester.
You thought it was more difficult than that? It isn't, really! It's really that simple.
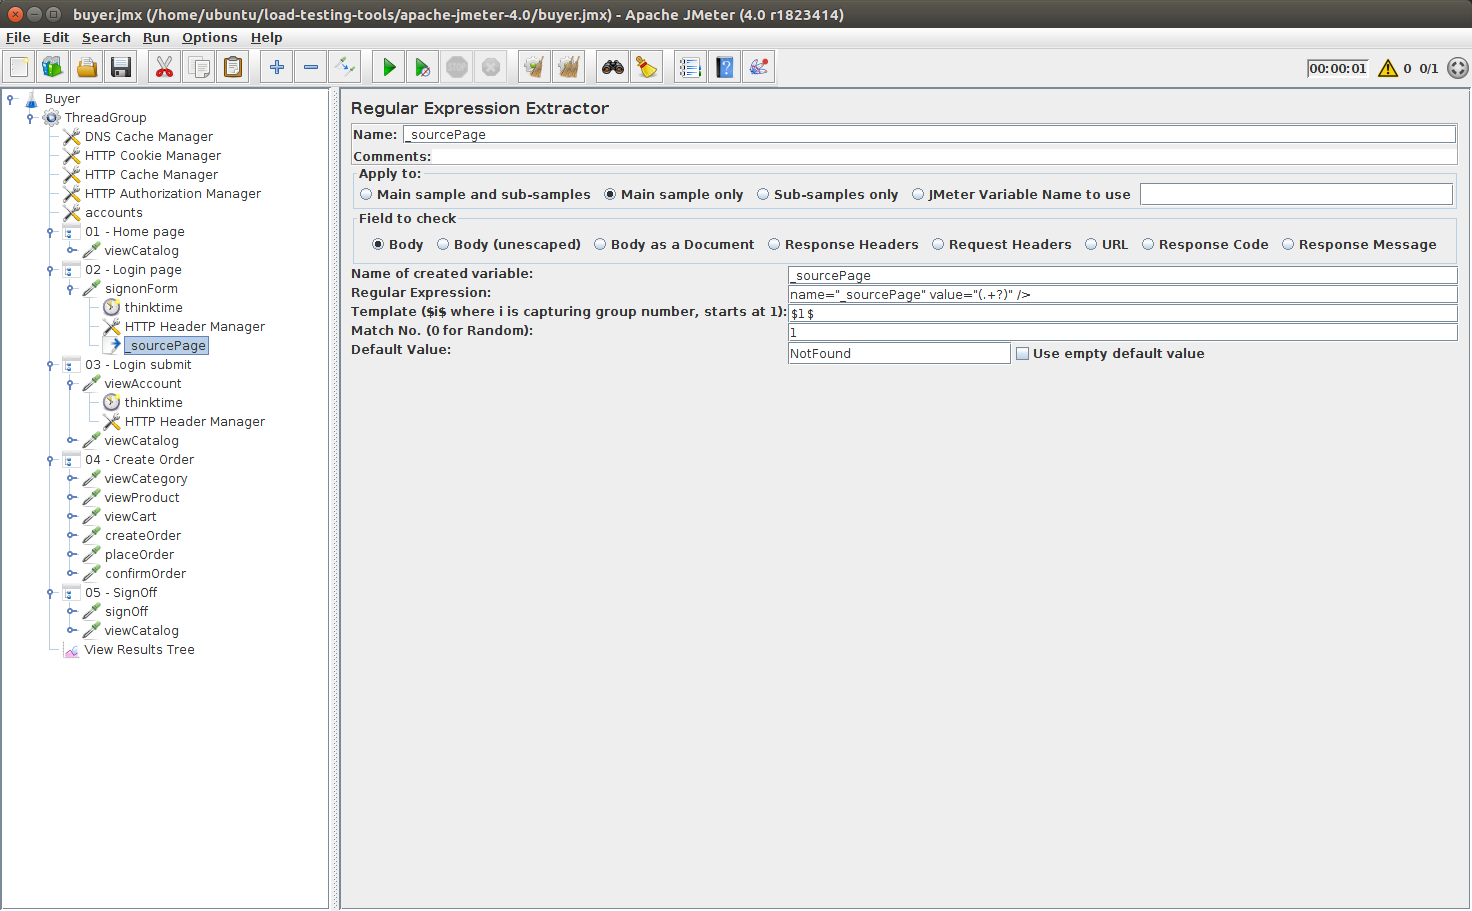
Here we defined a regexp extractor on the request whose response contains the subsequently used dynamic parameter _sourcePage:
- Name:
_sourcePage, - Regular Expression:
name="_sourcePage" value="(.+?)" />, - Template:
$1$, - Match Nr:
1.
Why is the extractor configured so? Let's take a look at the server response:
xhtml
...
<input size="14" name="keyword" type="text" />
<input name="searchProducts" type="submit" value="Search" />
<input type="hidden" name="_sourcePage" value="RbLmXwd9bLS0lXS4vxD5i9ALa0GScuGthmpmYNfIaBJFM3w8lW9rYA==" />
<input type="hidden" name="__fp" value="qk2Y7WYMqKs=" />
...
I have truncated the response for readability purpose. As you can see, those dynamic parameters are hidden form parameters. This kind of parameters are usually set to protect the website from SpamBots or Cross-Site Request Forgery.
Regular Expressions should be part of the tools you know well. They are heavily used to extract content from server responses.
Random Behavior
Now, let's take care of extracting random categoryId and productId variables to simulate a dynamic user.
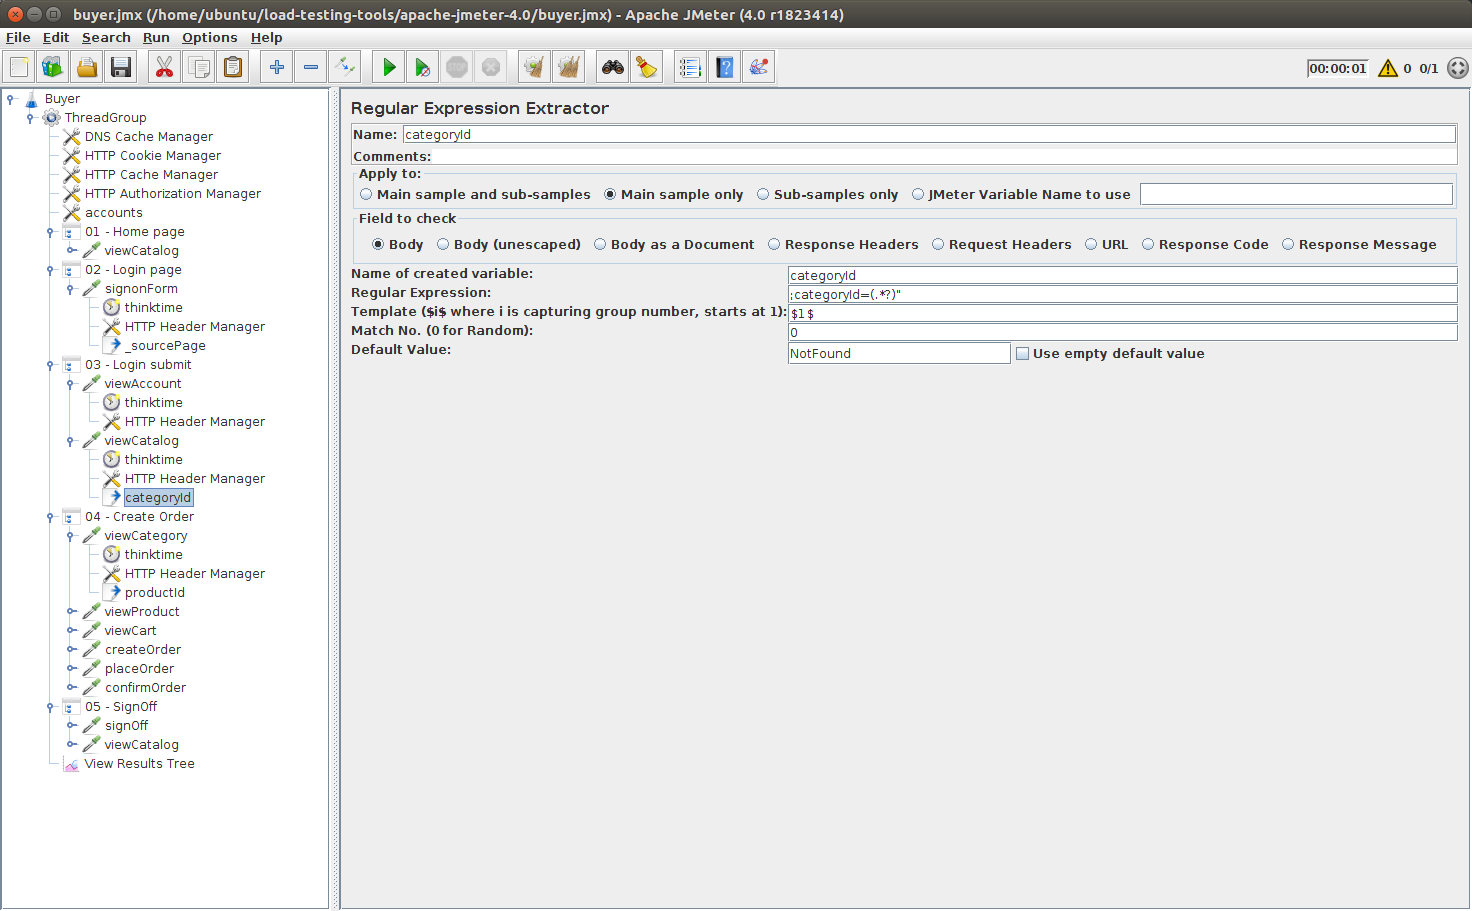
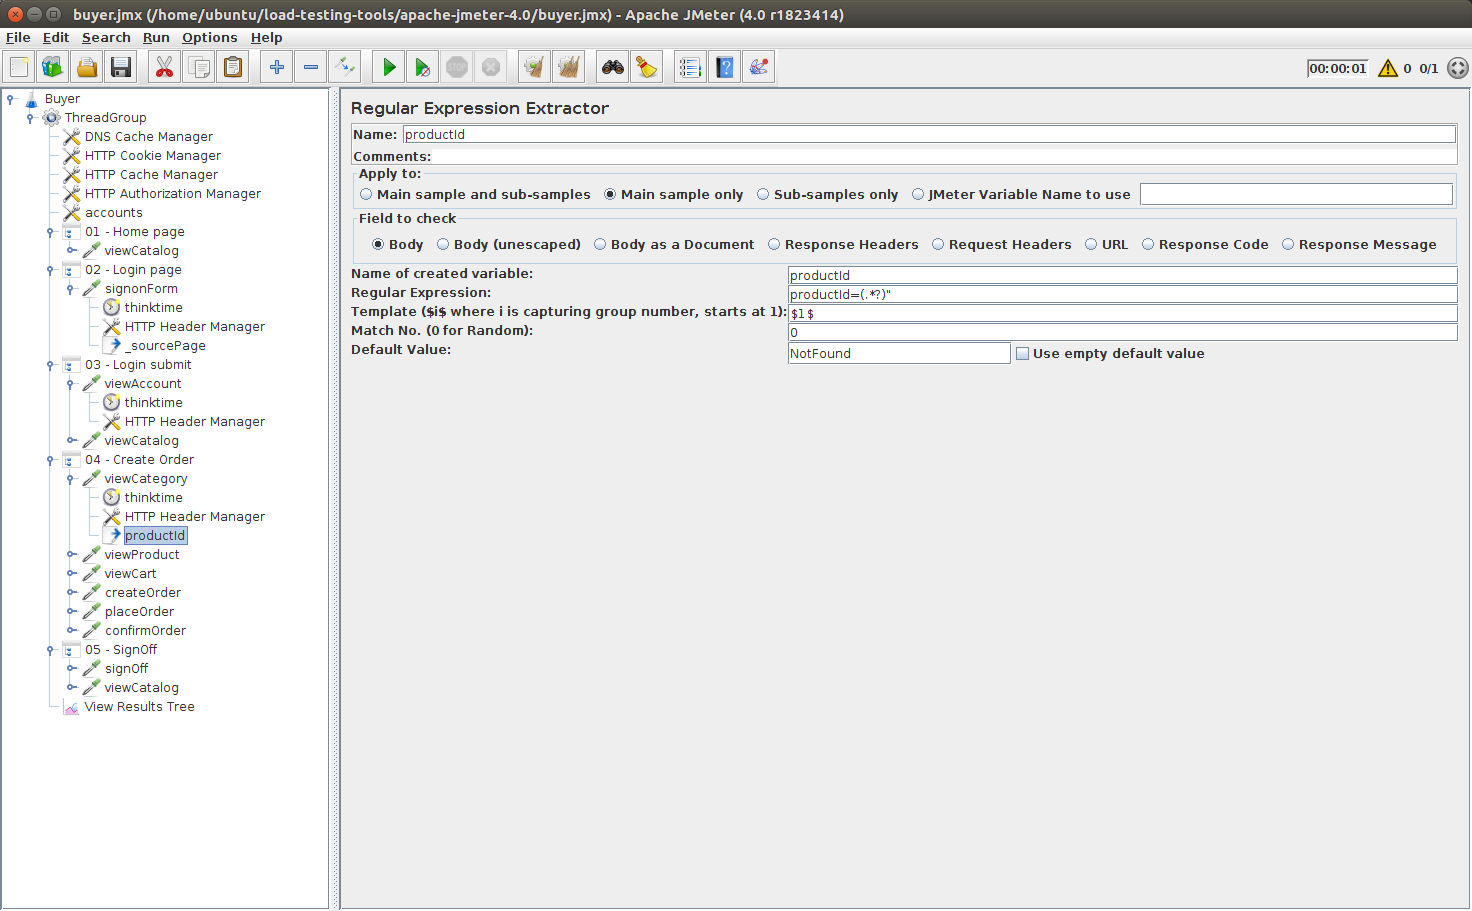
Again, we performed the extractions on the pages containing those ids:
- categoryId: comes from the page listing all product categories,
- productId: comes from the page listing all products within a category.
Then, we reuse those variables in subsequent requests. It's time now to run the user!
Results
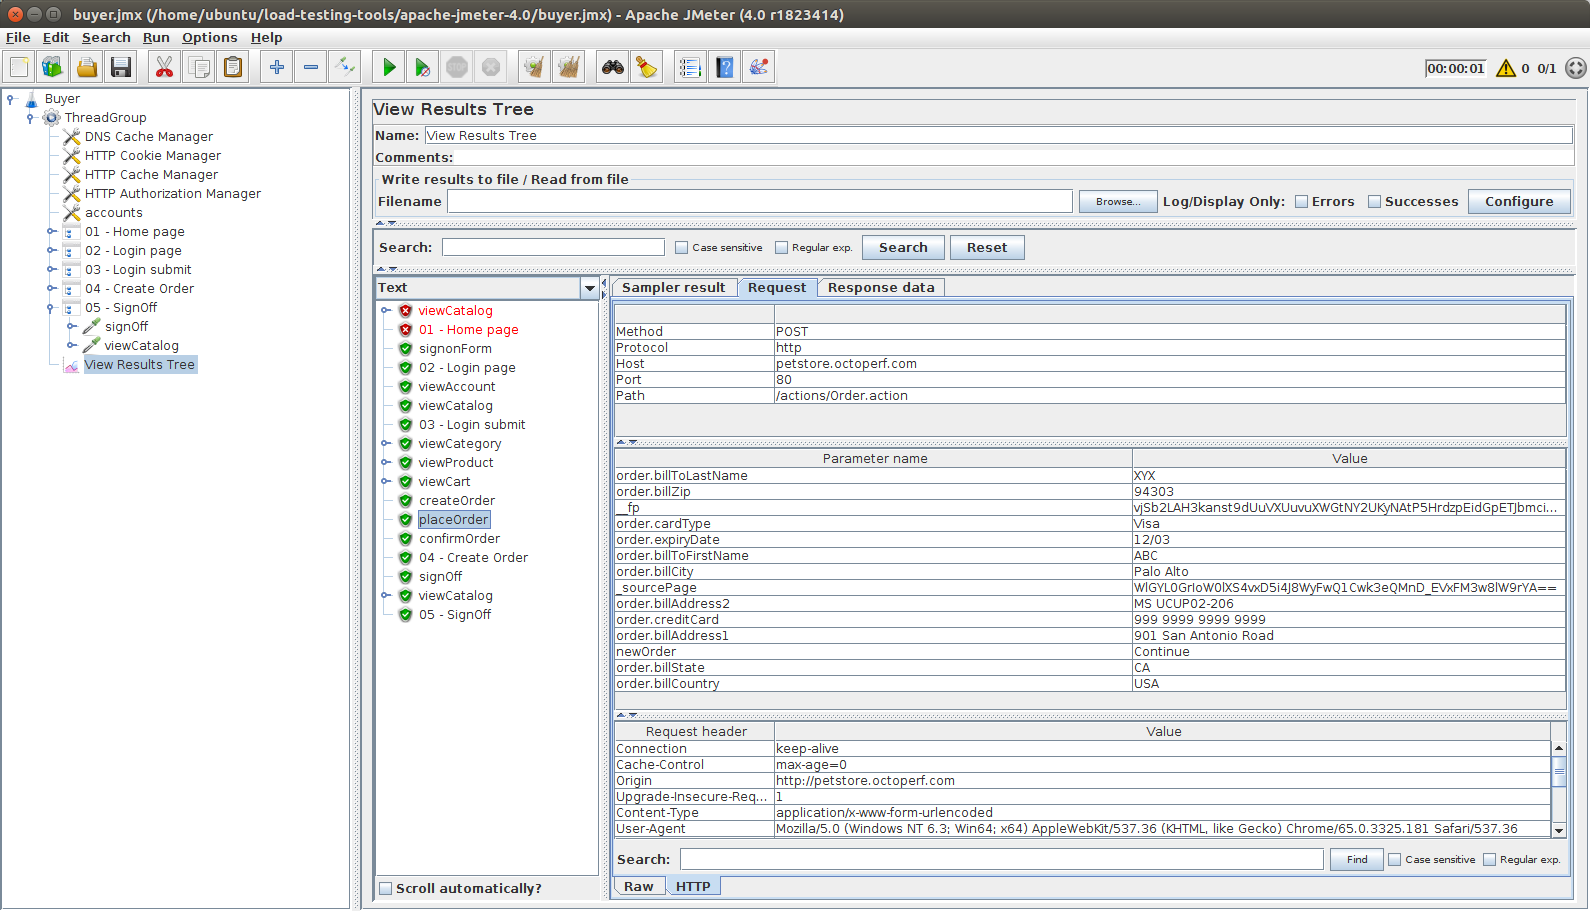
I've added a View Results Tree to view all the requests and responses being sent and received. Some notes about the execution:
- Some Requests in Red: it comes from an embedded resources parsed from the homepage which generates an HTTP 404 Not Found,
- _fp and _sourcePage parameters: those values should change on each run if they have been handled correctly.
Conclusion
At this tutorial reaches an end, you are now mastering some very important JMeter Aspects:
- Creating a thread group which performs an HTTP Request to a web application,
- Debugging thread groups using a View Results Tree and interpreting the results,
- Creating a dynamically behaving script by extracting random information from server responses,
- Handling dynamic parameters (that's the most important thing to know!),
- Extracting content from server responses using Regular Expressions,
- Use multiple accounts to login each concurrent user.
You're definitely a Performance Tester if you master all those concepts! And trust me, that's not difficult, practice makes perfect.

