Performance Test Results Trend Analysis
In this post we are going to look at how you can spot trends in your performance test results and use this trend analysis to help shape the way you address performance testing. Performance testing can generate a large volume of performance test data and using this data to define your future performance testing coverage, scope and volumes can really add benefit to your non-functional testing process.
To use data to support performance testing you are going to need to store it in a way that makes it accessible and comparable. The ideal solution and one we will discuss in this post is to store this data in a database. This post will look at the positive benefits of storing lots of performance data, especially data that spans a significant period of time, and we will look at ways of using this data to define performance test coverage and identify areas of performance concern.
Benefits of storing results data
What is the problem with not just relying on your latest set of results is a very valid question.
The answer is nothing really, you run a set of performance tests, and you have a set of non-functional requirements that you are measuring against and if you application meets these your application performs.
That sounds fine, but by only relying on a single set of results you can miss more subtle performance issues.
Let’s look at a very simple example to show you what we mean. Imagine these are a set of performance test results:
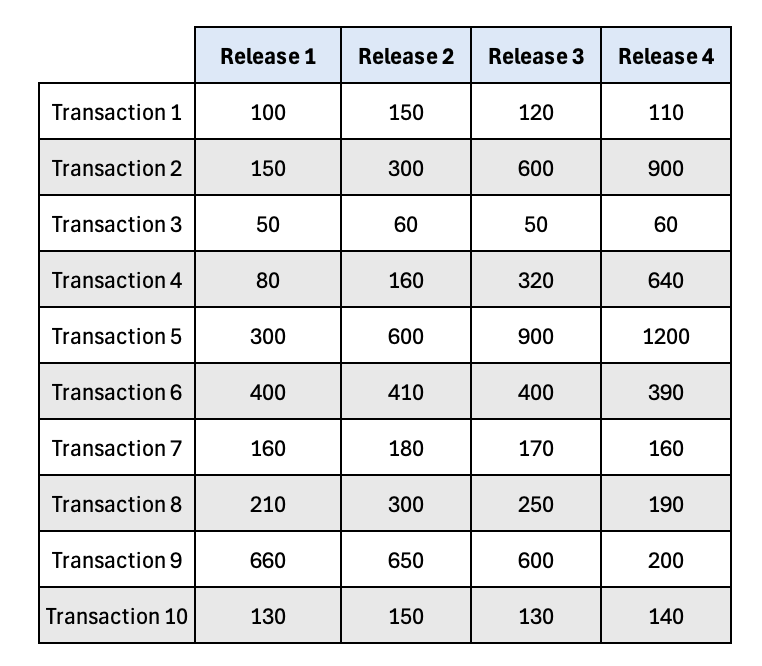
With the same results shown in a graphical format.
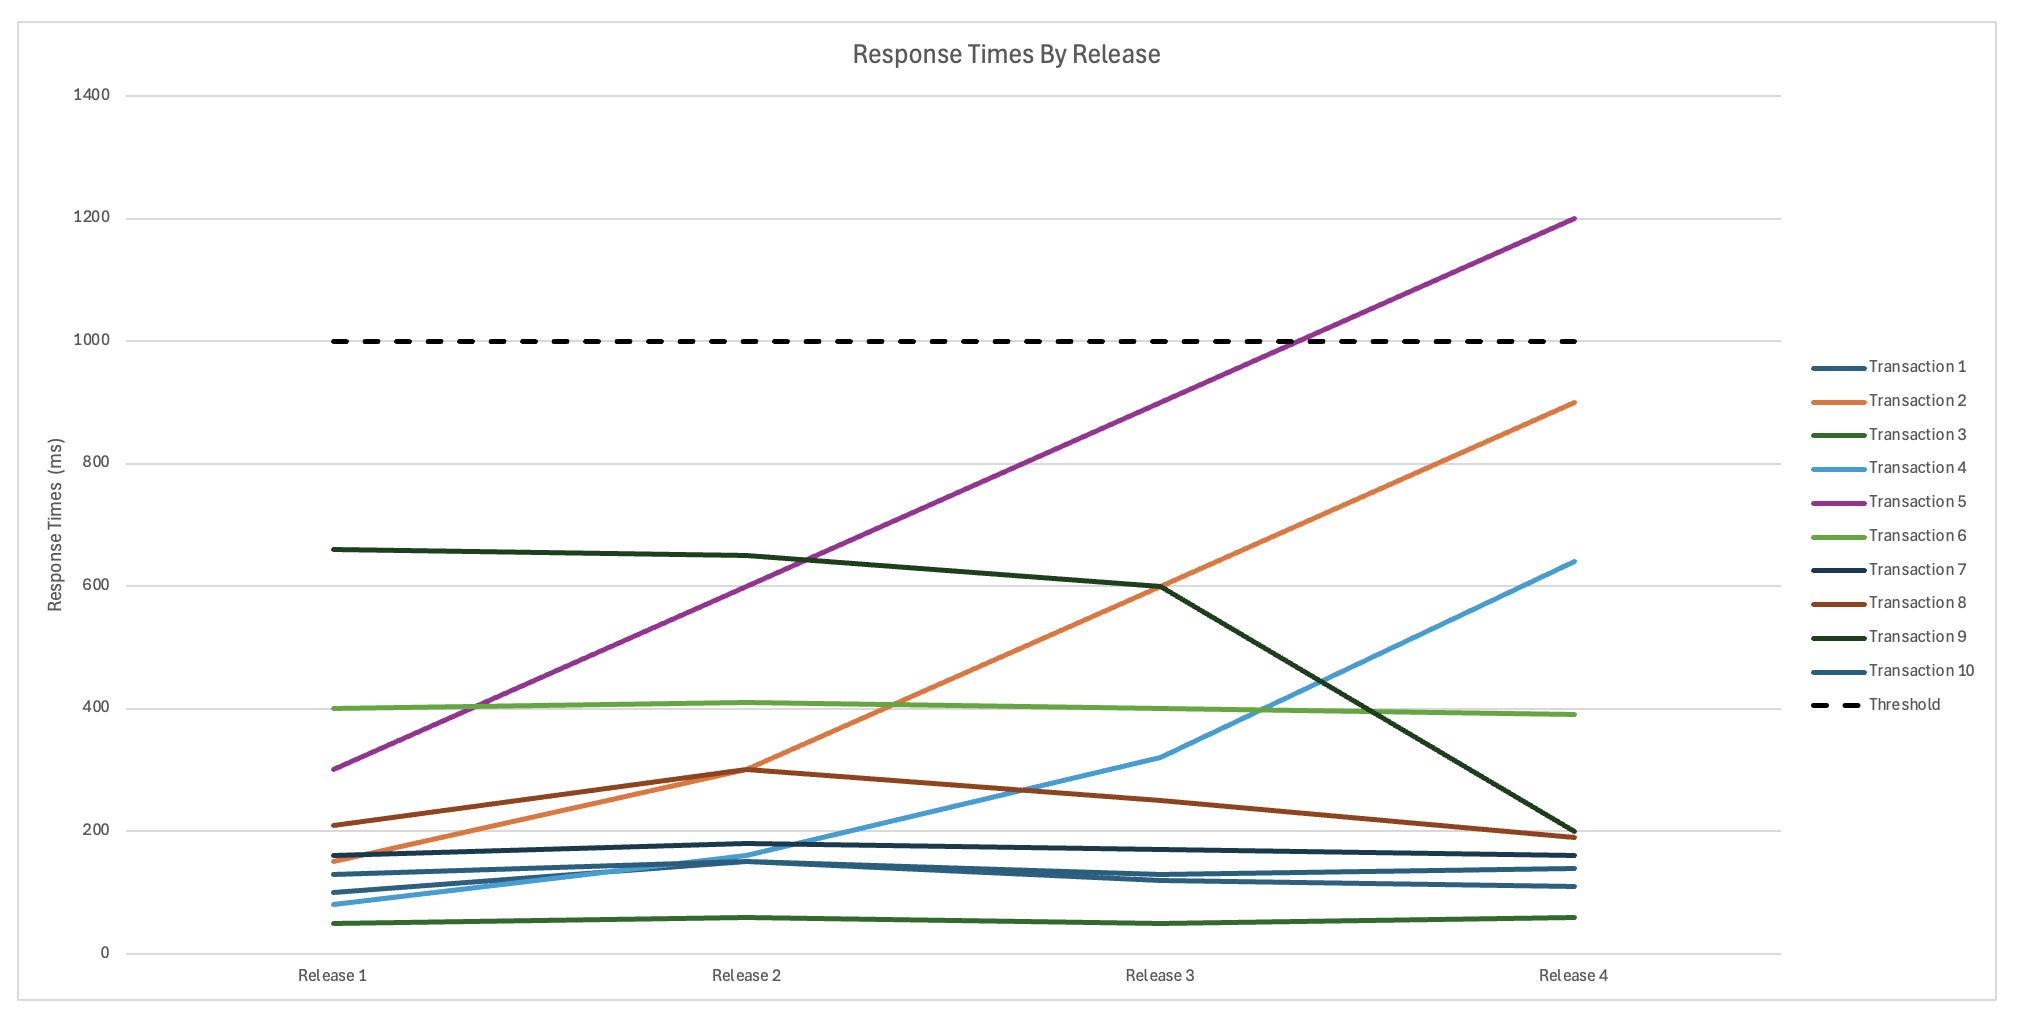
These represent a set of performance tests against an application over several releases. We have added a Performance Threshold line to the graph to show what all response times need to meet to satisfy the non-functional requirements, the threshold is set at 1000ms. If you were to look at each set of results independently you would consider Releases 1 to 3 to be acceptable and sign off for promotion to production. You would probably note in Release 4 that Transaction 5 has exceeded its requirement by 200ms, and this would trigger a defect and some investigation and possible another code release.
These is nothing wrong with this approach to performance testing result analysis. However, if you look at the results collectively using the additional data to try and spot trends you could have prevented Release 4 having a transaction that exceeds it requirement. You can also spot that you have seen a significant performance improvement in Release 4 which would be good to investigate further.
Let’s look at this in more detail. We will remove the transactions that remain consistent across all Releases so we can get a clearer picture of how the response time that have changed vary over the Releases.
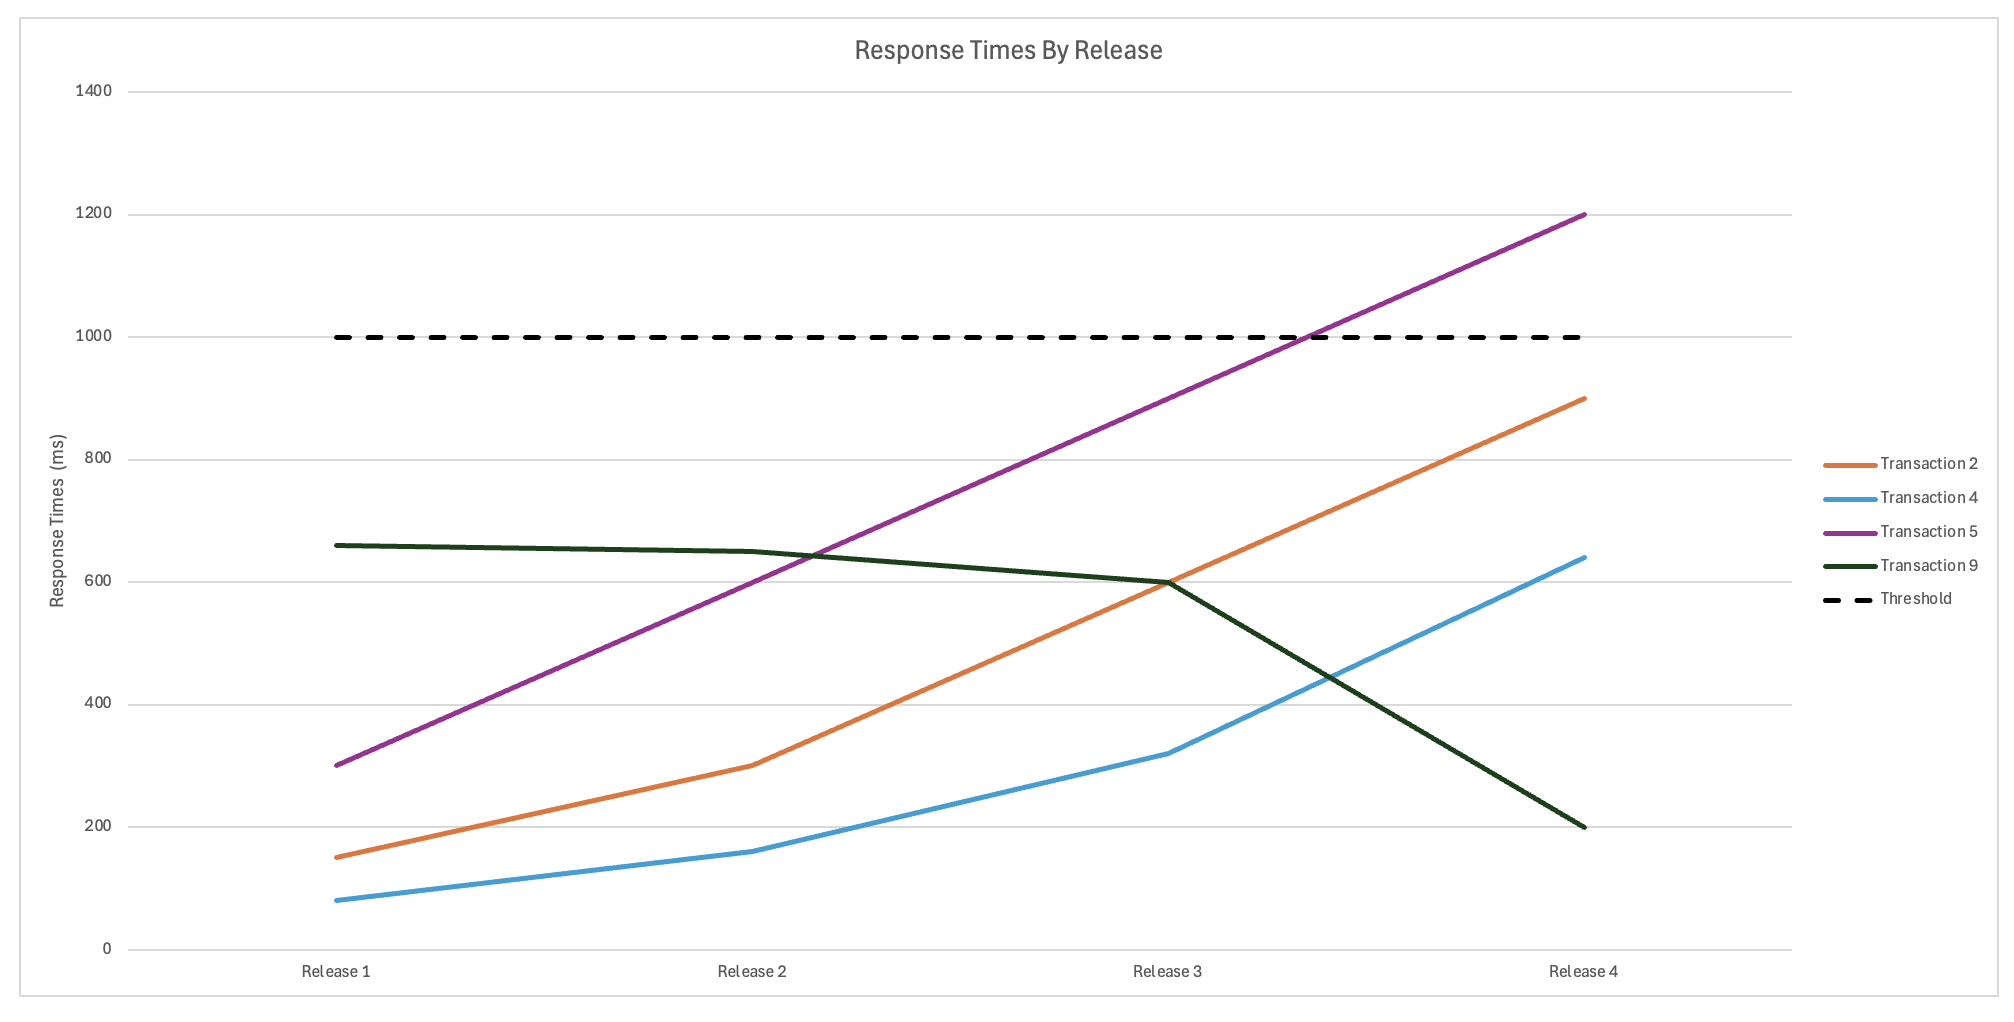
This shows us that Transaction 5 has been regressing slowly since the first Release and the linear growth indicates that it will continue to slow over time. The reason for this could be anything but is you are using this form of results analysis on a regular basis you would have been able to hypothesise that Release 4 would see Transaction 5 exceed its requirement in terms of response time. What is also obvious is that Transactions 2 and 4 are starting to exhibit similar behaviour and the likelihood that these will exceed their response time requirement when you reach your next release is quite high. You can therefore start to investigate why you are seeing this regression for these transactions and what can be done to improve this before the next release.
Not all response times have regressed, Transaction 9 has improved significantly in the latest release, this behaviour may have been missed when analysing the results independently rather than collectively. Another benefit of analysing test results this way is that you can now discuss with the development teams what has been done to improve Transaction 9, maybe there was a refactoring of code, or a change to the SQL. Regardless of the solution you can look at whether the improvement made to Transaction 9 could improve other transactions, this is not something you could pursue if you did not have a full set of data to compare against.
Storing and analysing results
We have looked at why using historical data to compliment your current results can provide benefits for spotting potential future issues and clearly showing any improvements in performance. We are going to now look at ways you might go about analysing this data.
The first step is you need to get your results from your performance testing tool into ideally a database or if you do not have a database at your disposal then a spreadsheet would work equally as well. We will not look in detail at how you would insert your test results into a database or spreadsheet as this is really a subject for a whole separate blog post. There is a blog post on Machine Learning that provides a step-by-step instructions on how you can write your test results to a SQLite Database. This is a step-by-step solution to storing your test data in a database and one that can be used on either your local machine, a load injector or a cloud-based container. Equally there are other database technologies that you can use with the solution being like the one documented in the Machine Learning blog post albeit with some changes notably to the database driver being used and possibly the SQL Syntax. Equally you can keep your latest test results in a spreadsheet and compare your results from this. In the above link to the Machine Learning blog post there is a point where the JMeter test creates a .csv file at this point you can import this into a spreadsheet for analysis. For the purposes of the remainder of this blog post we will assume you have found a suitable solution for storing historical results and we will look at the easiest ways to analyse this. We will give examples of using a database and a spreadsheet.
Analysis from a database
We are going to assume that if you have decided on a database technology and can write results from your .jtl files into the database based on the examples given in the Machine Learning blog post. In our simple example we have created a database called OctoPerf_Data_Trend.db and this contains 3 tables called:
- OctoPerf_Trend_Analysis_Releases
- OctoPerf_Trend_Analysis_Full_Results
- OctoPerf_Trend_Analysis_Thresholds
These three tables contain release data and result data that mirrors the example we have discussed in the Benefits section of this blog post.
If we execute a Select query against the first table:
SELECT * FROM OctoPerf_Trend_Analysis_Releases
We see that it contains:

And if we execute a Select query against the second table:
SELECT * FROM OctoPerf_Trend_Analysis_Full_Results
We can see it contains:
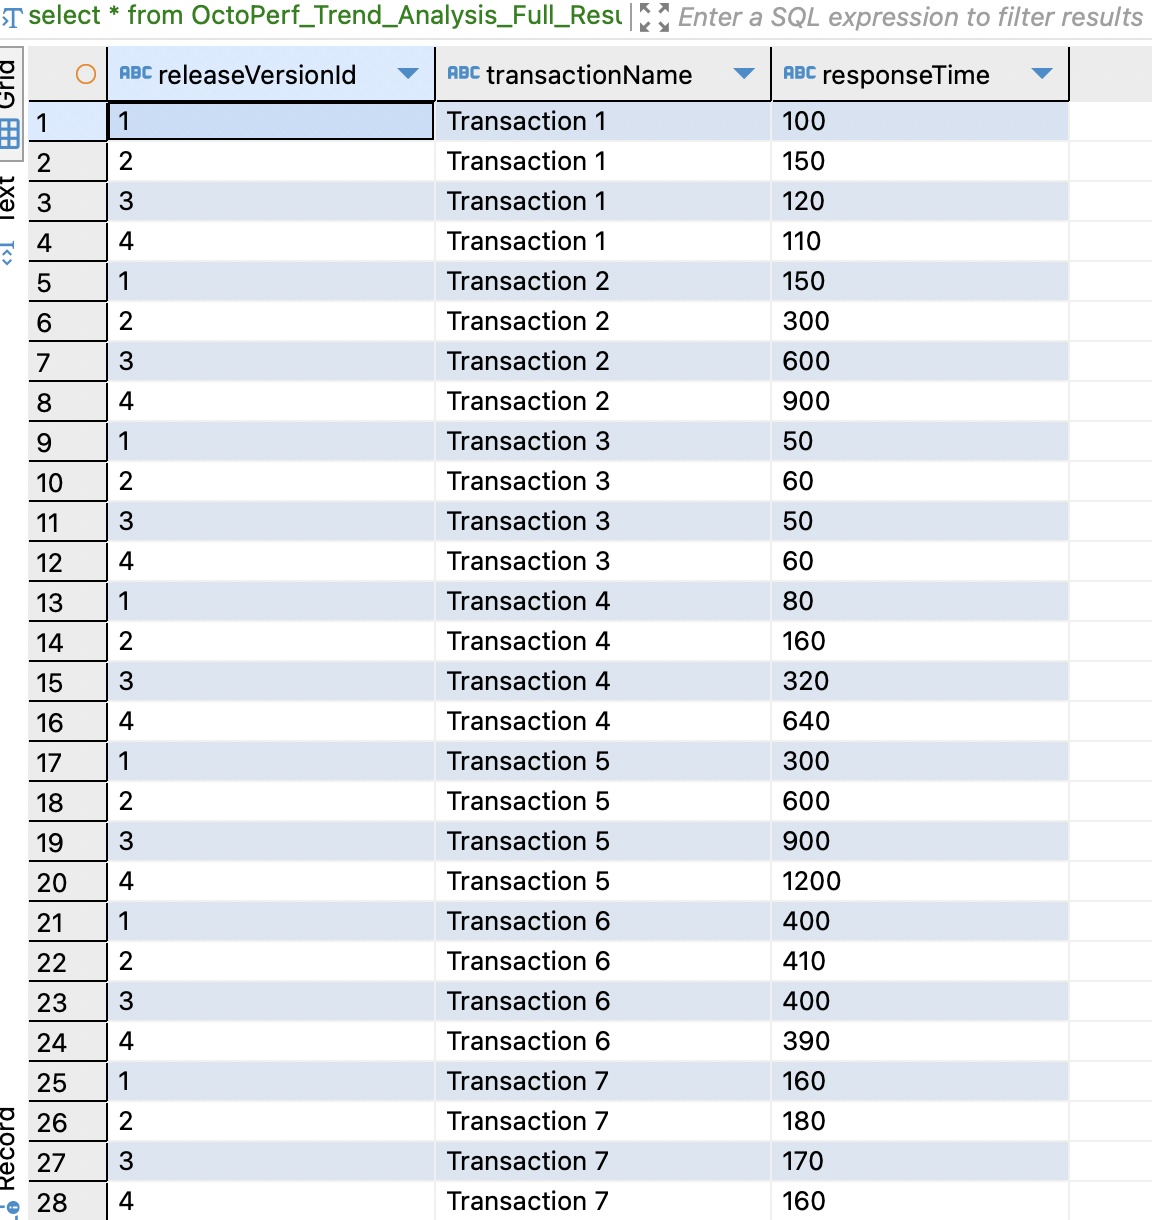
And if we execute a Select query against the third table:
SELECT * FROM OctoPerf_Trend_Analysis_Thresholds
We can see it contains:
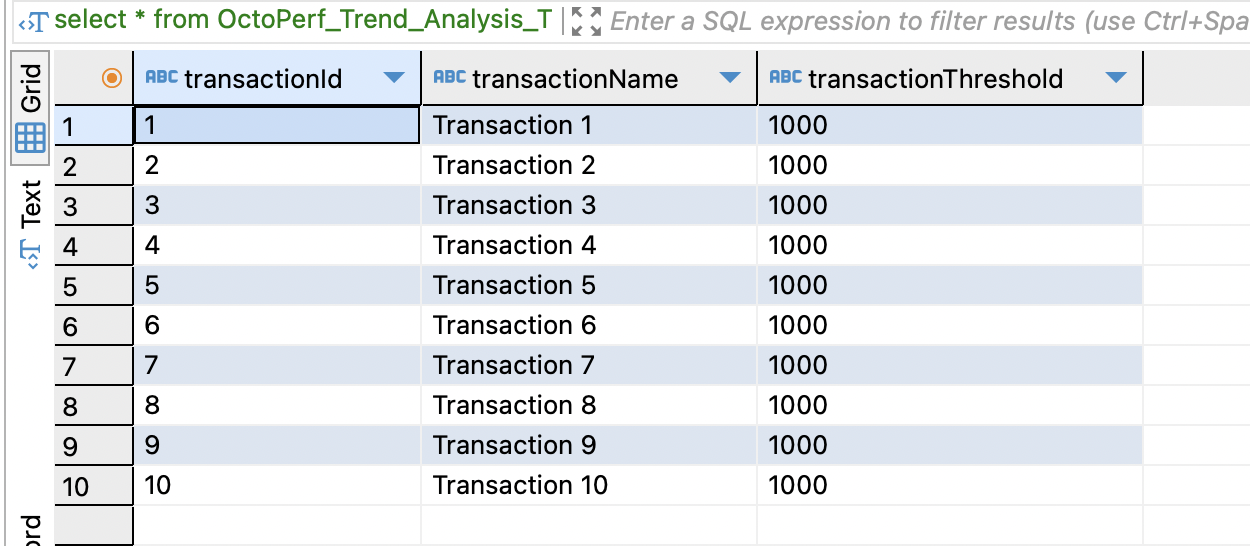
These tables are examples and mirror our simple example, you can make your database schema as complex as you want to support how you want to compare your data. Let’s look the best way to display this data. If we execute this SQL query:
SELECT
rel.releaseVersion, res.transactionName, res.responseTime, thr.transactionThreshold
FROM OctoPerf_Trend_Analysis_Full_Results res
JOIN OctoPerf_Trend_Analysis_Releases rel
ON res.releaseVersionId = rel.versionId
JOIN OctoPerf_Trend_Analysis_Thresholds thr
ON res.transactionName = thr.transactionName
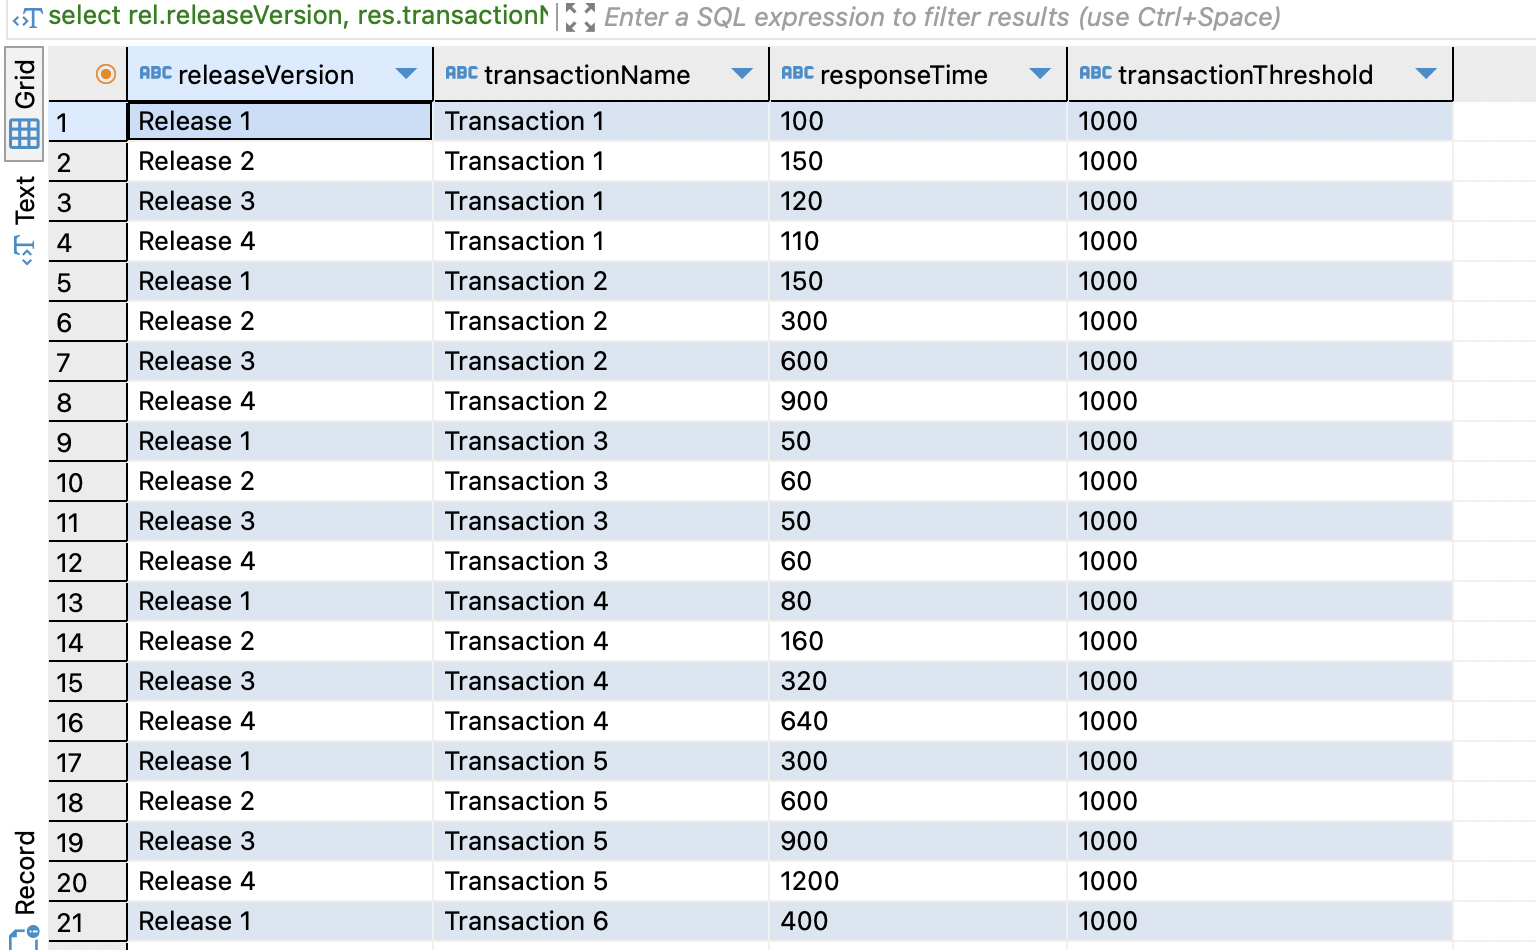
We get the same set of results to our original table image in the earlier section. Before we look at surfacing this data lets create a View in our database for this query. To do this we execute this piece of SQL:
CREATE VIEW OctoPerf_Trend_Analysis_All AS
SELECT
rel.releaseVersion, res.transactionName, res.responseTime, thr.transactionThreshold
FROM OctoPerf_Trend_Analysis_Full_Results res
JOIN OctoPerf_Trend_Analysis_Releases rel
ON res.releaseVersionId = rel.versionId
JOIN OctoPerf_Trend_Analysis_Thresholds thr
ON res.transactionName = thr.transactionName
Which means we can get the same set of data by running a Select statement against the view:
SELECT * FROM OctoPerf_Trend_Analysis_All
Now we have the data in a database we can display this in any number of ways. You may in your organisation have a tool such as Grafana that you can use to display your data, the blog post we have referenced earlier discusses how you can run this locally to test building graphs and charts. There are numerous tools that you can use to surface data from a database which is why it is a good solution to store your performance test data this way. If your organisation has a reporting and analysis tool, then using this is the best option for displaying your performance data. If you do not, then you can use any number of programming languages to build reports which can be done natively or using any number of libraries. If none of the above are a viable solution for you then you can always use Excel which is as proficient as any tool to display your data in a graphical format and can be configured to point at a database. For the purposes of this post, we are going to look at using SQL to query your database and give you some examples of how you can extract useful response time data using all the release data we have artificially generated. Let’s start with this piece of SQL:
SELECT rel.releaseVersion, res.transactionName, res.responseTime, thr.transactionThreshold
FROM OctoPerf_Trend_Analysis_Full_Results res
JOIN OctoPerf_Trend_Analysis_Releases rel
ON res.releaseVersionId = rel.versionId
JOIN OctoPerf_Trend_Analysis_Thresholds thr
ON res.transactionName = thr.transactionName
WHERE CAST(responseTime AS Integer) >= CAST(transactionThreshold AS Integer)

This gives us any transaction that exceeds the thresholds we have set. As the database is full of the same data we displayed earlier in this blog post, we can see that the data returned by this query is the only transaction that exceeds its response time threshold.
Let’s now run this piece of SQL:
SELECT rel.releaseVersion, res.transactionName, res.responseTime, thr.transactionThreshold
FROM OctoPerf_Trend_Analysis_Full_Results res
JOIN OctoPerf_Trend_Analysis_Releases rel
ON res.releaseVersionId = rel.versionId
JOIN OctoPerf_Trend_Analysis_Thresholds thr
ON res.transactionName = thr.transactionName
WHERE CAST(responseTime AS Integer) >= (CAST(transactionThreshold AS Integer) * 0.75)

This shows us transactions that are within 75% of their response time thresholds. This shows us that 3 of our transactions are close to their transaction thresholds and might need further investigation to determine if they are stable or have regressed.
We will now look at this piece of SQL:
SELECT rel.releaseVersion, res.transactionName, res.responseTime, thr.transactionThreshold
FROM OctoPerf_Trend_Analysis_Full_Results res
JOIN OctoPerf_Trend_Analysis_Releases rel
ON res.releaseVersionId = rel.versionId
JOIN OctoPerf_Trend_Analysis_Thresholds thr
ON res.transactionName = thr.transactionName
WERE res.transactionName IN
(
SELECT res.transactionName
FROM OctoPerf_Trend_Analysis_Full_Results res
JOIN OctoPerf_Trend_Analysis_Releases rel
ON res.releaseVersionId = rel.versionId
JOIN OctoPerf_Trend_Analysis_Thresholds thr
ON res.transactionName = thr.transactionName
WHERE CAST(responseTime AS Integer) >= CAST(transactionThreshold AS Integer)
)
ORDER BY releaseVersionId

This shows us all the timing points for the transaction that exceeded its transaction threshold as we saw above. This will give you an indication of whether the transaction has been getting progressively worse or whether the latest release has seen a significant change in response time.
Finally, in our example SQL, let’s look at this piece of SQL.
SELECT rel.releaseVersion, res.transactionName, res.responseTime, thr.transactionThreshold, ROUND(100.0 * (1.0 * responseTime / LAG(responseTime) OVER (ORDER BY releaseVersionId) - 1), 1) percentageChange
FROM OctoPerf_Trend_Analysis_Full_Results res
JOIN OctoPerf_Trend_Analysis_Releases rel
ON res.releaseVersionId = rel.versionId
JOIN OctoPerf_Trend_Analysis_Thresholds thr
ON res.transactionName = thr.transactionName
WHERE res.transactionName IN
(
SELECT res.transactionName
FROM OctoPerf_Trend_Analysis_Full_Results res
JOIN OctoPerf_Trend_Analysis_Releases rel
ON res.releaseVersionId = rel.versionId
JOIN OctoPerf_Trend_Analysis_Thresholds thr
ON res.transactionName = thr.transactionName
WHERE CAST(responseTime AS Integer) >= CAST(transactionThreshold AS Integer)
)
ORDER BY releaseVersionId

This query also shows the full set of transactions over all releases for the transaction that exceeded its threshold, but all includes a percentage change across the releases. All these queries can be created as views and your reporting tooling can use these views to gather useful insights into performance response time changes over time. These are a small number of queries to show you examples of the benefits of storing your response times in a database. You can easily experiment with querying this data, or your own performance data once you start persisting it, to get the information you need for your performance testing in your organisation.
Analysis from a spreadsheet
Analysis from a spreadsheet is relatively straightforward. It is a much more manual process with results copied from each test run stored in a spreadsheet that is added to after each test execution cycle.
Let’s build a JMeter Test with 10 Dummy Samplers that match our example.
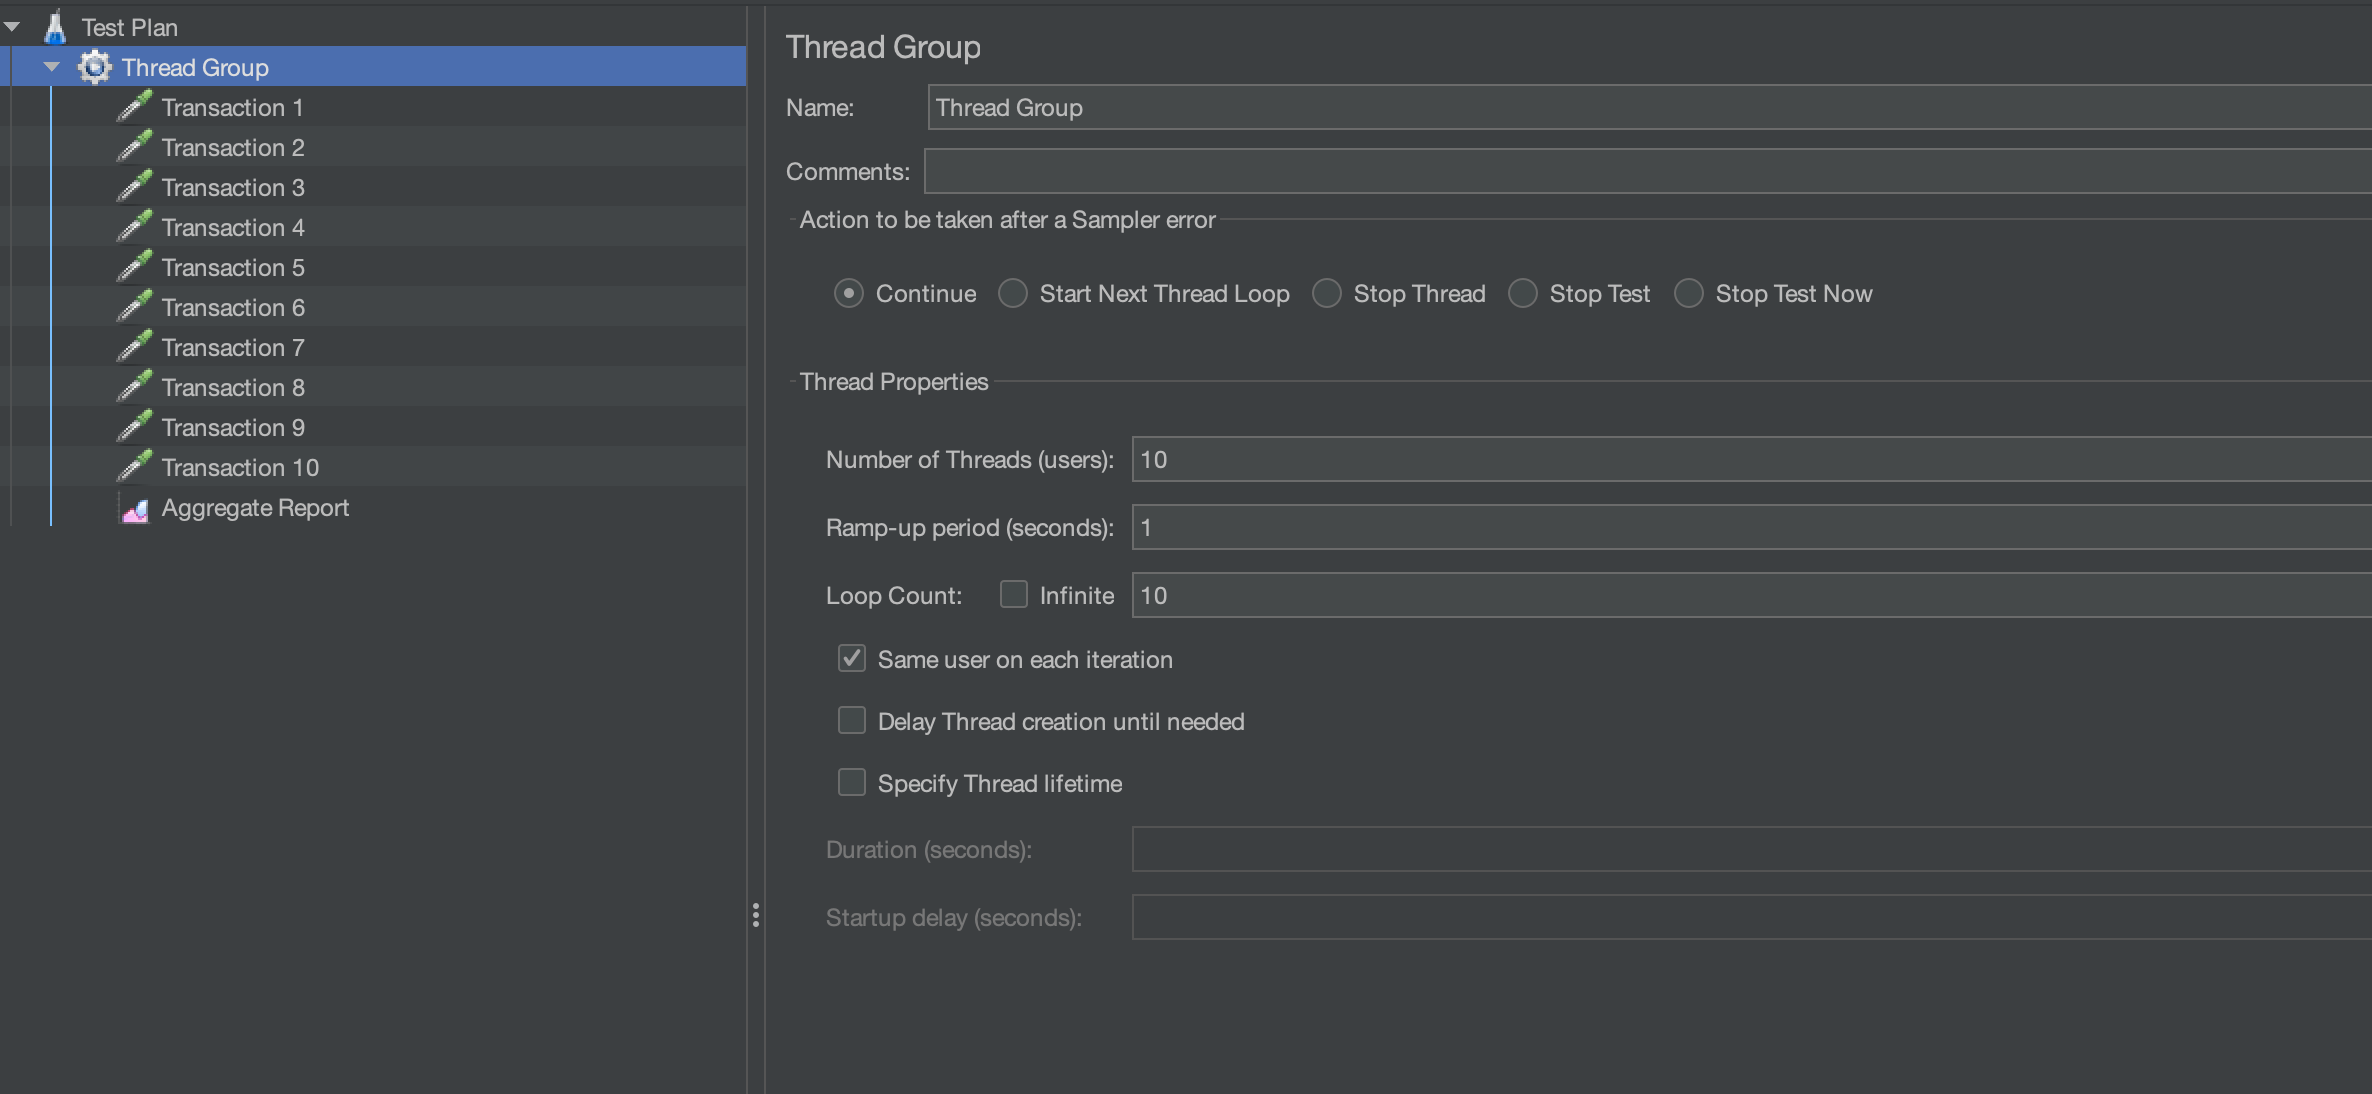
We have added an Aggregate Report to the test, and we are going to execute the test with 10 Threads each with 10 Iterations.
Once the test has completed, we can see the responses in the Aggregate Report.
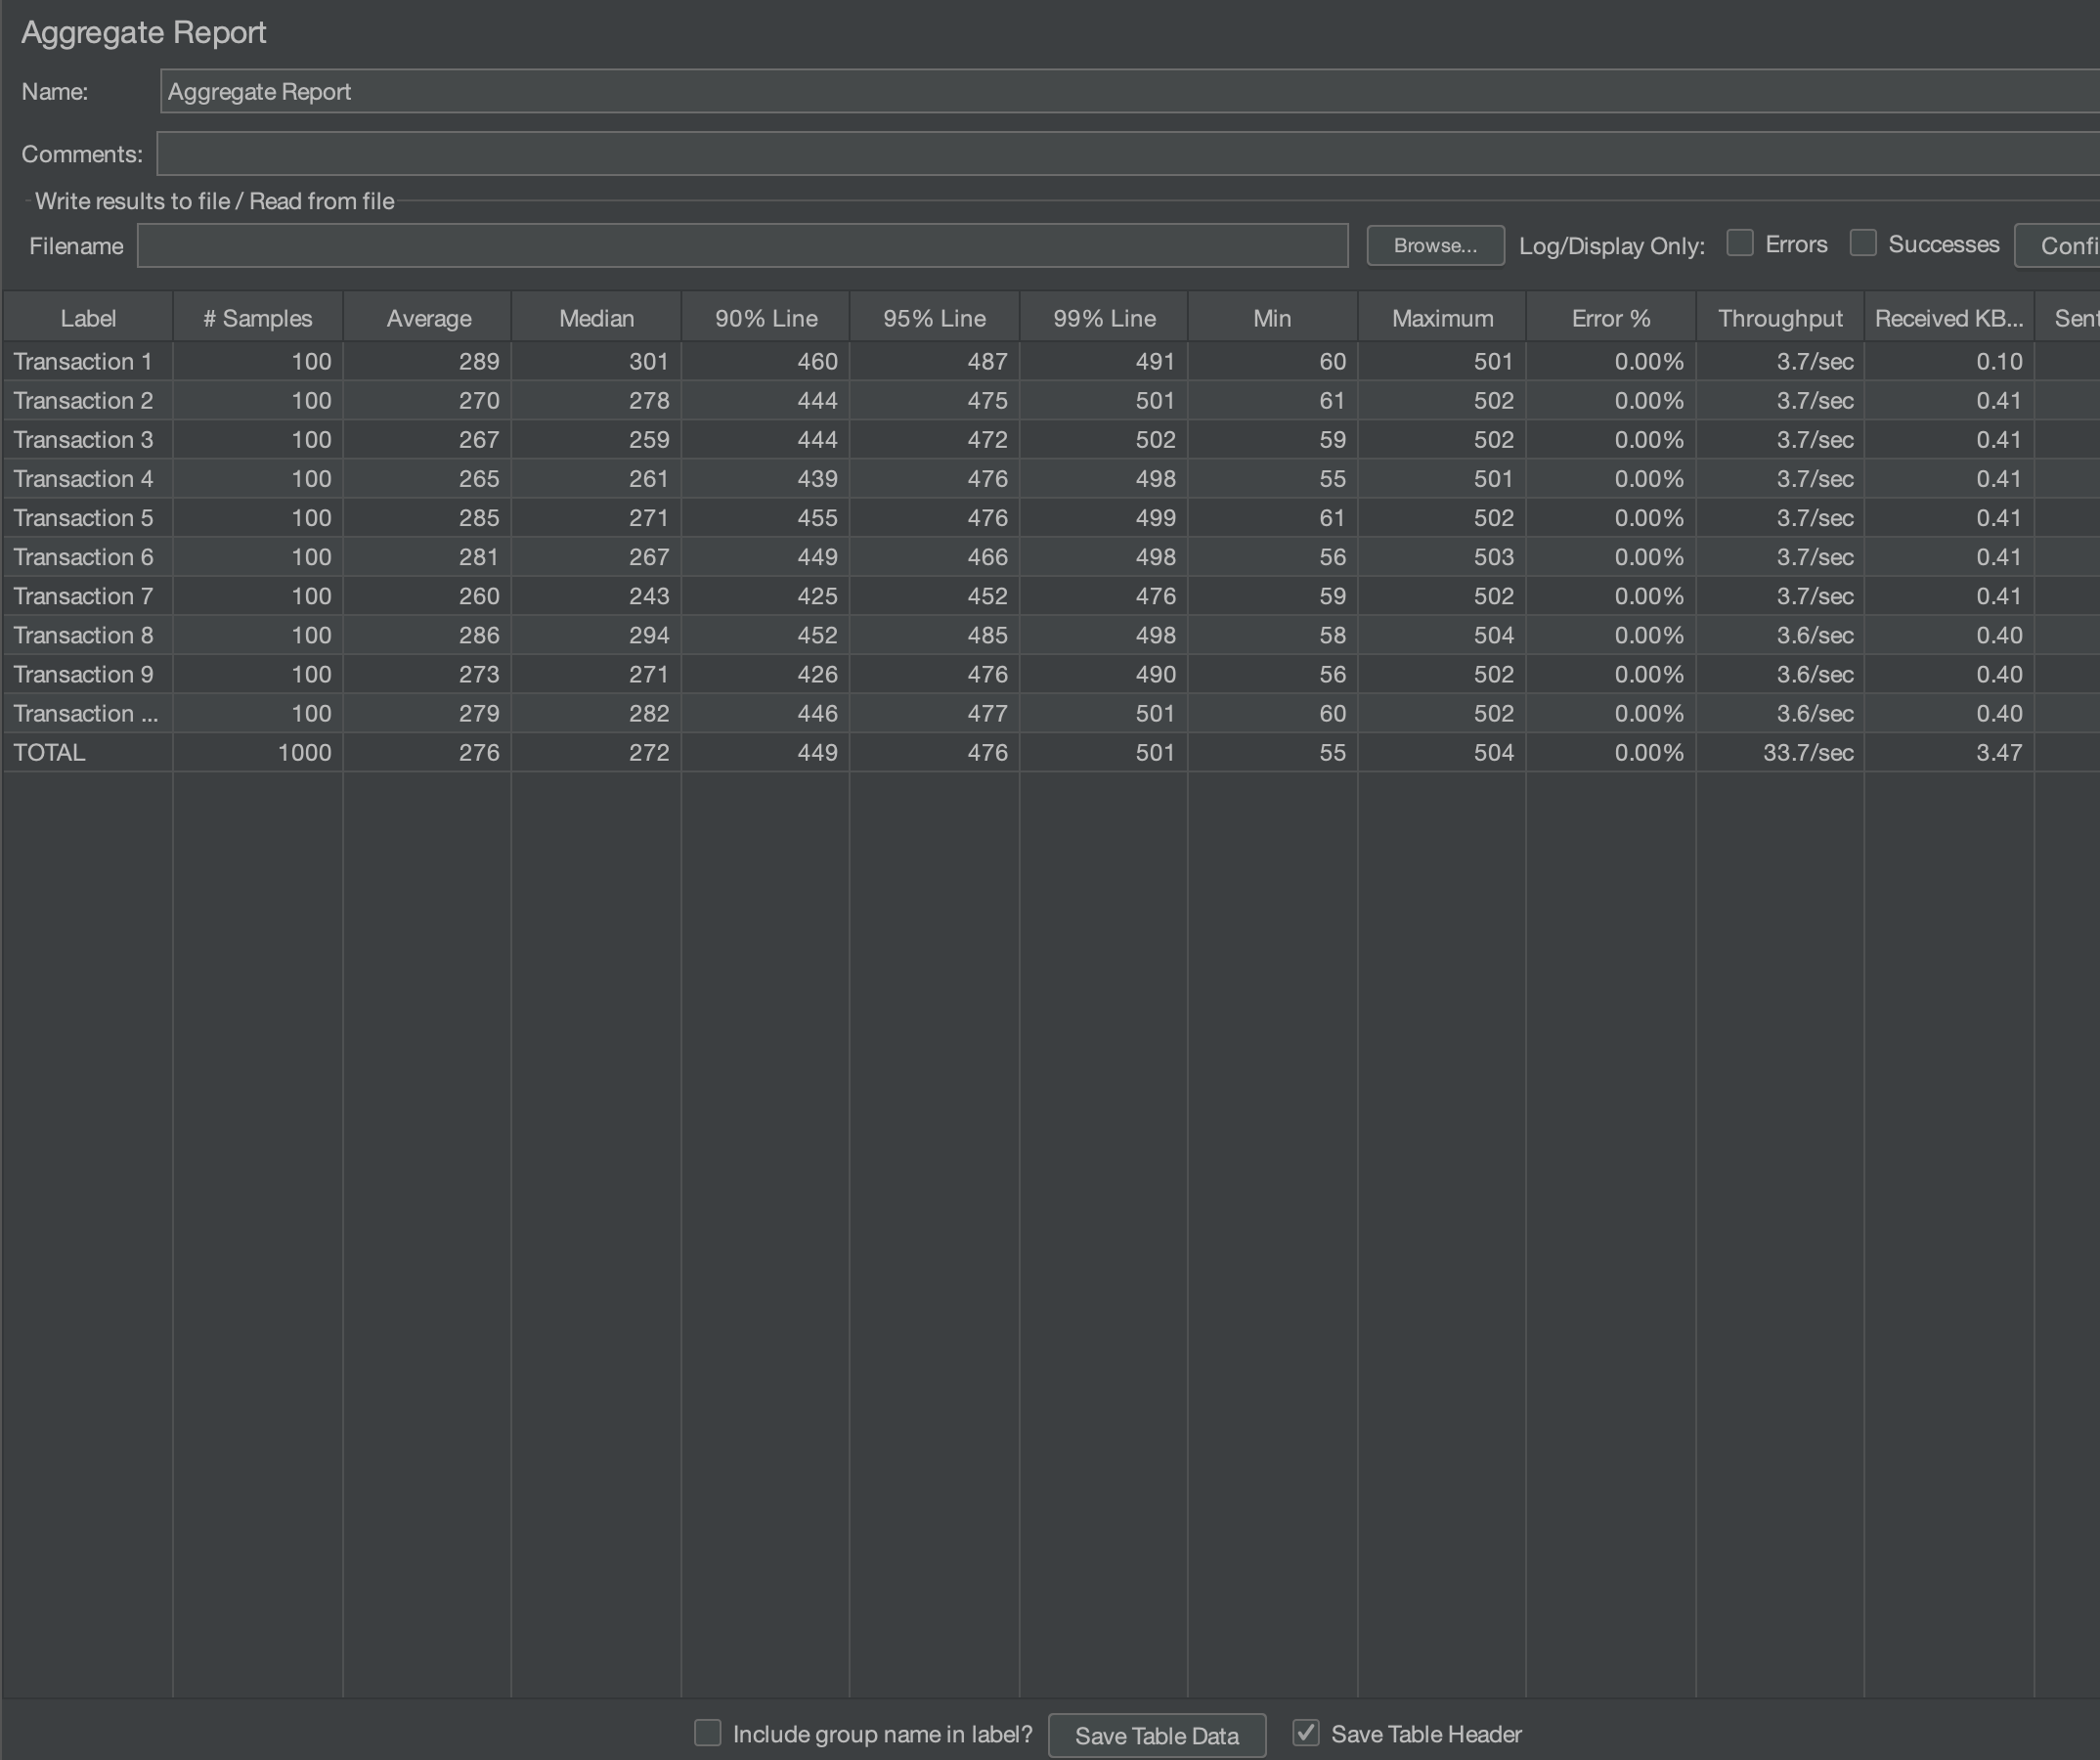
If we use the Save Table Data button, we can save the results as a .csv file. For the purposes of this blog post we will call the output file OctoPerf_Summary_Output.csv.

We can now open this in an Excel spreadsheet.

We can then refine this down to only have the information we want to compare. In our example we’ll only use the Transaction Name and 95th Percentile.
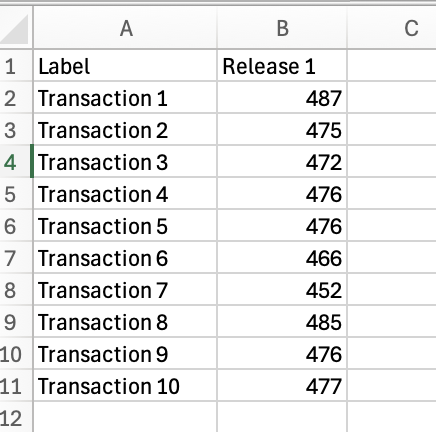
We have added Release one to the column heading. If we now re-execute our test and repeat the process, apart from naming our output file OctoPerf_Summary_Output_Release_2.csv.

If we open this in Excel and extract the 95th percentile values and then add these to the first set of results we extracted.
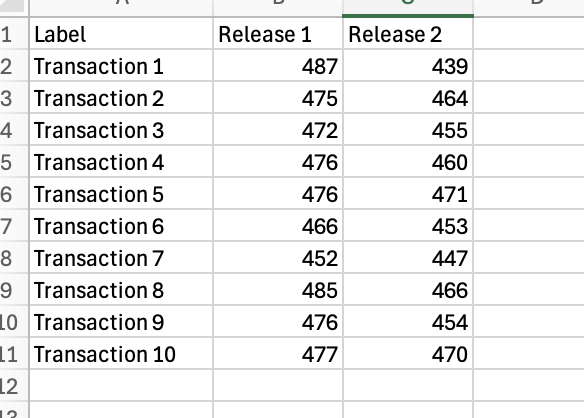
We now have the start of a set of performance results we can compare. We can use this data to easily build a graph or chart to assist with our analysis.
OctoPerf Trend Analysis
If you are using the OctoPerf SAAS solution for your performance testing then the ability to look for trends and spot deviation in results can easily be done using the Trend Test Results feature. This effective feature allows you to analyse results in the same as we have discussed in this blog post where you can spot trends over several sets of test results.
Conclusion
The point that you start gathering results data does not necessarily need to be at the first release of your application. You may have historically executed tests and analysed results in isolation and now want to start to build up a more concise picture of your applications performance over time.
There is no reason that you cannot start your results gathering at any point, it’s all about giving you as much data to analyse for your application as you can possibly have, and this does not mean that it must be complete. Looking for trends and patterns in your response time data will help improve your performance testing approach and help you consider if there is an underlying performance issue that may be exposed in the future.
