
We are going to look at how performance testing can work hand in hand with Artificial Intelligence and Machine Learning:
- We will look at how we can use data gathered from performance test scenarios during execution to determine what functionality and what concurrent volumes and load profiles we should be testing.
- We will use very simple mathematical models to do this in conjunction with a very simple database model with several manual steps to simulate the machine learning.
As there are many Artificial Intelligence solutions to choose from and for the purposes of this post this is the easiest way to discuss the principles of Artificial Intelligence working with performance testing rather than discussing a particular framework.
Artificial Intelligence and Machine Learning
Let’s just clarify what we mean by Artificial Intelligence and Machine Learning.
This is an extract from an article found online.
Artificial intelligence is a field of computer science which makes a computer system that can mimic human intelligence. It is comprised of two words "Artificial" and "intelligence", which means "a human-made thinking power."
The Artificial intelligence system does not require to be pre-programmed, instead of that, they use such algorithms which can work with their own intelligence. It involves machine learning algorithms such as Reinforcement learning algorithm and deep learning neural networks.
Machine learning is about extracting knowledge from the data. It can be defined as,
Machine learning enables a computer system to make predictions or take some decisions using historical data without being explicitly programmed. Machine learning uses a massive amount of structured and semi-structured data so that a machine learning model can generate accurate result or give predictions based on that data.
Machine learning works on algorithm which learn by its own using historical data. It works only for specific domains such as if we are creating a machine learning model to detect pictures of dogs, it will only give result for dog images, but if we provide a new data like cat image then it will become unresponsive.
So really, we are thinking about using data extracted from previous performance tests can inform what tests should be run and at what volumes by analysing tests that have previously been executed against our application under test and if possible other similar applications in your organisation.
Setting up our solution
Setup introduction: Why it’s very simple
For the purposes of this post, we are going to build a very simple solution where JMeter reads from a database to determine which tests to run and the volumes at which these tests will execute.
We will show the test results being written back to the database where in the real world you will have an Artificial Intelligence platform making decisions on this data.
For the purposes of this test, we will look at what type of modelling could be done against this data, but we will simulate manually the outcomes your modelling would do, because this makes the examples much simpler and theoretical.
This means that we are looking at the principles of the machine learning and performance testing without using a specific platform and once you understand the principles you can apply them to whatever Artificial Intelligence platform you may have at your disposal.
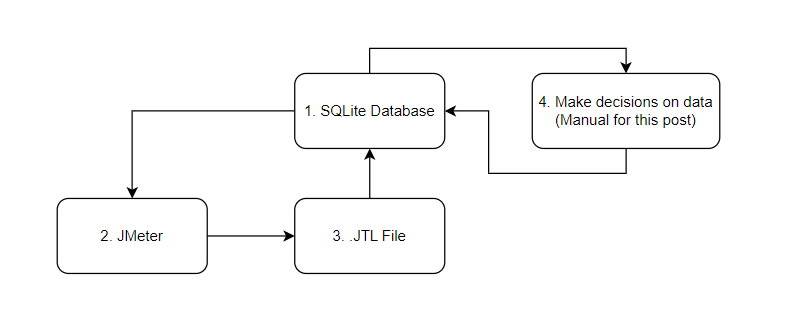
Our simple solution is:
-
We will use an SQLite database for the purposes of our simple setup, in a more enterprise solution you may be using an alternative database technology.
-
JMeter will execute the tests.
-
.JTL file will be produced that contain the results from the test.
-
This is where an Artificial Intelligence solution that can interpret and make decisions based on data will be, for our simple test we will make some manual decisions.
If you need to install a local version of SQLite the download page is here.
Equally, if you already have a database technology that you use for other things then you can just use that should you want to.
We will call our database OctoPerf_AI.db and we create and open it through a series of command lines:
.\sqlite3 OctoPerf_AI.db

.databases

.open OctoPerf_AI.db
We now have an open SQLite database for us to use.
JMeter test setup
Firstly, we are going to create a simple test that contains a Thread Group with 5 Dummy Samplers. You can download it using this link.
Each dummy sampler will have a different response time range so we can ensure that our results on which we are analysing data is different:
-
Sampler 1 = 50ms – 500ms
-
Sampler 2 = 500ms – 1000ms
-
Sampler 3 = 1000ms – 1500ms
-
Sampler 4 = 1500ms – 2000ms
-
Sampler 5 = 2000ms – 2500ms
We will add a Simple Data Writer and a Precise Throughput Timer.
For the purposes of this post we will to start with populate the Thread Group with these values:

Set out throughput time to be:

And set our data writer to be:

We will add a View Results Tree and Summary Report to our test.
Out test will look like this:

If we run our test, we can see that it runs successfully:

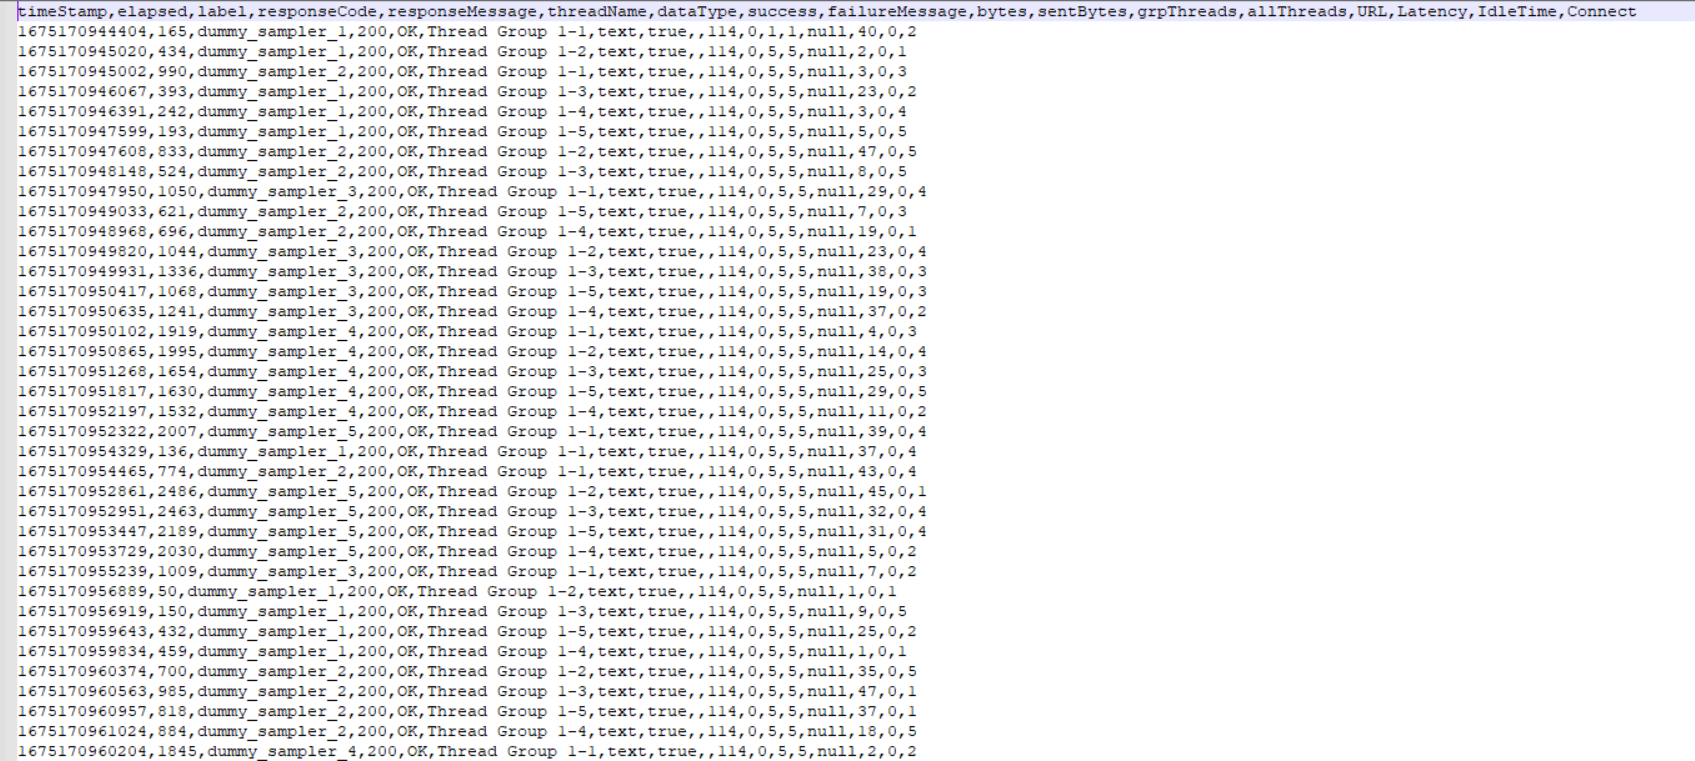
And we have an output file containing all our response times:

Database setup
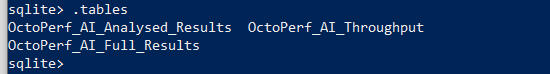
We are now going to turn our attention to the database, and we are going to create 3 tables using these SQL statements, we will discuss the tables in more detail later:
OctoPerf_AI_Full_Results
CREATE TABLE OctoPerf_AI_Full_Results(timeStamp Varchar, elapsed Varchar, label Varchar, responseCode Varchar, responseMessage Varchar, threadName Varchar, dataType Varchar, success Varchar, failureMessage Varchar, bytes Varchar, sentBytes Varchar, grpThreads Varchar, allThreads Varchar, URL Varchar, Latency Varchar, IdleTime Varchar, Connect Varchar)
This table is to hold our test results and mirrors the column names in the .jtl file that gets produced using the default JMeter settings, clearly is you have updated the output that gets generated then this table will need to change to reflect that.
OctoPerf_AI_Analysed_Results
CREATE TABLE OctoPerf_AI_Analysed_Results(results_id Integer primary key autoincrement, label Varchar, average decimal(38,2), min decimal(38,2), max decimal(38,2), created_datetime Integer)
This table holds an analysed view of the data that was produced from executing the test.
OctoPerf_AI_Throughput
CREATE TABLE OctoPerf_AI_Throughput(scenarioName varChar, noThreads Integer, rampUp Integer, testDuration Integer, noSamples Integer, created_datetime Integer)
This table holds data used to define the volumes that the test is executed at.
Using SQLite on the command line using the .tables command, view these tables.
Building and testing our simple solution
We now have all the components we need to build our simple test that will allow us to demonstrate how Artificial Intelligence software can use the data produced by your testing to influence the load profiles of future tests.
The first change is to build a solution to write the results file to our OctoPerf_AI_Full_Results table.
The first thing to do is to add a JDBC Connection Configuration to our test and configure it to connect to our SQLite database, this connection assumes that the database is in the same location as the JMeter test script.

This will allow JMeter to connect to our SQLite database we have created, we have given the connection a name of octoperf-database so we can use this connection to access the database.
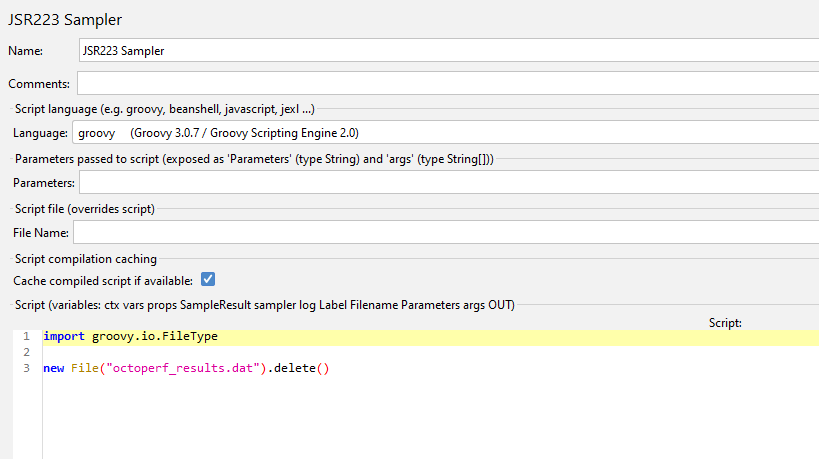
We are now going to add a JSR223 Sampler to our test and add the following code to manage adding data from our output file created by the Simple Data Writer into our database.
We are adding this to a teardown Thread Group so that this is executed after the test completes.

The full code in this sampler (which is not all visible from the image) is detailed below.
List<String[]> results = new ArrayList<String[]>();
String sqlString = "";

// Read the output file

try (BufferedReader br = new BufferedReader(new FileReader("octoperf_results.dat"))) {

  String line;

  while ((line = br.readLine()) != null) {
    String[] values = line.split(",");
    results.add(values);
  }
}
Firstly, we are iterating through our output file, which you will recall from the section above we called octoperf_results.dat and iterate through each line in the file and then split each line using a comma as the delimiter. These values will then be written to a List of String Arrays.
We are then going to build a SQL statement that once executed will insert the data into our database.
// Build the SQL String

sqlString = """
INSERT INTO OctoPerf_AI_Full_Results(
timeStamp, elapsed, label, responseCode ,
responseMessage ,threadName ,dataType ,
success ,failureMessage ,bytes ,sentBytes ,
grpThreads ,allThreads ,URL ,Latency ,IdleTime ,Connect)
VALUES
"""

// Append to the SQL String

results.eachWithIndex { result, idx ->

  if(idx > 0) {
    sqlString += "('" + result[0] + "','" + result[1] + "','" + result[2] + "','" + result[3] + "','" + result[4] + "','" + result[5] + "','" + result[6] + "','" + result[7] + "','" + result[8] + "','" + result[9] + "','" + result[10] + "','" + result[11] + "','" + result[12] + "','" + result[13] + "','" + result[14] + "','" + result[15] + "','" + result[16] + "')"

    if(idx < results.size() - 1) {
      sqlString += ",
    }
  }
}
Finally, we will write our SQL statement to a variable.
// Add to variable

vars.put("sqlString", sqlString);
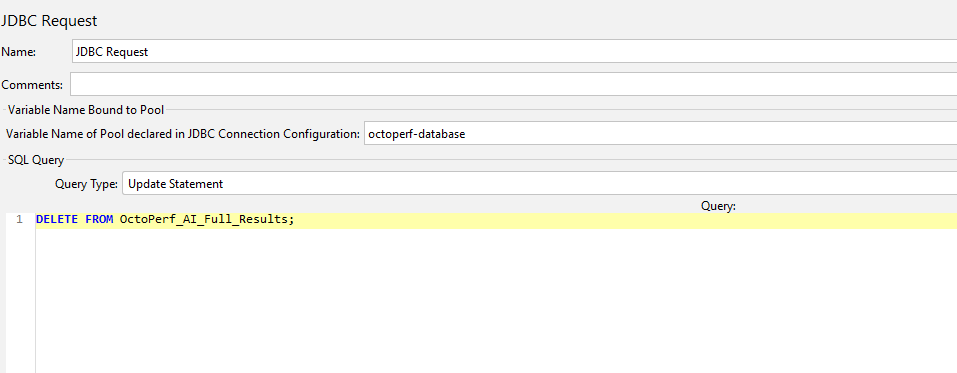
In addition to the JSR223 Sampler we need to add a JDBC Request to our teardown Thread Group so we can write the results to the database.
Notice we have changed the Query Type to Update Statement and we have included the pool name octoperf-database that we defined in our JDBC Connection Configuration.
We are using the variable we created in the previous step as the SQL to be executed.

Our teardown Thread Group now looks like this.

Before we execute our test again and check our data gets written to the database, we need to ensure that our test is repeatable and to do this we need to be able to Delete results from the OctoPerf_AI_Full_Results table and delete the octoperf-results.dat file.
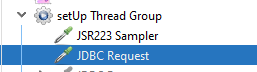
We will perform these steps in a setup Thread Group using a JSR223 Sampler to remove the output file and a JDBC Request to clear the database table.
Our setup Thread Group looks like this.
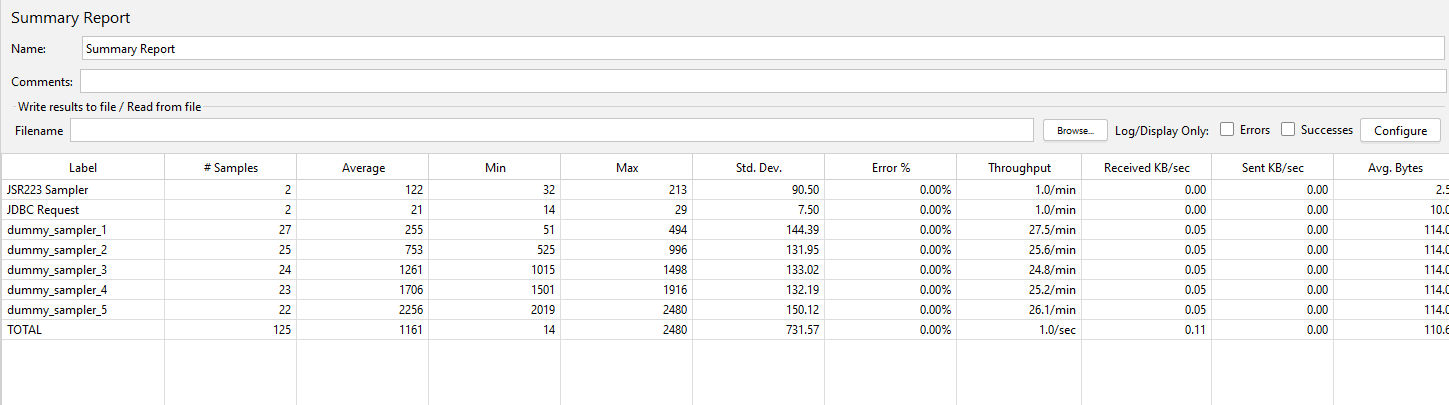
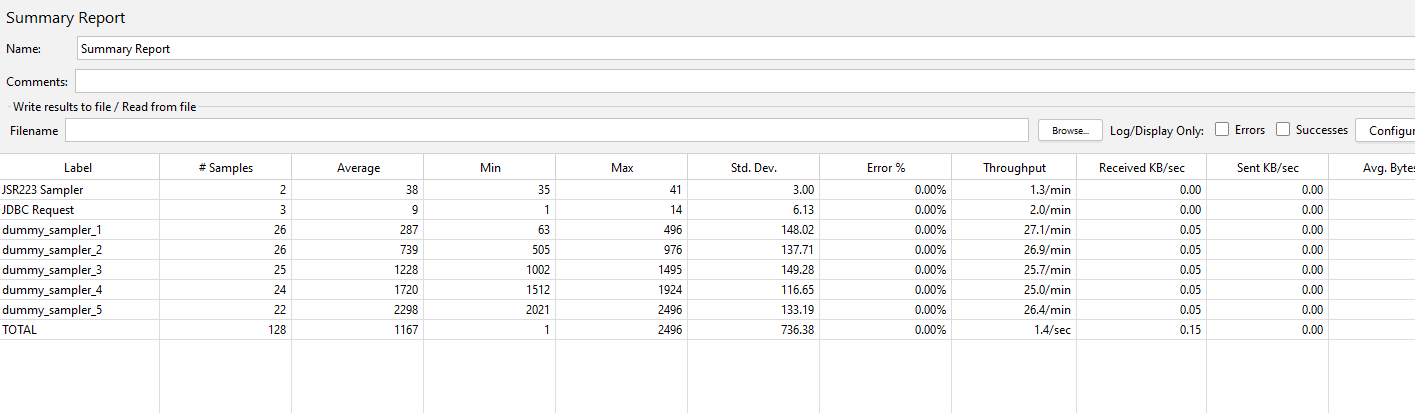
If we now run our test, we will see that the results from the output file have been written to the database tables.
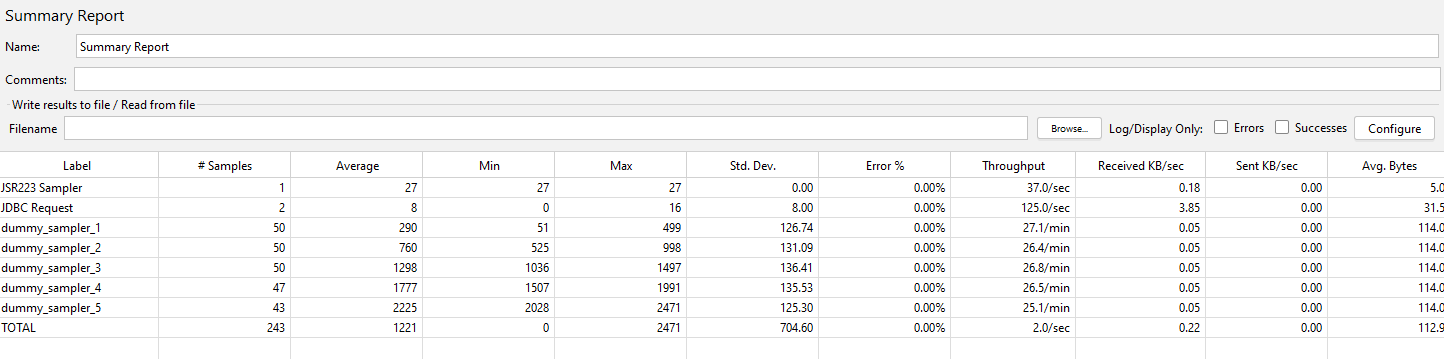
We can see from our Summary Report that 121 test samplers were executed with an additional 4 used for the JDBC Request and JSR223 Samplers.
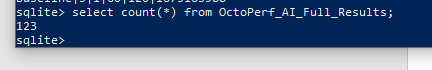
If we count the records in the database results table, we see that the numbers match.
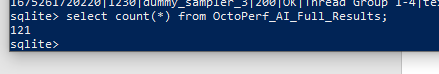
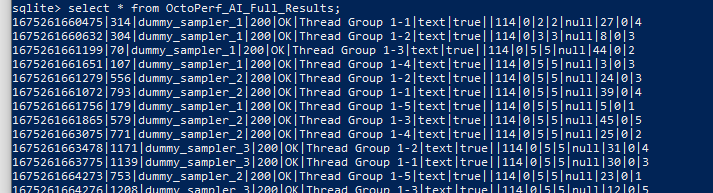
And if we query the table, we can see all the data.
We now have a test that is repeatable but all it does is delete and add data to a SQLite database table.
By itself this is not particularly useful as it essentially removed data from the table and then adds it from the latest test.
Let’s look at ways of using the data we have written to this table useful and something that can be used to define volumes for the future.
Using the database to parameterise the test
Before we look at uses for this data, we need to make a small change to the test. What we are going to do is drive the volumes for the Thread Group and Throughput Timer from values in the database. The reason for this change is that we wanted to change the load profile of our test based on decision made by analysing the results and to do this we need to hold these values in the database.
These values will be read from the table OctoPerf_AI_Throughput from our database, so let’s firstly add some values.
If you remember, we built the table using this SQL command:
CREATE TABLE OctoPerf_AI_Throughput(scenarioName varChar, noThreads Integer, rampUp Integer, testDuration Integer, noSamples Integer, created_datetime Integer)
If we run this insert statement this will effectively mirror what the test is doing now:
INSERT INTO OctoPerf_AI_Throughput VALUES (‘Baseline’,5,1,60,120, UNIXEPOCH());

Now we have some values to drive our test lets update our JMeter test to use them:

We are going to use our database connection in a JDBC Request, the one that we have been using earlier in this post, and this time we are going to run a query get the throughput values from the database and assign to a variable called test-throughput-values.
We are now adding a JSR223 PostProcessor to the JDBC Request and write the values to a set of Properties.

This is the code we are using:
/* Check we have received results from our database query */

if(vars.get("test_throughput_values") != null && vars.getObject("test_throughput_values").size() > 0) {
  /* Assign values to propertys to use in the test */
  props.put("noThreads", vars.getObject("test_throughput_values").get(0).get("noThreads").toString());
  props.put("rampUp", vars.getObject("test_throughput_values").get(0).get("rampUp").toString());
  props.put("testDuration", vars.getObject("test_throughput_values").get(0).get("testDuration").toString());
  props.put("noSamples", vars.getObject("test_throughput_values").get(0).get("noSamples").toString());
}
We check that the query has values and then assign values to the properties.
Finally, we change the hard-coded values in the Thread Group and Throughput Timer to use these properties.


Our test now looks like this:

Let’s re-run our test with the values being read from the database.
Our summary report is almost identical to when we had the hardcoded values, the precise throughput timer does not always produce the same volumes.
We now have a test that reads and write to our database, lets look at what we can do with the data.
Some examples of how data can be analysed
The point of this post was to look at how we can use Machine Learning to define load profiles for our performance testing, we are now at that point.
As already discussed, this is a simple example, and we are going to perform the actions that your Machine Learning technology will do manually.
If you remember, we created a database table called OctoPerf_AI_Analysed_Results and this is where we are going to store values we have extracted from our Full Results of our test. This table will not be truncated when our test runs so the data will build up and we can make performance related decisions based on this table. In your organisation you can make this as complex as you want, and you can write any data you want to your database and analyse in any way you see fit; we are just providing a simple solution that will hopefully give you the ambition to take this further as part of your performance testing.
We are going to run this SQL Query against our results table:
INSERT INTO OctoPerf_AI_Analysed_Results(label, average, min, max, created_datetime) SELECT label, min(elapsed), avg(elapsed), max(elapsed), UNIXEPOCH() FROM OctoPerf_AI_Full_Results GROUP BY label;
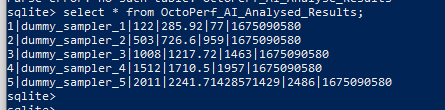
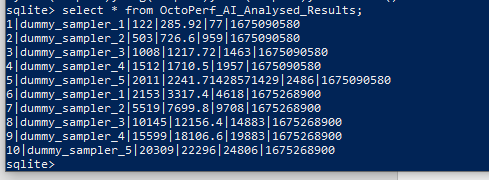
If we then query the OctoPerf_Analysed_Results table, we can see that we have very simply analysed the data and stored this data.
To start being able to make decisions based on this data lets change the artificial durations of our dummy samplers:
| Sampler | Original value | Updated value |
|---|---|---|
| Sampler 1 | 50ms – 500ms | 500ms – 5000ms |
| Sampler 2 | 500ms – 1000ms | 5000ms – 10000ms |
| Sampler 3 | 1000ms – 1500ms | 10000ms – 15000ms |
| Sampler 4 | 1500ms – 2000ms | 15000ms – 20000ms |
| Sampler 5 | 2000ms – 2500ms | 20000ms – 25000ms |
And re-run our test at the same volumes.
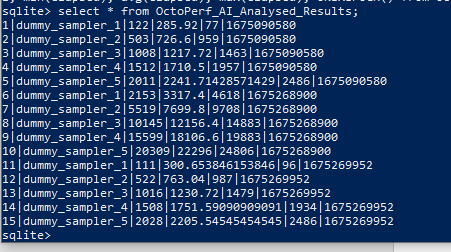
If we then run the same query as above, we now have 2 sets of results in our database meaning we are starting to build up a picture of response times between test runs.
This could be application builds or after a fix for a bug is applied to the application.
If we look at the OctoPerf_Analysed_data table, we can see both sets of results:
Let’s now re-set our dummy sampler values and re-run the test for a third time.
We now have three sets of results, and you can start to see how over time this data will grow and grow and become more and more useful for your analysis engine:
Any data analysis technology can easily graph this data into something meaningful, as an example:
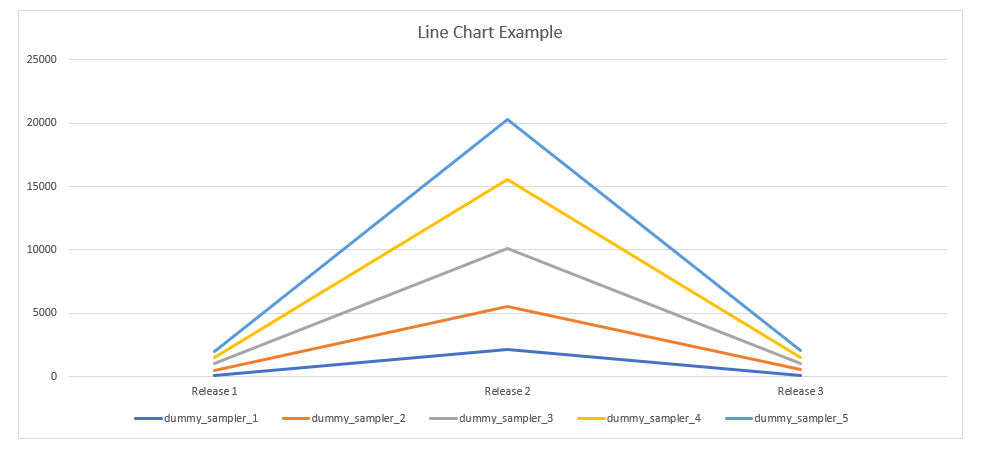
Now we deliberately inflated the second test volumes, but you can see over time how you can get some useful insights as the data grows.
The other aspect to data analysis that we can consider is using the data to control the volumes in our OctoPerf_AI_Throughput table which will in turn drive our test.
We really don’t have very much data, but we could have a rule in our Machine Learning tool that says
If the average of Dummy Sampler 3 is greater than 1 second then double the volumes in the test.
Now we admit that this rule is not scientific and makes no sense and would never be implemented but this is just a demonstration of how Machine Learning technology can define your tests based on the evidence of the results.
So, you could run this query:
SELECT average FROM OctoPerf_AI_Analysed_Results WHERE label = 'dummy_sampler_3' GROUP BY label
Which gives us:

So, our rule would be executed, and this SQL statement would be run:
INSERT INTO OctoPerf_AI_Throughput (scenarioName, noThreads, rampUp, testDuration, noSamples, created_datetime) VALUES ('Update By AI', 10, 2, 120, 240, UNIXEPOCH());
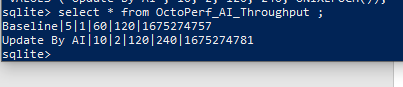
We now have 2 entries in our execution table and the latest one will be picked up by our SQL in our JMeter test using this query:
SELECT noThreads, rampUp, testDuration, noSamples from OctoPerf_AI_Throughput order by created_datetime DESC LIMIT 1;

If we run our test again, we can see the volumes in our Summary Report have doubled:
Conclusion
Now clearly with your applications the data produced will be far more diverse and the manual updates and select statements we have executed will be done by a technology platform and the rules and analysis criteria will be far more complex.
But hopefully this is an insight into how data produced by performance tests and analysed by Artificial Intelligence can be used to define future tests and load profiles.