
Statistical Analysis in Performance Testing
What does statistical analysis have to do with performance testing you may ask, more than you would think is the answer.
Due to the large volumes of result data that is generated and analysed you are performing statistical analysis of your data when presenting your results. - 90th Line, - 95th Line, - 99th Line, - Average, - Median.
Are all examples of values in the JMeter Aggregate Report.
- Average,
- Std.Dev.
Are examples of values in the JMeter Summary Report as well as the Graph Results.
We are going to take a look at these statistical techniques so you can understand, if you don’t already know, how they are calculated as well as how they can be of benefit when analysing performance test results.
We will also look at other statistical techniques that you can use outside of JMeter by using the .jtl file output, we will use Microsoft Excel for our analysis but other spreadsheet type tools are equally as good.
As way of a disclaimer there are many ways of analysis data, far too many to go into in this Blog Post but hopefully reading this will encourage you to explore this subject further as it can be fascinating.
For each way of analysing the results we will look at its definition, look at an example and discuss how it can be of use when presenting results.
Let’s get started.
Test Script
In order to demonstrate these techniques we are going to create a very specific test script that will allow us to control the data in a very specific way. You can download it from here.
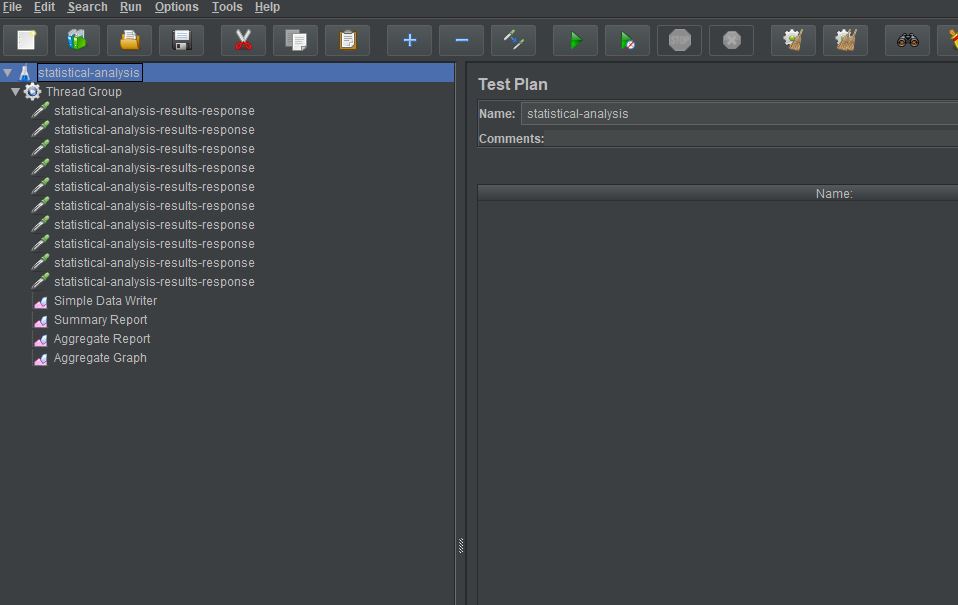
We have 10 dummy samplers all with the same name, the reason being that this allows us to create a single timing point based on the 10 samplers which we can analyse.
Each sampler has a specific response time with the first set to 100 milliseconds, the second to 200 milliseconds and increasing in increments of 100 milliseconds until we reach 1000 milliseconds in the last sampler.
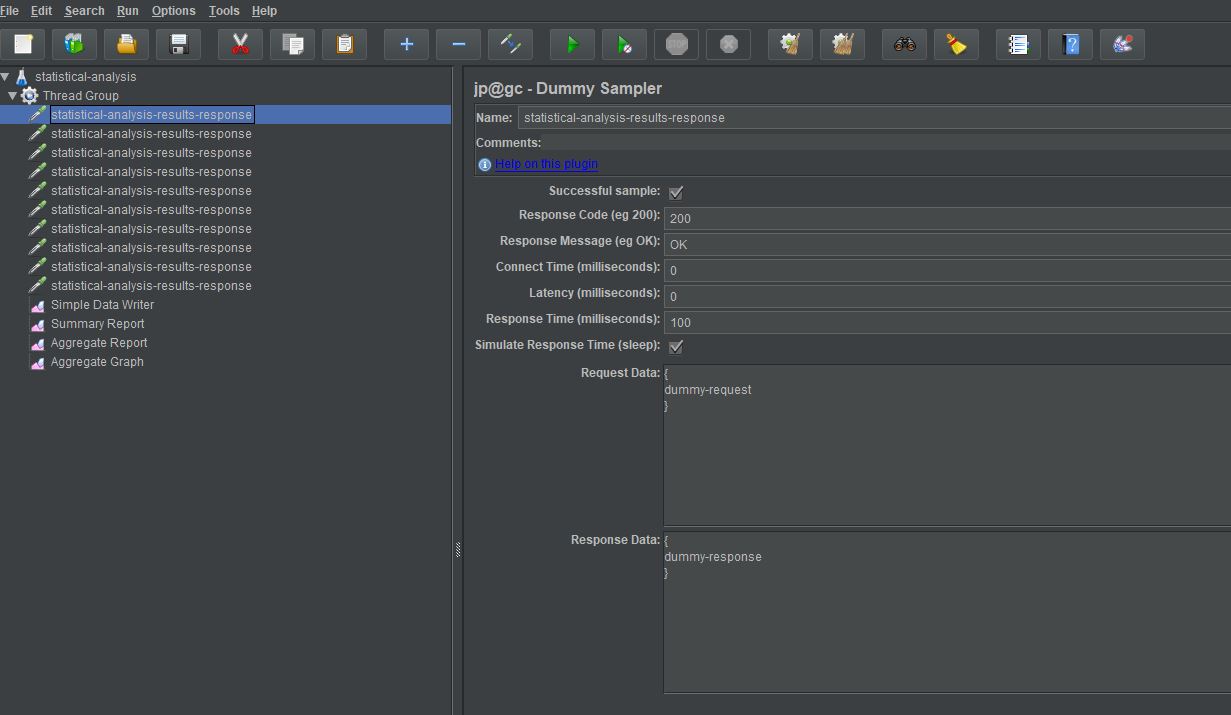
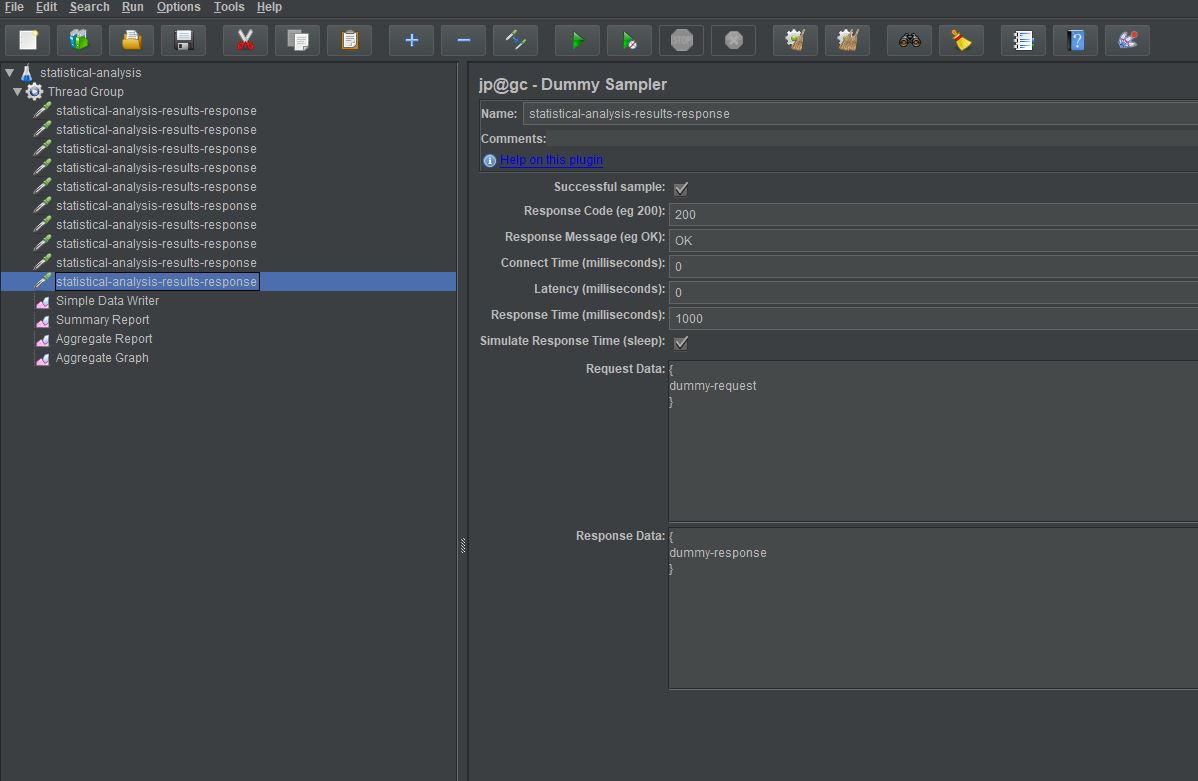
We also have a:
- Simple Data Writer
- Summary Report
- Aggregate Report
- Aggregate Graph
These listeners allow us to show the data that JMeter produces while we explain how they were calculated.
This small sample will be useful to explain the principles but in reality the bigger the sample size the more accurate the results.
Average
Definition
The Average (otherwise known as the Arithmetic Mean) is basically the sum of a set of response time divided by the number of samples.
The Average is useful in determining the overall trend of a data set and it’s very easy and quick to calculate.
Calculate the value
Let’s run our test and look at the value produced.
We will use the Summary Report to get the value as while the value is present in all the listeners it is obviously the same value.

The Average for our timing point is 550 milliseconds.
Technique
As stated in the definition section if we add our sampler results together and divide by the number of samples we get the Average:
(100 + 200 + 300 + 400 + 500 + 600 + 700 + 800 + 900 + 1000) / 10 = 550
Uses for analysing results
It’s a good indication of how your application is performing, especially if you have a reasonable sample size, it does not take into consideration outliers and large deviations in response times so there are better values to use.
Useful as a face value indication of your applications performance and works well when looking at result trends over many executions of the same test.
Percentiles
In our introduction we have 90th, 95th and 99th Percentile, there is no benefit in looking at each independently as they are variations on the same way of analysing data so we will consider Percentiles together.
Using the nearest-rank method on results with fewer than 100 distinct values can result in the same value being used for more than one Percentile which is another reason to ensure that you use large sample sizes when analysing performance test results.
Definition
The 90th Percentile, as an example, is the value in your results below which 90% of the response times are found, with 10% being above the 90th Percentile.
This, alongside the 95th and 99th Percentile are commonly used in performance results analysis as they account for any significant number of longer response times that would not be found using the average whilst still allowing for any anomalies to be ignored.
Calculate the value
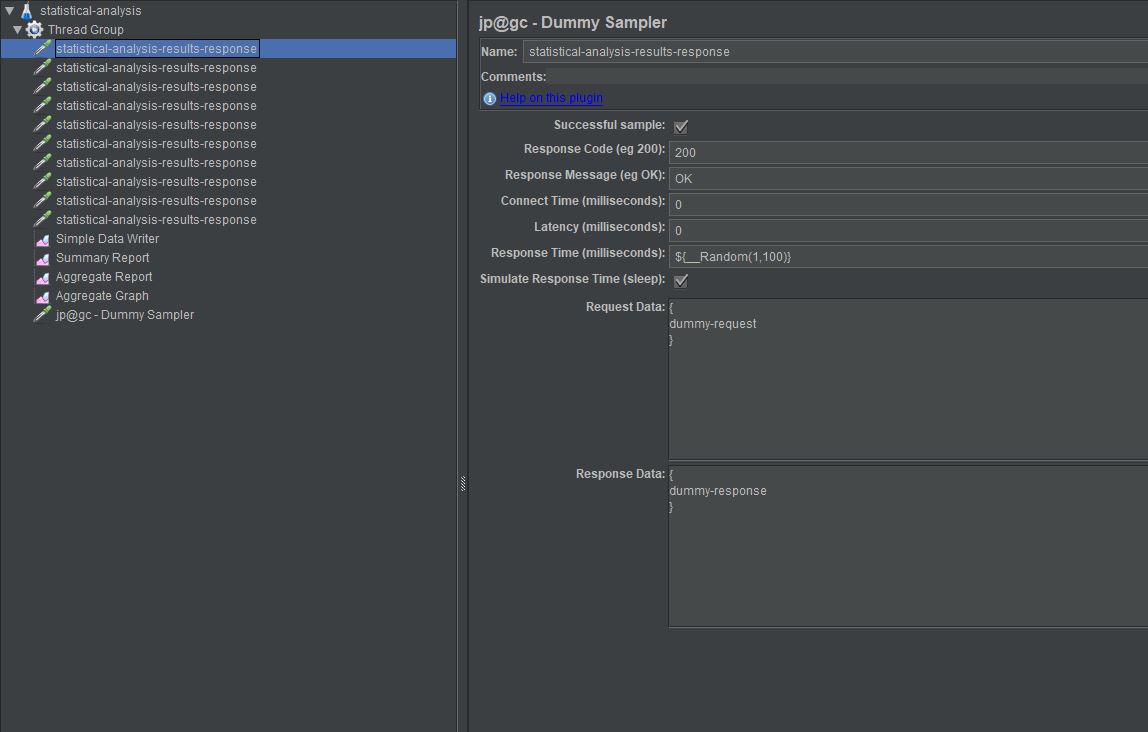
Before we can calculate our results, we are going to have to make two small changes to our JMeter test script; these are to increase each sampler to execute ten iterations and to make each sampler generate a random number. You can download the updated JMX from here.
This will avoid us getting the same value for our Percentiles which is a possibility with small results sets.
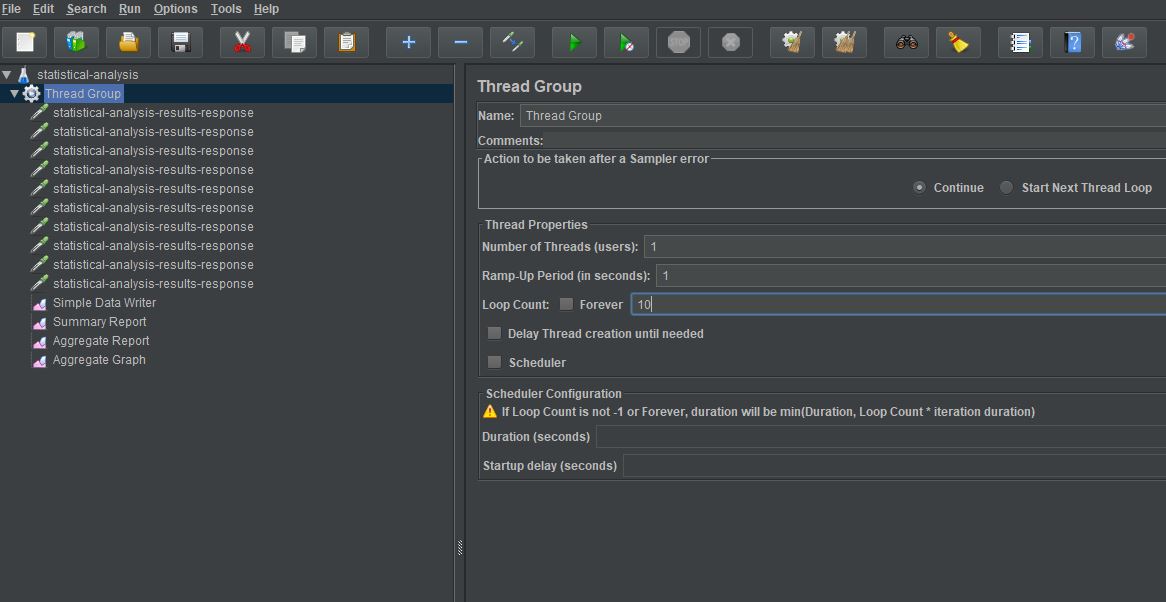
The Thread Group loop count is increased first to give us 10 iteration of each of the 10 samplers.
Each dummy sampler will then be changed to produce a random number rather than a specific one.
Each sampler will have a different range with the first one being between 1 and 100 milliseconds, the second from 101 to 200 milliseconds with the pattern being repeated all the way to 901 to 1000 milliseconds in the last sampler.
This will give us 100 samples with response times between 1 millisecond and 1000 milliseconds.
Let's run our test!
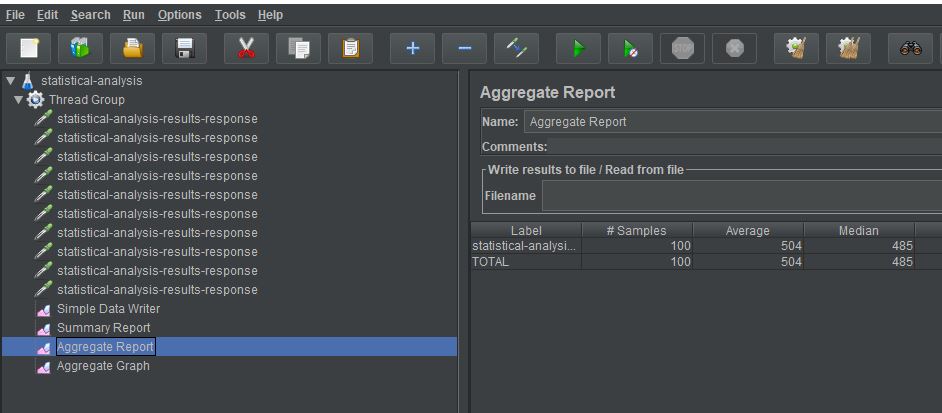
We will use the Aggregate Report to get the value as while the value is present in the Aggregate Graph they are obviously the same value.

Technique
The best way to look at the way these values are calculated are to put them into a spreadsheet as just listing them in this post does not make for easy reading.
Our simple data writer has created a .jtl file with the results and if we open this as a comma delimited file in spreadsheet then we can order the response times.
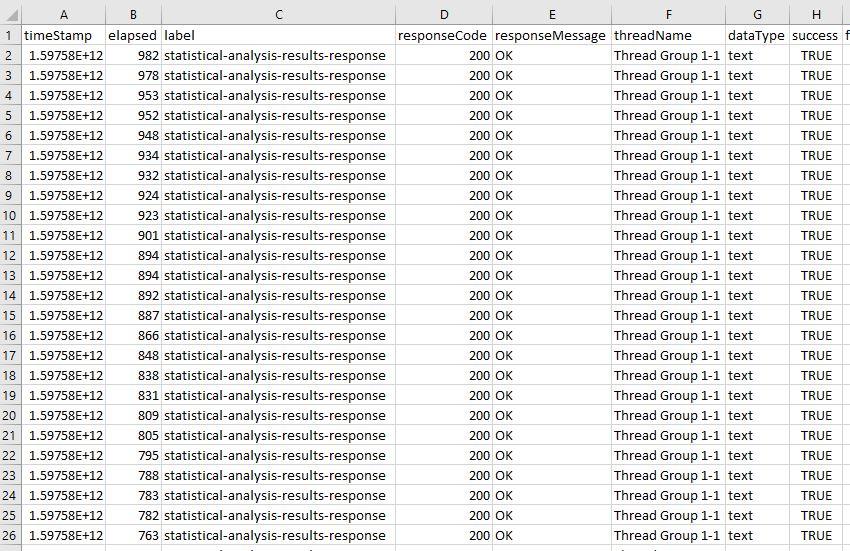
To get our 90th Percentile we take the value below the tenth value which is in row twelve in our example which matches our JMeter aggregate report value.
The 95th Percentile will be in the value below our fifth value which will be row seven and the 99th Percentile will be the value below the top one.
Uses for analysing results
If we look at the Aggregate Report we can see that the Percentiles are significantly higher than the average and give us a much better indication on how our application is performing.
If the Average and Percentiles are closer, then response times show little deviation and you can feel confident in the performance of your application.
Clearly our data in our example is engineered to be spread across a large range of values and data sets like this will be rare in real world examples and should be closer together.
Using Averages and Percentiles gives you a good indication of the range of your response times, and the closer they are the more confidence you should have in your applications performance.
Median
Definition
The Median is a useful value to understand, it is similar to the Average and it is useful to know how to calculate it.
Calculate the value
We will use the results from our previous test.
Technique
The Median is the middle number in a sorted, ascending or descending, list of numbers and can a better indication of overall performance than the average as the average can be influence by anomalous results.
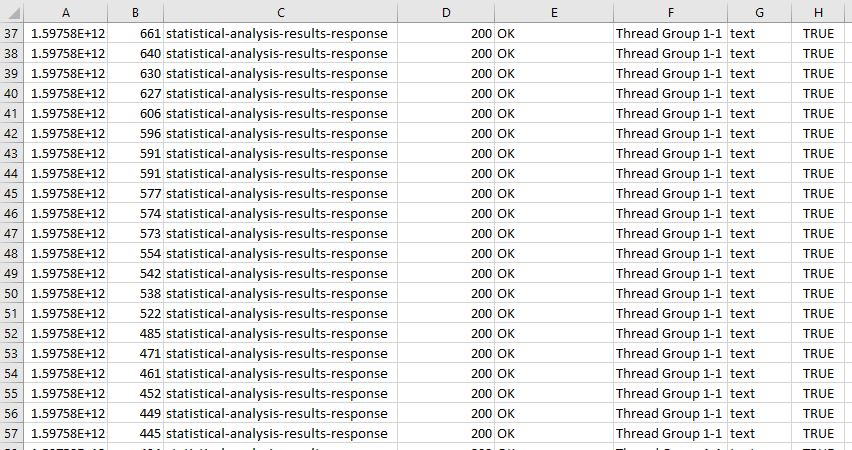
If we use our spreadsheet again we can see how JMeter produces this value.
We have an even number of samples in our results set so technically there is not a middle number, there are two numbers that occupy the middle positions, and these are values 50 and 51 as they both have 49 results either side of them.
Many text books say the Median is calculated by adding these two middle numbers together and dividing 2 but JMeter does not follow this approach and takes the lowest of these figures and displays that.
Uses for analysing results
The Median is like the average in terms of its uses and is used as a foundation for many other analysis techniques that you can explore if you choose.
Standard Deviation
Definition
The Standard Deviation helps you understand the spread of the data from the Mean, the more spread out the data the greater its Standard Deviation.
Calculate the value
To demonstrate Standard Deviation, we will go back to the test we used to demonstrate the Average calculation as that will only give us 10 samples which makes the technique section easier to understand.
As with the other statistical techniques the bigger your sample sizes the more accurate your results.

Technique
Ok this is not as easy as the others but clearly you will not be calculating this by hand for large samples, we will run through the process here.
The formula for standard deviation is:

It is not as difficult as it looks, lets look at our samples from our test in a spreadsheet first.

The first thing we need to do is to calculate the Mean which is the Average and this technique we have already discussed and will not repeat here, basically we add up the response times and divide by the number of samples.
The Mean of our sample is 550.3
In the formula above μ is the mean of all our values.
Then for each number subtract the Mean and Square the result, this is the part of the formula we are looking at here.

This is saying that for each value in our results we subtract the Mean and Square the result.
We will add this formula to our spreadsheet and calculate the results

We now need to find the mean of these calculated figures which we have discussed earlier but for completeness is a case of adding all the values together and dividing by the number of samples.
The part of the formula that deals with this is for the addition.

And this for the division by the number of samples.

If we apply this part of the formula to our calculated figures we get a value of 823430.21
This figure is known as the Variance.
To complete our Standard Deviation calculation, we get the Square Root of this value.

Which give us a Standard Deviation of 287.106 which matches the figure in the summary report
Clearly this is a large deviation, but this is because of our small, inaccurate results.
Let’s update our test and have a single dummy sampler with a random response time and a small range and we will execute the sampler 1000 times. You can download the updated JMX from here.
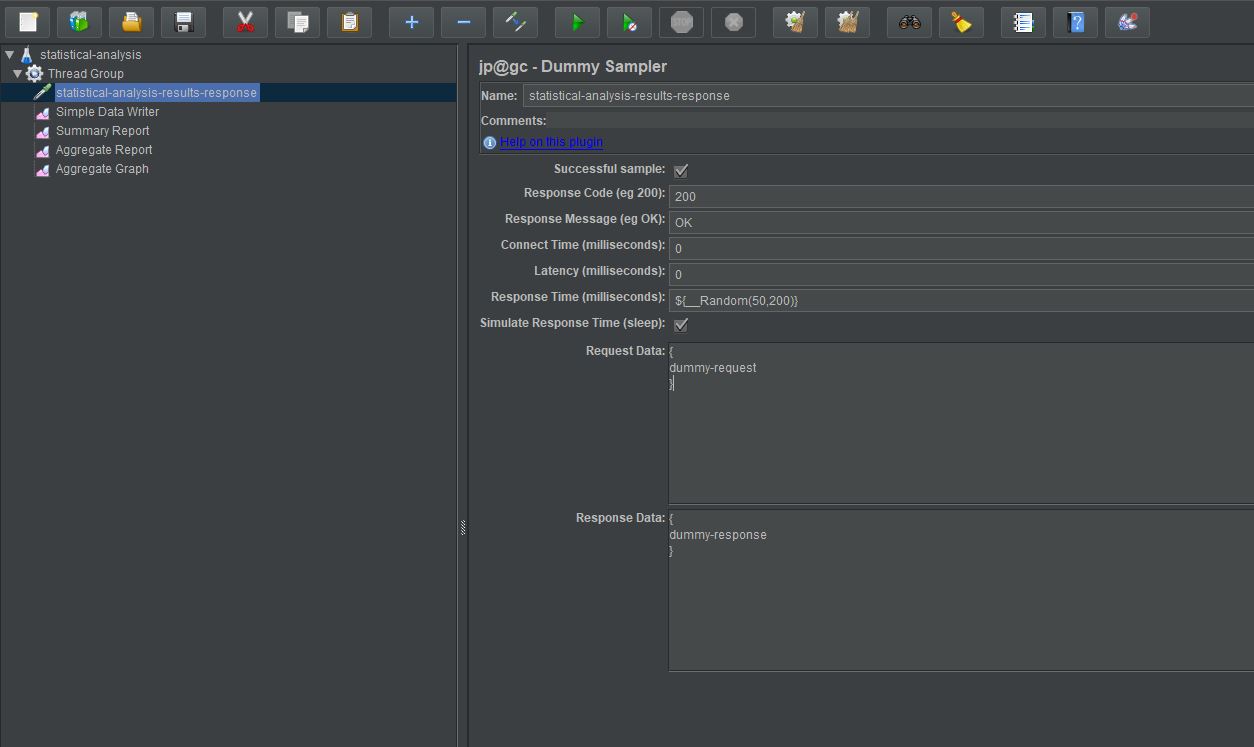
If we execute this test this gives us a smaller deviation of just over 44 milliseconds which shows us that our response times are nicely grouped and show little deviation.

Uses for analysing results
A small standard deviation is what you should be looking for in your results analysis as this means there is a high volume of consistency in your applications performance.
The greater the standard deviation the more inconsistent your application is.
Conclusion
This concludes all the statistical results produced with the standard JMeter listeners, there are others that are useful to know about which hopefully this post will give you the incentive to do
Understanding what these figures mean is important in analysing the performance of applications under test and hopefully this post goes some way to making the values, and their meaning, clearer.
OctoPerf provides all these figures in most graphs, make sure to have a look at this other post if you're interested to find out more.
