
We are Obsessed With Quality
As mentioned in our previous article, Are You Buying Quality Software, we aim to deliver features at fast pace while maintaining the highest possible code quality. Our last article about our code quality has been written more than one year ago, how are we doing today? The following sections get you an insight about the code quality of our backend server written in Java.
So you’re saying you have no bugs?
We're not saying our software doesn't have bugs. Every single piece of software has glitches or bugs. But, it's quite usual for us to fix a bug and release a patch the same day. We thoroughly test our software entirely to make sure most of the bugs get caught before going into production.
Ask one of our competitors reports about their code quality. We are pretty sure no one will ever give you that information. We think you must know what you pay for.
Sonarqube Analysis
Quality Profile
Our code quality analysis is based on Sonarqube, using a custom quality profile with more than 750 rules enabled.
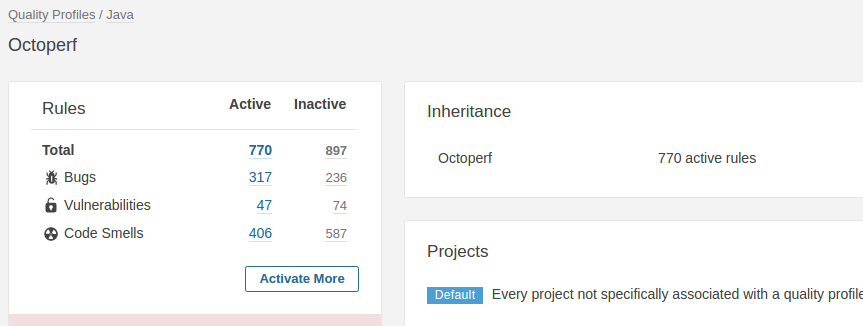
Our profile used last year had a little over 700 rules enabled. We try to slowly increase the number of rules checking the code to further improve code quality. Feel free to use our own quality profile inside your company to check their code against our coding rules. I'm pretty sure you will be surprised by the results.
General Overview
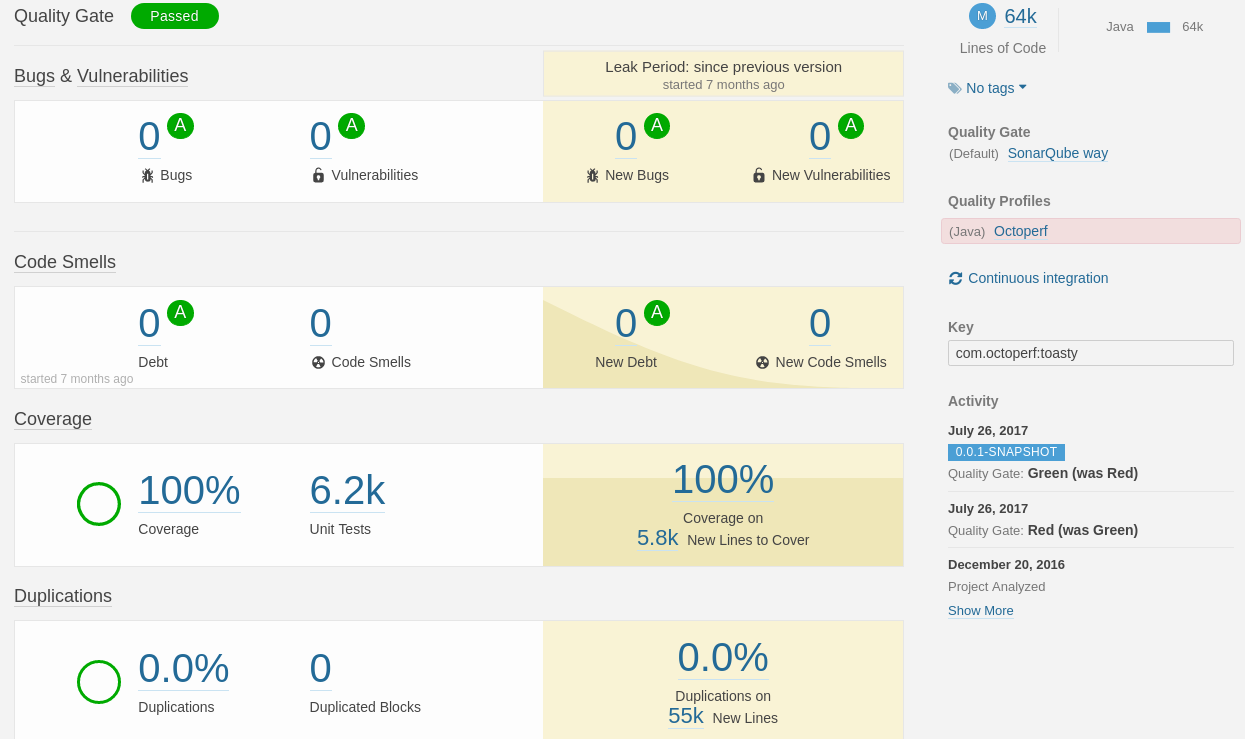
Let's first review the general metrics:
- Bugs and Vulnerabilities: none has been identified by Sonarqube,
- Code Smells: again, nothing could be found by any of the 770 rules enabled,
- Code Coverage: our unit tests cover 100% of the code,
- Code Duplication: no single line has been duplicated.
Compared to March 2016, the metrics have evolved as following:
- + 100% lines of code: our codebase increased from 32k to 64k lines of code,
- + 70% JUnits: we went from 3500 to 6200 junits, which means we are writing a little less tests than code, but still covering all the code being written.
There is nothing really exciting to show here and that's the point.
Measures
Reliability
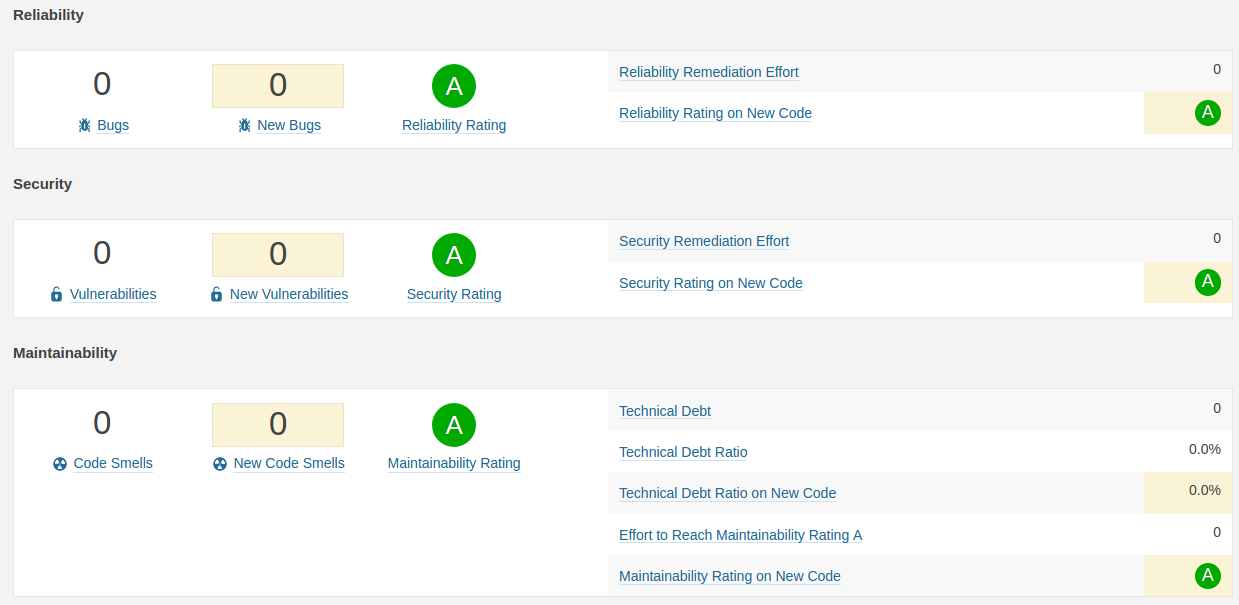
Nothing special here, no issues have been found by Sonarqube concerning Reliability, Security or Maintainability.
Coverage
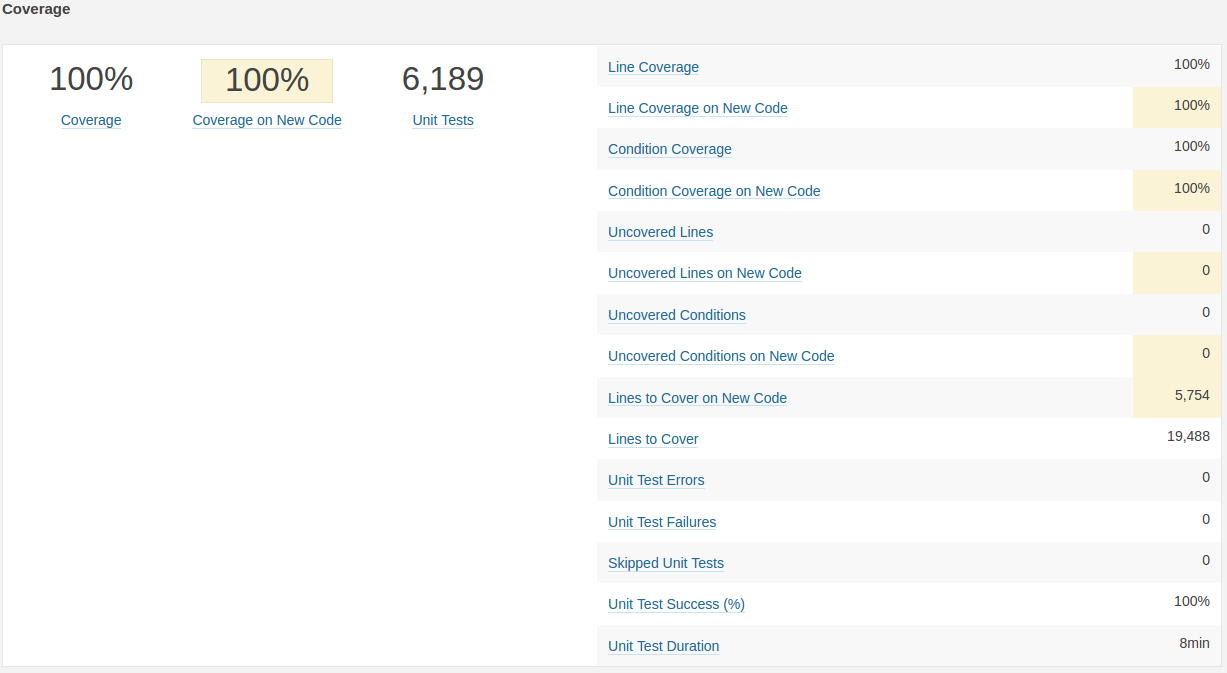
Our project is almost 3 years old now, and we still maintain 100% code coverage. While our codebase doubled its size compared to 2016 (32k to 64k), we disciplined ourselves to continue testing all the code. This is impressive considering the backend is maintained by a single person.
While 100% coverage doesn't guarantee there are no bugs, it makes it a lot easier to fix bugs if any is found. All the code is testable and being tested. When a bug is found, it's usually fixed in a few minutes. We write a unit test to reproduce the bug. Then we fix the code. Finally, we check the unit tests are all passing.
It only takes about 8 minutes to test 64k lines of code. This is about 8k lines tested per minute. Compared to a previous company where I worked, It took 24h to test 70% of 500k lines of code. This give a throughput of 0.25k lines tested per minute.
Duplications and size
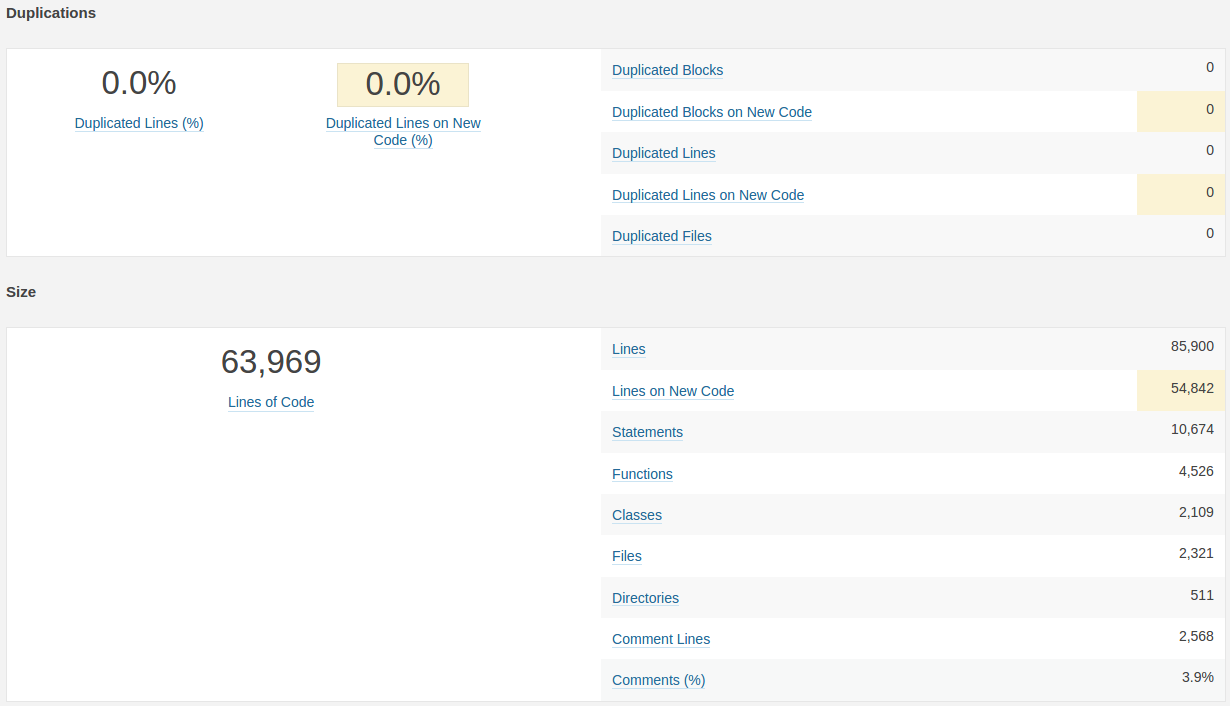
As said before, we have no code duplication. Our codebase is reaching almost 64k lines of code. But, if you look carefully, we can extract some interesting metrics from the code size:
- 85k lines vs 64k lines of code: only 75% lines are code,
- 10k statements: only 15% of the code is statements. Statements are lines of code doings things, excluding curly braces, class declaration and more,
- 4500 functions for 2100 classes: a little more than 2 functions per class on average,
- 64k loc for 2100 classes: about 30 loc per class on average.
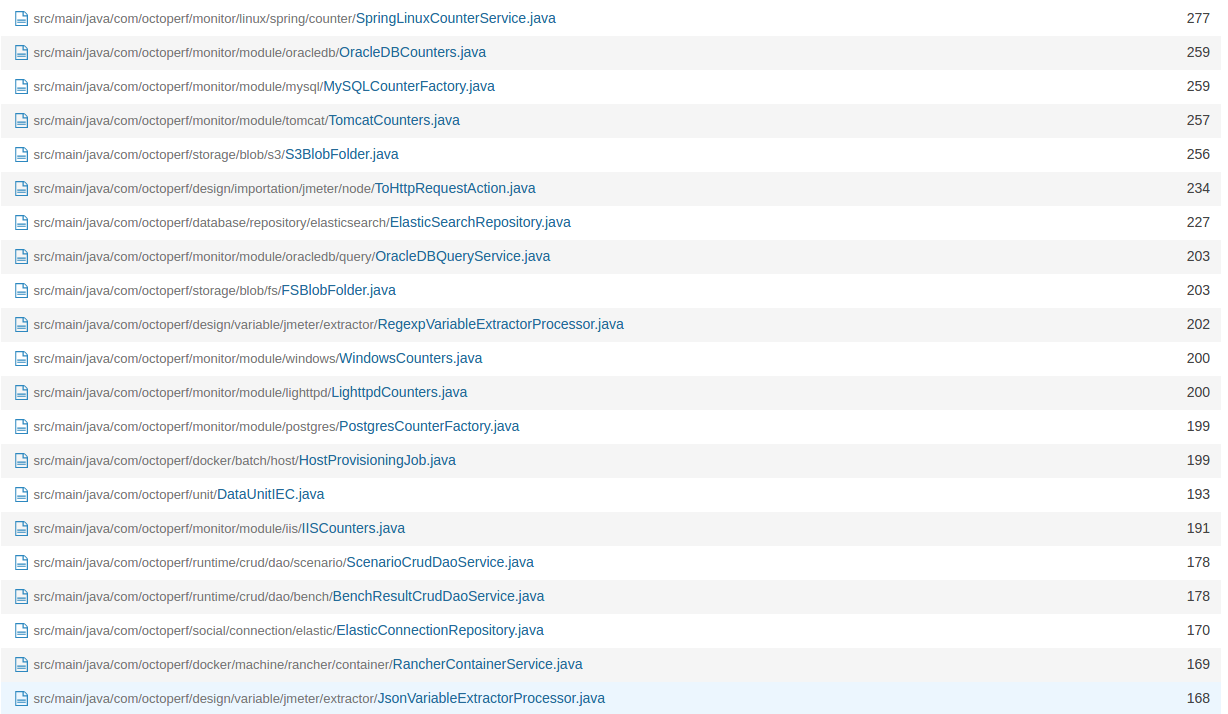
If we dive deeper into the code, we can see that we have only 12 classes whose size is >= 200 loc. The biggest classes are only declarative classes. For example, TomcatCounters is a class declaring all the Tomcat Monitor counters.
With more than 2100 classes for 64k lines of code, you quickly understand that we write mostly very small classes. We try to follow the SOLID principles, especially the Single Responsibility principle.
Most of the classes have less than 40 statements, with 5 statements per class on average (10k statements for 2.1k classes). Finally, there are very little comments. Good code should be self explanatory. We'd rather spend time make the code more understandable than commenting it.
Complexity and Issues
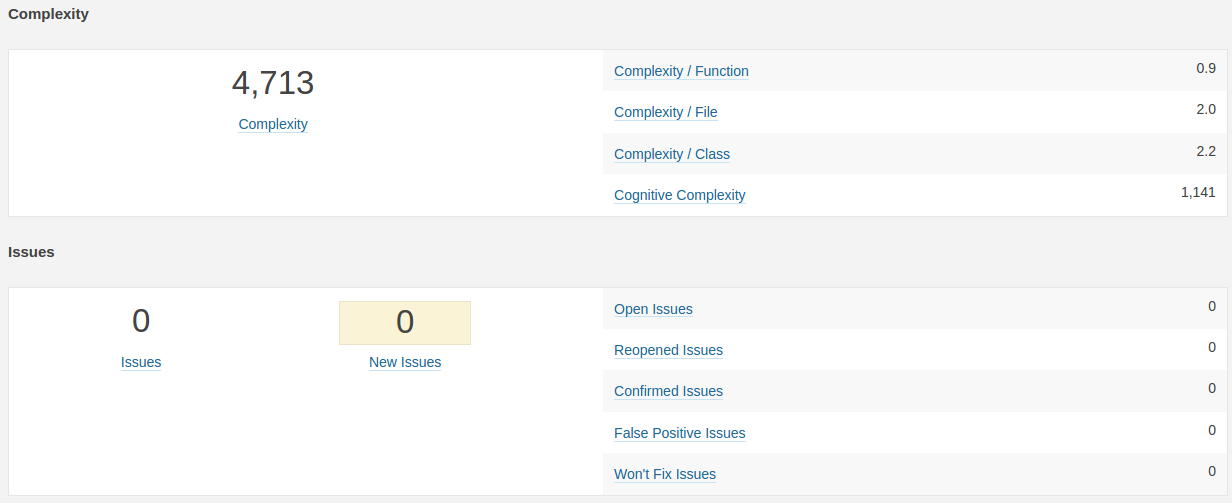
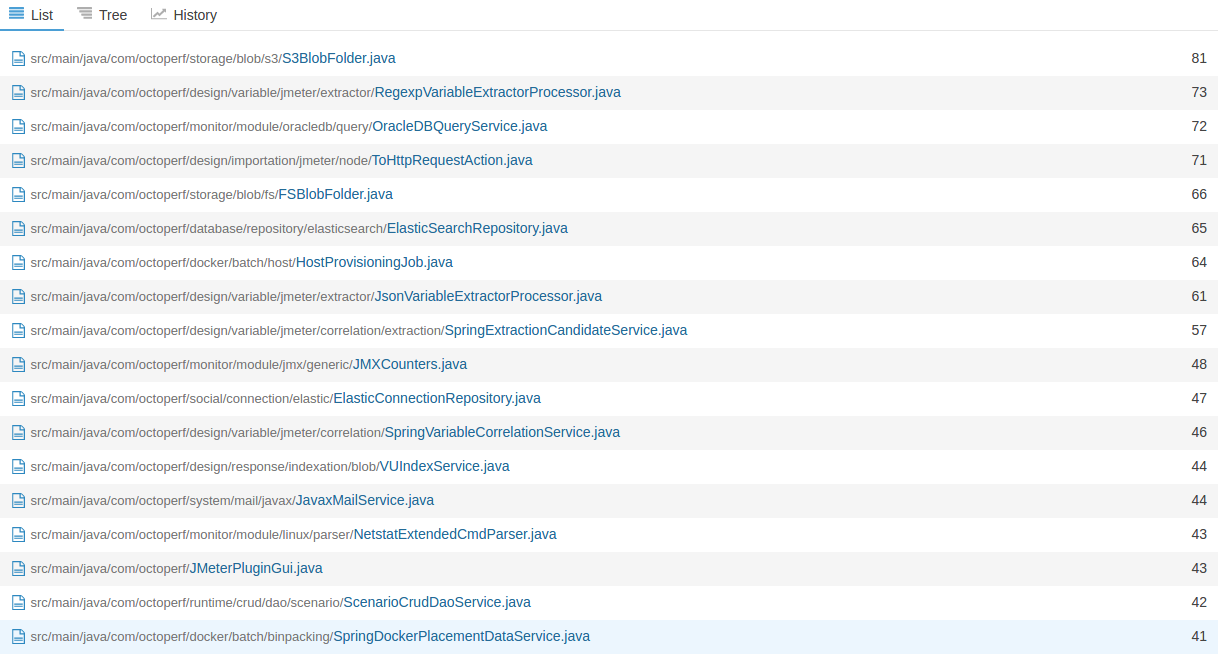
The overall software complexity is low. This correlates with the class size: classes are small, the overall complexity is distributed in a high number of classes. It means that complex problems are solved by splitting them in a high number of smaller sub-problems.
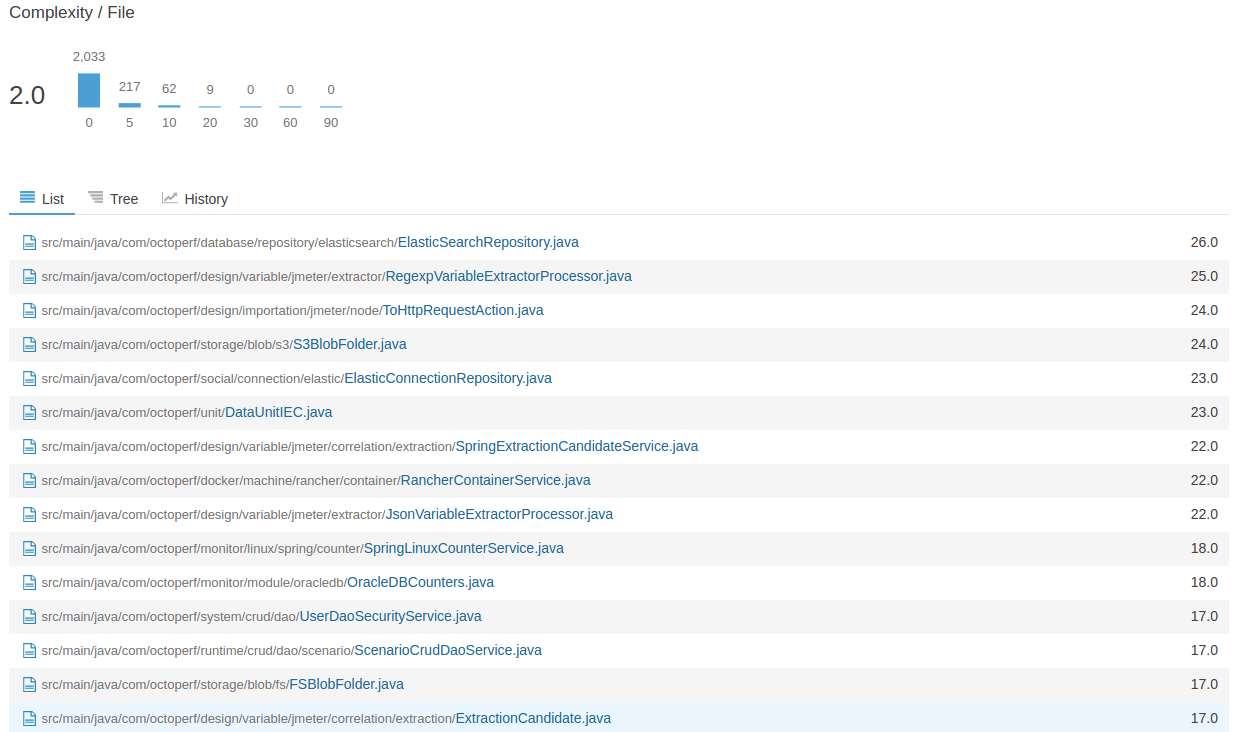
90% of the files have a complexity of just 1. The most complex class is representing a CRUD repository to perform basic database operations like find, save or delete.
Modules
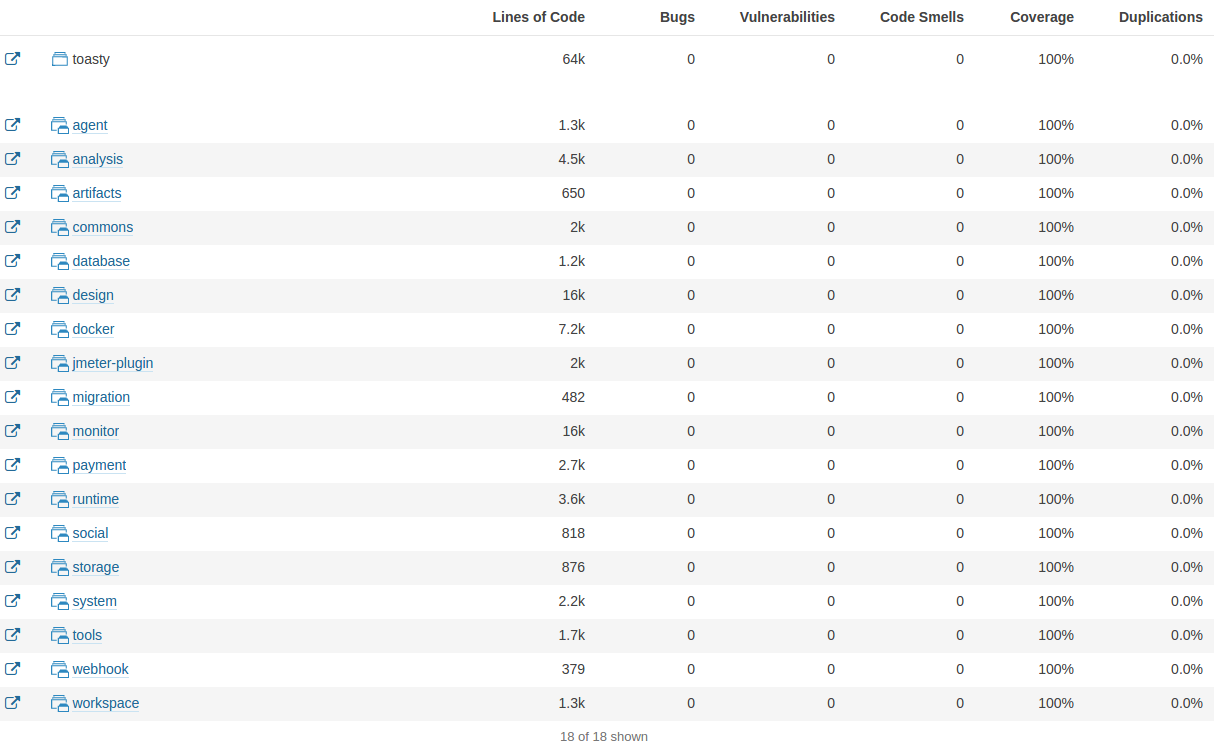
We have now 18 main maven modules and about 400 maven modules in total. The biggest parts of the backend are Design (everything related to designing a virtual user) and Monitor (monitoring Linux, Windows, Tomcat and more). Docker modules are third in size: these modules take care of all the interactions between OctoPerf and Rancher.
Final Words
We are maintaining this software for almost 3 years with very high quality expectations. Here is what we learnt:
- There are bugs: Bugs are inevitable, but there are few bugs,
- Bugs are easy to find: classes are so small and doing so little things, it's easy to spot issues,
- Bugs are easy to fix: as the whole code is being tested, adding a unit test to simulate the issue is very easy,
- Regressions are almost inexistent: previously fixed bugs are covered by unit tests, a regression immediately shows up in test reports,
- Adding new features is smooth: the existing code is always refactored to the point we can't improve it anymore. When adding a feature, it essentially consists of adapting the existing code to the new needs. This point is easy because the code is highly decoupled.